CORAL REEF HABITAT MAPPING USING MERIS: CAN MERIS DETECT CORAL
BLEACHING?
Arnold G. Dekker, Magnus Wettle, Vittorio E. Brando
CSIRO Land & Water, P.O. Box 1666, Canberra, ACT, Australia
ABSTRACT/RESUME
In this study we have performed in situ optical characterisation of reef waters and adjacent ocean waters and substratum type and cover. Next we developed an inversion optimisation method to infer water column composition, bathymetry and per pixel unmixing of substratum type and/or cover using MERIS FR scenes. Based on sensitivity analysis of the forward optical model, MERIS is capable of discriminating bleached corals from non-bleached corals to a sufficient degree to be practical down to depths of 10 m at least. We were able to discriminate bathymetry, major classes of live coral and sediment/rubble using MERIS. Although the results are preliminary it means that MERIS FR imagery may have the capacity to map coral reefs worldwide on a twice weekly basis. This could become a precursor to a global coral bleaching mapping system.
1 INTRODUCTION
There is a defined need for effective, worldwide monitoring of the health of coral reef systems, in particular coral bleaching. Coral bleaching events are a transient phenomenon. Coupled with the extent and remoteness of tropical reefs, this requires novel remote sensing based detection and monitoring approaches. A bleaching event normally lasts in the order of weeks. The coral will typically then either recover or die. In the latter case, it will be overgrown by colonizing turf algae, similar in appearance to many live corals. The Great Barrier Reef (GBR) in Australia illustrates the problems associated with the remoteness and extent of tropical coral reefs, containing approximately 2900 reefs and covering 350,000 km2. During the last two major bleaching events, (1998 and 2002) The Great Barrier Marine Park Authority (GBRMPA) has attempted to establish the extent and locations of the bleaching using traditional techniques such as divers for in-water surveys and deploying observers in aircraft. These approaches have several drawbacks, including the subjectivity of the observers, the dependency on flight conditions, as well the logistical costs in general.
Space-borne remote sensing, with it’s repetitive, broad scale coverage providing quantitative data in a spatial context, is often seen as the potential alternative tool for monitoring these ephemeral and often remote bleaching events. The bulk of coral reef remote sensing work to date has been image-based. Examples include exploring statistics within the imagery, developing band ratios and indices in an effort to circumvent the difficulties posed by bathymetry and water colour, and incorporating site specific data into supervised classifications. The problem with such approaches is that they tend to be site specific, sensor specific, and/or time specific [1].
In the case of coral remote sensing from satellite sensors, a physics-based method would allow for temporal and spatial variations in the reef water optical properties and be able to cope with spatially varying bathymetry. Such a method would significantly reduce the requirement for field or aerial survey approaches for mapping bleaching. Coral remote sensing applications require data of sufficient spectral resolution in order to account for the heterogeneity of coral benthos and the confounding effects of the overlying water column. Several imaging spectrometry sensors offer this resolution (e.g. CASI and HYMAP), but deploying such airborne platforms with the frequency and distribution necessary to monitor bleaching events is prohibitively expensive. There are several space-borne sensors available for coral mapping, notably the hyperspectral sensor Hyperion, but to date none has offered the combination of frequent re-visit time, spatial cover, high radiometric sensitivity, and sufficient spectral resolution (as perceived necessary for detecting bleaching events) of the recently launched MERIS sensor, specifically in its full resolution mode.
This study provides an initial assessment of the potential for applying a physics-based approach to MERIS data in order to map coral reefs and associated bleaching events. Ultimately, this could provide the basis for a coral health monitoring system.
2 METHOD
Our approach is to implement a semi-analytical model and optimization approach dubbed SAMBUCA (Semi-Analytical Model for Bathymetry, Un-mixing, and Concentration Assessment). This method, conceptualized by [2-4] has been modified considerably for the purpose of this study. In essence SAMBUCA expresses the measured remote sensing reflectance rrs measured (obtained from remote sensing image data) as a function of the relevant optical variables. This modelled remote sensing reflectance, rrs modelled, is then compared to rrs measured using a goodness-of-fit or, error function. The set of variables that minimises the difference between these two spectra is retained as the result of the minimisation. These variables are then used to estimate the environmental variables being sought. Specifically SAMBUCA estimates the concentrations of optically active constituents in the water column (chlorophyll, CDOM and tripton [tripton is the non-algal particulate matter]), water column depth, and benthic substrate composition that produces the best fit between modelled and measured rrs. These five environmental parameters are solved for on a pixel-by-pixel basis. The complete model parameterization is:
( )
(
C
C
C
X
X
q
H
S
S
a
Y
)
f
r
rs(
)
elled CHL,
CDOM,
TR,
PHY,
TR,
1
,
,
C,
TR,
* 0,
TR
mod
λ
λ
=
(1)
where
• CCHL is the concentration of chlorophyll a
• CCDOM is the concentration of CDOM where a*CDOM (550) is set to 1
• CTR is the concentration of tripton
• XPHY is the specific backscattering due to phytoplankton
• XTR is the specific backscattering due to tripton
• q1 is the ratio of substrate 1 to substrate 2 within each pixel
• H is the water column depth
• SC is the slope of the CDOM absorption
• STR is the slope of tripton absorption
• a*TR (550) is specific absorption of tripton at 550nm, which is sample dependent
• Y is the slope of the backscattering of both tripton and phytoplankton
Note that the set of environmental parameters for which SAMBUCA solves is configurable, and that SAMBUCA typically solves for water column depth, substrate composition in terms of relative contribution of two substratums, the concentrations of chlorophyll, CDOM and tripton. The remaining variables are determined through field work and laboratory analysis. The algorithm has been modified to account for the presence of two substrates within each pixel. The relative composition of each substrate is determined by the variable q1, described above. SAMBUCA cycles through a given spectral library, retaining the two substrates that allow for the best spectral fit. Additional output includes a warning when the measured reflectance is able to be modelled using an optically deep system as well as the modelled spectrum generated by SAMBUCA. SAMBUCA can also be run in 'forward' mode to generate a set of rrsmodelled spectra. For a given set of simulations, one or more variables can be varied, and the effect on rrsmodelled can be evaluated: e.g. rrsmodelled can be calculated for a substrate comprised of increasingly bleached coral through a range of water depths. The resulting subsurface remote sensing reflectance spectra can then used to evaluate the ability of various remote sensors to detect these changes in bleaching at different water depths. A field campaign was undertaken in May 2004 to investigate the optical properties of Heron Island waters, and parameterize SAMBUCA. The in situ instrument suite included an AC-9 absorption meter, a HYDROSCAT backscattering profiler, and 3 RAMSES submersible spectroradiometers. Laboratory analyses included HPLC measurements, TSS concentration estimation, and CDOM and phytoplankton absorption measurements. SAMBUCA was configured to invert for chlorophyll, CDOM, and tripton concentrations, as well as depth and substrate composition. The remaining six variables, SC , STR , a*TR (550), XPHY , XTR , and Y were fixed based on measurements from the May 2004 fieldwork. SAMBUCA results are highly sensitive to the substrate reflectance spectral library used as input. The resulting substrate maps estimated by SAMBUCA are restricted by the choice of input substrate spectra. A spectral library was devised that consisted of specific reflectance measurements of six different Acropora corals (the most abundant type of coral present at Heron), as well as sediment and sandy rubble (Fig. 1). The specific library was designed to represent the two most commonly occurring types of benthos at Heron: live Acropora sp. beds, and sediment/sandy rubble. To assess the extent of the bleaching, it is necessary to determine changes in percent cover of live coral cover and/or bleached coral.
Specific Heron reef substrate reflectance spectra
(note secondary axis for sediment)
0.00 0.05 0.10 0.15 0.20 0.25 450 500 550 600 650 700 wavelength (nm) Ltarge t / L pan el 0.00 0.10 0.20 0.30 0.40
sandy rubble Acropora echinata Acropora speciosa Acropora hyacinthus Acropora sp. Acropora aspera Acropora sediment
Fig. 1. The substrate reflectance library used as input to SAMBUCA, referred to as the ‘specific library’. Due to the high heterogeneity of tropical reef benthos, most coral reef applications of remote sensing presume the necessity for high spatial resolution data. The 300 m resolution of the MERIS sensor is therefore a potential problem. However, from a whole of GBR coral bleaching assessment point of view, MERIS FR is the best compromise. Related to the problem of spatial resolution is the issue of sensor wobble. For two given overpasses of the MERIS sensor, a specific pixel will not represent the exact same target for the two dates. As a rule of thumb, the positional accuracy of a remote sensor is considered to be +/- 0.5 of a pixel.
SAMBUCA requires the subsurface reflectance R(0-) as input. This is derived from the standard MERIS level 2 product for water leaving reflectance R(0+)M according to:
T
R
n
R
(
0
)
(
0
)
M 2+
=
−
(2)Where n is the index of refraction of water, and T is the transmittance across the air-sea interface. The formulation for transmittance is taken from the SEADAS radiative transfer code [5].
One pre-bleaching and two bleaching images of use-able MERIS level 2 reflectance data were acquired dated 12/12/03, 20/02/04, and 23/02/04 respectively. The three images were all acquired at relatively high tide.
In order to understand the precision and accuracy that can be achieved in the estimate of an environmental variable with remote sensing, it is necessary to estimate the overall sensitivity of the entire sensor-atmosphere-air-water interface system for detecting changes in radiance or reflectance. Two image-based measures are relevant: the environmental noise equivalent radiance difference (NE∆LE) and the environmental noise equivalent R(0-) difference (NE∆R(0-)E). These are dependent on the instrument SNR with added influences of noise in the image data such as atmospheric variability, the air water interface (with swell, wave and wavelet induced reflections), and refraction of diffuse and direct sky and sunlight. The NE∆R(0-)E is calculated from the at-sensor radiance image according to [6]: NE∆R(0-)E =σ(R(0-)), where σ(R(0-)) is the standard deviation in each band over an “as
homogeneous as possible” area of optically deep water within the image. In order to objectively determine the such an area in the MERIS scenes, we applied the ALCL algorithm as described in [7]. A suitable interval within which to assess a stable standard deviation in MERIS R(0-) data was found to be 5x5 through to 19x19 pixels. The NE∆R(0-)E spectra for the three data sets are similar in magnitude and shape, with the highest levels of
environmental noise - in the region of 0.18% - 0.27% - at the blue end of the spectrum. The 12/12/03 scene has the highest environmental noise, at 412 nm it is approximately 0.27% . In other words, for this sensor-atmosphere-air-water-interface system there are 370 (100/0.27) distinguishable levels in the data. Around 600 nm, there are 1250 (100/0.0008) distinguishable levels (or signal quanta) in the data for this date.
3 SENSITIVITY
ANALYSIS
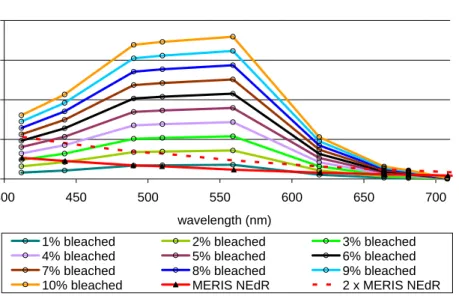
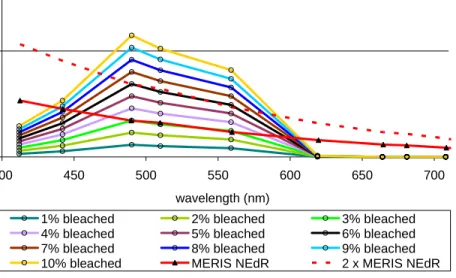
We assessed the spectral and radiometric sensitivity of MERIS to the effects of bleaching. Four benthic substrate reflectance spectra were used to simulate bottom albedo: live Acropora sp., bleached Acropora sp., sandy rubble, and sediment. Note that the percent cover of each substrate type is reported as a percent of the total. SAMBUCA was run in simulation mode (as discussed in the SAMBUCA section), generating subsurface reflectance R(0-) while the percent cover of bleached coral was varied. The results were filtered through the MERIS sensor’s response function. These simulations were performed for varying water column depths, here we report the results for 3 m and 10 m depth. Bleaching was increased from 0 -10% in 1% increments for each depth (an increasing water depth reduces the substratum signal at the surface). This variation was then plotted against the environmental noise equivalents determined from the MERIS data. The 12/12/03 NE∆R(0-)E was used as this contained the highest values measured for the three dates. We consider a change in R(0-) as theoretically measurable by MERIS if the change in three channels or more is greater than 2 levels of environmental noise in the data (2 x NE∆R(0-)E).
Effect of bleached Acropora sp. on MERIS R(0-) 3 m depth, Heron lagoon water type
0.000 0.005 0.010 0.015 0.020 400 450 500 550 600 650 700 wavelength (nm) Di ffer ence in R( 0-) fro m 0 % bl each ed cora l
1% bleached 2% bleached 3% bleached 4% bleached 5% bleached 6% bleached 7% bleached 8% bleached 9% bleached 10% bleached MERIS NEdR 2 x MERIS NEdR
Fig. 2. The change in R(0-) caused by adding 10% bleaching in 1% increments to a bottom substrate at 3 m depth. One and two levels of the NE∆R(0-)E of MERIS (as determined for the 12/12/03 image) are plotted with solid and dashed red lines respectively. The symbols along the spectra denote the location of the MERIS channels.
The results from this sensitivity analysis indicate the limits of what the MERIS sensor can detect, given this water type and this bleached coral reflectance spectra. Down to a depth of 5 m, the minimum amount of bleaching necessary for detection is low: less than 5%. This analysis does not necessarily imply that it is possible to correctly identify 5% bleaching at 5 m depth using MERIS data. It does however demonstrate that the MERIS sensor’s channel locations and signal-to-noise characteristics will not be a limitation in it’s ability to detect bleaching. One approach to detecting this change would be a time series of images, possibly using a statistical approach. In the event that the atmospheric correction, tide, and optical parameters of the water were identical throughout the time series (or could be normalized correctly), the minimum variations reported here could be attributable to bleaching. An alternative approach to a large scale satellite coral bleaching climatology study is to use a physics-based algorithm such as SAMBUCA. However, the change in R(0-) must then be correctly attributed to bleaching. Spectral ambiguities, caused in part by the choice of input spectral library as well as the extreme heterogeneity in a coral reef environment may offer several solutions to the minimum changes in R(0-) reported here (a simple example would be attributing the change in R(0-) to an increase in sediment substrate instead of bleaching). Since SAMBUCA works with R(0-), and not the change in R(0-) as simulated above, differing mixtures of benthic compositions will present differing spectral ambiguities.
To more fully understand the potential of this approach for detecting bleaching, a preliminary assessment of SAMBUCA’s ability to resolve bathymetry and substrate composition (which includes detecting bleaching) was performed on MERIS image data.
Effect of bleached Acropora sp. on MERIS R(0-) 10 m depth, Heron lagoon water type
0.000 0.005 400 450 500 550 600 650 700 wavelength (nm) Diff erence in R(0-) f rom 0% blea ched co ral
1% bleached 2% bleached 3% bleached 4% bleached 5% bleached 6% bleached 7% bleached 8% bleached 9% bleached 10% bleached MERIS NEdR 2 x MERIS NEdR
Fig. 3. The change in R(0-) caused by adding 10% bleaching in 1% increments to a bottom substrate at 10 m depth. One and two levels of the NE∆R(0-)E t of MERIS (as determined for the 12/12/03 image) are plotted with solid and dashed red lines respectively. The symbols along the spectra denote the location of the MERIS channels.
4 BATHYMETRY
RETRIEVAL
The bathymetry output from SAMBUCA for the three dates is shown in Fig. 4. The 12/12/03 scene and the 23/02/04 scene have similar tide height (2.3 m and 2.5 m resp.) and the corresponding depth maps show good agreement. We conclude that, within the spatial limitations of the data, SAMBUCA is able to infer bathymetry from the MERIS level 2 reflectance product to a high degree of accuracy.
12/12/03 (tide: 2.3 m)
20/02/04 (tide: 3.5 m)
23/02/04 (tide: 2.5 m)
Depth (m):
Fig. 4. Bathymetry maps from SAMBUCA for the three MERIS scenes. Depth intervals (in meters) are colour-coded according to the legend. Date and tide for each scene is marked.
5
BENTHIC SUBSTRATE AND CORAL BLEACHING RETRIEVAL
Figures 5 displays SAMBUCA substrate maps in the form of percent cover of coral and sediment, as generated using the specific library. To produce these maps, the six Acropora sp. spectra were combined into one coral class, and the sandy rubble and sediment classes were combined into the sediment class. This was motivated by our approach of considering a decrease of live coral and/or increase of sediment percent cover as a proxy indicator for the presence of coral bleaching. The changes in distribution of the eight different substrate classes represented by the 6 Acropora sp. spectra and the two sediment spectra are not relevant for this approach. The reason for using several spectra for the two categories (coral and sediment) is to provide SAMBUCA with sufficient spectra, or spectral variation, to correctly simulate the benthic substrates.
.
Fig. 5. Percent cover of coral (blue) and sediment (orange) for each pixel of the 20/02/04 MERIS scene. The perimeter of Heron reef is mapped as being comprised of live coral. This includes the western tip of the reef (next to the island) which is known to contain abundant cover coral. The percent cover indicated in Fig. 5 is
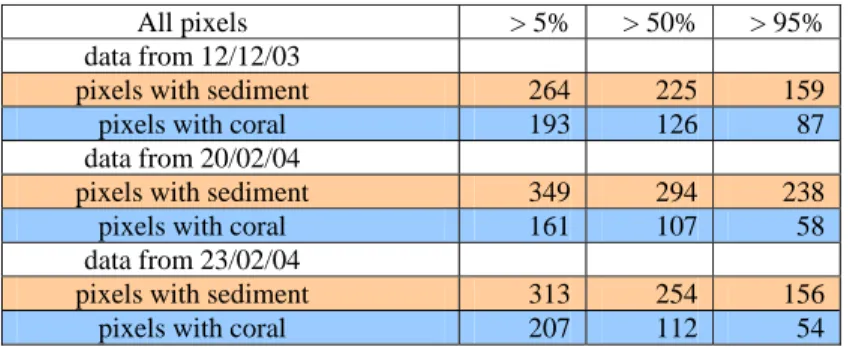
probably an overestimation of coral cover (as we force SAMBUCA to map any non-bright sediment/rubble/bleached coral as live coral). In comparing coral cover map from the three dates, the 12/12/03 scene appears to contain more pixels mapped with high (close to 100%) cover along the reef crest/perimeter. The two February scenes (bleaching event) appear to contain more 50-90% coral cover pixels. Analysis of these results indicates that the number of pixels containing more than 95% live coral, decreased from 87 for the 12/12/03 scene to 58 and 54 for 20/02/04 and 23/02/04 scenes respectively. Thus, as the total number of coral containing pixels does not follow this trend, it is probable that shift from live to bleached coral occurred. Similarly, an apparent increase in percent sediment cover may be a proxy for the presence of bleaching.
Table 1 supports this hypothesis: the number of pixels containing 95% or more sediment is approximately the same for 12/12/03 and 23/02/03 (159 and 156 respectively), but the number of pixels with 5% or more sediment is higher for the 23/02/04 scene (313 vs. 264 in 12/12/03/). The number of pixels with 5% or more sediment is also higher in
the 20/02/04 scene (349). In other words, there is an increase in the number pixels which contain a relatively small amount of a bright substrate.
In order to verify our approach, data is needed from more dates; preferably a large time series. Furthermore, the spatial resolution of MERIS makes it impractical to compare individual pixels between dates. We suggest that this approach also needs testing over larger areas, such as over several reefs or an entire region of reefs in the Great Barrier Reef.
Table 1. Number of pixels with more than 5%, 50% and 95% cover of sediment or coral for the MERIS scenes. All pixels > 5% > 50% > 95%
data from 12/12/03
pixels with sediment 264 225 159
pixels with coral 193 126 87
data from 20/02/04
pixels with sediment 349 294 238
pixels with coral 161 107 58
data from 23/02/04
pixels with sediment 313 254 156
pixels with coral 207 112 54
6 CONCLUSIONS
AND
RECOMMENDATIONS
The environmental dynamic range of the MERIS level 2 reflectance product is suitable for detecting changes in R(0-) due to coral bleaching. For example, three MERIS channels are able to detect the change caused by 4% bleaching (within a 300 x 300 m pixel) at 5 meters depth, given the water and substrate parameterization used in this work. The ability to detect bleaching using MERIS data is therefore not limited by the signal-to-noise characteristics of the sensor system.
SAMBUCA is able to generate bathymetry maps from the MERIS level two reflectance product. SAMBUCA was able to map broad substrate type zonations (sandy lagoon, coral –covered reef crest), as well as the optically deep water. When using a spectral library of just Acropora species, sediment and sandy rubble, the sandy lagoon and reef crest were correctly identified, although amount of live coral cover was probably over-estimated. Using these substrate maps, we suggest that changes in percent cover of live coral and/or sediment could be used as a proxy for a coral bleaching event. The statistics extracted from these substrate maps support our approach and the presence of a minor bleaching event, but the data set is too small to validate our assumptions.
Our study site was not ideally suited for confirming the detectability of bleaching: the bleaching was a minor localized event, and Heron reef only offers a limited amount of MERIS pixels containing sufficiently dense coral (along the reef crest and slope). Therefore, in order to further evaluate the ability of this physics-based approach for detecting bleaching using MERIS data, we recommend using a larger time series of data over a larger region of the Great Barrier Reef. Ideally, areas with shallow (less than 5 meters) and extensive Acropora beds should initially be targeted.
Although the results are preliminary it means that MERIS FR imagery may have the capacity to map coral reefs worldwide on a twice weekly basis. In addition, we would suggest focusing on a well-documented Great Barrier Reef-wide bleaching event, such as the one that occurred in summer of 2002 using existing MERIS RR data or acquiring a priori MERIS FR data for the entire GBR over the likely period of a bleaching event between December and April.
Finally, more work is needed in investigating temporal and spatial gradients of optical properties of coral waters. We recommend a refinement of the substrate spectral library used as input to SAMBUCA, including collecting
7 ACKNOWLEDGEMENTS
ESA and Carsten Brockman Consultancy for acquiring and processing the full resolution MERIS data. The University of Queensland for fieldwork assistance, data, and facilities (specifically Stuart Phinn, Chris Roelfsema, Karen Joyce, Alan Goldizen, Ian Leiper and staff at Heron Island Research Station). The World Bank Coral Project for staff and facilities. Lesley Clementson of CSIRO MAR for the optical laboratory analyses of field samples. CSIRO Wealth from Oceans and Earth Observation Centre for funding this project.
8 REFERENCES
1. Kutser, T., A. G. Dekker, and W. Skirving. Modelling spectral discrimination of Great Barrier Reef benthic communities by remote sensing instruments. Limn.& Oceanogr. 48: 497-510, 2003.
2. Lee, Z., K. L. Carder, C. D. Mobley, R. G. Steward, and J. F. Patch. Hyperspectral remote sensing for shallow waters: 2. deriving bottom depths and water properties by optimization. Applied Optics 38: 3831-3843, 1999.
3. Lee, Z., L. C. Kendall, R. F. Chen, and T. G. Peacock. Properties of the water column and bottom derived from Airborne Visible Imaging Spectrometer (AVIRIS) data. in press (IGR) 2001.
4. Lee, Z. P., K. L. Carder, C. D. Mobley, R. G. Steward, and J. S. Patch. Hyperspectral remote sensing for shallow waters. I. A semi-analytical model. Applied Optics 37: 6329-6338, 1998.
5. Feldman, G. C. Ocean Color SeaDAS. 2005.
6. Dekker, A. G. and S. W. M. Peters. The use of the Thematic Mapper for the analysis of eutrophic lakes: A case study in The Netherlands. International Journal of Remote Sensing 14: 799-822, 1993.
7. Wettle, M., Brando. V.E., and A. G. Dekker. A methodology for retrieval of environmental noise equivalent spectra applied to four Hyperion scenes of the same tropical reef. Remote Sensing of Environment 93: 188-197, 2004.