See important disclosures at the end of this report Powered by EFATM
Platform 1 Results Review, 18 February 2014
Sino-Thai Engineering & Construction PCL
(STEC
TB)
Buy
(Maintained)
Construction & Engineering - Construction
Target Price:
THB20.00
Market Cap: USD752m
Price:
THB15.90
กําไรรอบป 2556 เพิ่มขึ้น 58% (y-o-y)
Macro
Risks
Growth
Value
59 73 87 101 115 129 10 15 20 25 30 35Sino Thai Engineering & Construction Plc (STEC TB)
Price Close Relative to Stock Exchange of Thailand Index (RHS)
Source: Bloomberg
Avg Turnover (THB/USD) 197m/6.06m
Cons. Upside (%) 62.3 Upside (%) 25.8 52-wk Price low/high (THB) 11.9 - 32.3 Free float (%) 69 Shareholders (%) Mrs. Sanongnuch Charnvirakul 16.0
Thai NVDR Company Limited 7.4
UBS AG SINGAPORE 4.8
Shariah compliant
Kannika Siamwalla, CFA 66 2862 9744 [email protected]
Chun Phokaisawan +66 2862 2029 [email protected]
Forecasts and Valuations Dec-11 Dec-12 Dec-13 Dec-14F Dec-15F
Total turnover (THBm) 14,854 19,872 22,294 24,222 27,855
Reported net profit (THBm) 904 1,165 1,733 1,448 1,659
Recurring net profit (THBm) 904 1,165 1,439 1,448 1,659
Recurring net profit growth (%) 103.6 28.9 23.6 0.6 14.6
Recurring EPS (THB) 0.76 0.98 1.06 0.95 1.09 DPS (THB) 0.22 0.55 0.57 0.47 0.54 Recurring P/E (x) 20.9 16.2 15.0 16.7 14.6 P/B (x) 3.35 3.18 3.18 2.90 2.64 P/CF (x) 6.7 4.4 8.4 17.6 9.8 Dividend Yield (%) 1.4 3.5 3.6 3.0 3.4 EV/EBITDA (x) 7.89 3.97 4.02 5.09 4.04
Return on average equity (%) 17.9 20.1 25.6 18.1 18.9
Net debt to equity (%) net cash net cash net cash net cash net cash
Our vs consensus EPS (%) 0.0 0.0
Source: Company data, RHB estimates
กําไรในรอบป 2556 เพิ่มขึ้น 58% (y-o-y) เปน 1.73 พันลานบาทโดยบันทึกกําไรจาก การดําเนินงานที่แข็งแกรงถึง 1.4 พันลานบาท (+31% y-o-y) และรายการกําไรพิเศษ จากการปรับมูลคาพื้นฐานของสินทรัพยลงทุนมูลคา 294 ลานบาท โดยในป 2557 STEC วางแผนที่จะเขารวมประมูลโรงไฟฟาขนาดเล็ก (SPP) มูลคา 3.5 หมื่นลานบาท ซึ่งตามประวัติที่ผานมาเราคาดวา STEC จะชนะประมูลมูลคาราว 1 หมื่นลานบาท ยังคง แนะนํา “ซื้อ” ที่ราคาเปาหมายเทากับ 20.00 บาท (อิงจากคา PE 20x)
♦
ผลประกอบการไตรมาส 4/56 แข็งแกรง รายไดและกําไรในรอบไตรมาส 4/56 เพิ่มขึ้น 9.6% y-o-y และ 129.5% y-o-y ตามลําดับ เนื่องจากรายการกําไรพิเศษจากการปรับมูลคาพื้นฐานของสินทรัพย ลงทุนมูลคา 294 ลานบาท โดยรายไดมูลคา 5.9 พันลานบาทเปนไปตาม คาดการณของเราและ consensus ในขณะที่อัตรากําไรขั้นตนฟนตัวเปน 9.7% (9M56: 9.4%) และสัดสวนคาใชจาย SG&A ตอยอดขายลดลงเปน 1.4% (9M56: 2.7%) หนุนใหสัดสวนกําไรสุทธิเพิ่มขึ้นเปน 11.7% จากเดิม 6.5% ใน รอบ 9M56♦
กําไรจากการดําเนินการในรอบป 2556 เพิ่มขึ้นเปน 1.4 พันลานบาท รายไดจากการกอสรางของ STEC เทากับ 2.2 หมื่นลานบาท (+12% y-o-y) เปนไปในทิศทางเดียวกันกับเปาหมายของบริษัท ในขณะที่สัดสวนกําไรขั้นตน เพิ่มขึ้นเปน 9.5% จากเดิม 8.4% ในรอบป 2555 แตสัดสวนคาใชจาย SG&A ตอ ยอดขายลดลงเล็กนอยเปน 2.4% ในป 2556 จากเดิม 2.8% ในป 2555 ทั้งนี้ มูลคากําไรจากการดําเนินการ (กําไรสุทธิไมรวมรายการพิเศษ) เทากับ 1.4 พันลานบาท (+31% y-o-y) เปนไปในทิศทางเดียวกันกับคาดการณของเราและ consensus♦
มีแผนเขารวมประมูลโรงไฟฟาขนาดเล็ก (SPP) ในชวง 2H57 STEC วางแผนเขารวมประมูลโครงการโรงไฟฟาขนาดเล็กมูลคาราว 3.5 หมื่นลาน บาทในชวง 2H57 ซึ่งตามประวัติที่ผานมาเราคาดวา STEC จะชนะประมูลราว 30% ของโครงการที่เขารวมประมูลหรือคิดเปนมูลคาราว 1 หมื่นลานบาทหนุน ยอดงานในมือในรอบ 2H57 ใหเพิ่มขึ้น โดยโครงการโรงไฟฟาขนาดเล็กดังกลาว มีการเซ็นสัญญาซื้อขายไฟฟารวมกับการไฟฟาฝายผลิตแหงประเทศไทย (กฟผ.) แลว♦
ยังคงแนะนํา “ซื้อ” เราเชื่อวาราคาหุนไดสะทอน downside ที่เกิดขึ้นจากความลาชาของโครงการ รัฐบาลและภาวะเศรษฐกิจชะลอตัวไปแลว และจะมีการซื้อขายในราคา premium อีกครั้งหลังมีความชัดเจนทางการเมืองมากขึ้น ราคาเปาหมายเทากับ 20.00 บาท (อิงจากคา PE 20x) ซึ่งให upside ราว 30% ยังคงแนะนํา “ซื้อ”See important disclosures at the end of this report 2
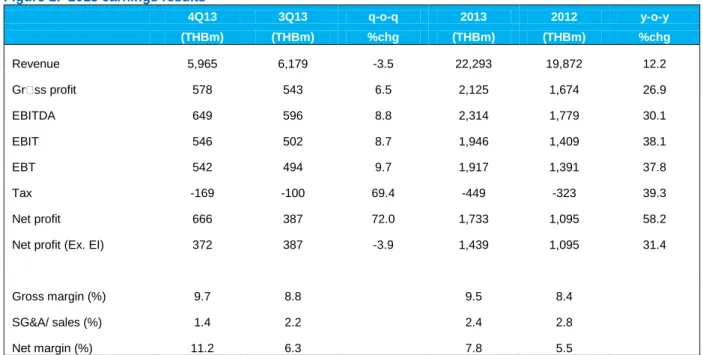
Figure 1: 2013 earnings results
4Q13 3Q13 q-o-q 2013 2012 y-o-y (THBm) (THBm) %chg (THBm) (THBm) %chg Revenue 5,965 6,179 -3.5 22,293 19,872 12.2 Grss profit 578 543 6.5 2,125 1,674 26.9 EBITDA 649 596 8.8 2,314 1,779 30.1 EBIT 546 502 8.7 1,946 1,409 38.1 EBT 542 494 9.7 1,917 1,391 37.8 Tax -169 -100 69.4 -449 -323 39.3 Net profit 666 387 72.0 1,733 1,095 58.2
Net profit (Ex. EI) 372 387 -3.9 1,439 1,095 31.4
Gross margin (%) 9.7 8.8 9.5 8.4
SG&A/ sales (%) 1.4 2.2 2.4 2.8
Net margin (%) 11.2 6.3 7.8 5.5
Source: RHB estimates
Figure 2: STEC’s sales growth & orderbook Figure 3: STEC’s P/E band
0 10 20 30 40 50 60 2006 2007 2008 2009 2010 2011 2012 2013F 2014F Backlog Revenue (THB bn) 0 5 10 15 20 25 30 35 40 45
Jun-05 Jun-06 Jun-07 Jun-08 Jun-09 Jun-10 Jun-11 Jun-12 Jun-13
(x) +2 sd: 32.8x +1 sd: 26.7x Mean: 20.7x -1 sd: 14.6x -1 sd: 8.5x
See important disclosures at the end of this report 3
Financial Exhibits
Profit & Loss (THBm) Dec-11 Dec-12 Dec-13 Dec-14F Dec-15F
Total turnover 14,854 19,872 22,294 24,222 27,855 Cost of sales (13,622) (18,198) (20,168) (22,139) (25,404) Gross profit 1,232 1,674 2,126 2,083 2,451 Selling expenses (482) (561) (539) (630) (752) Operating profit 750 1,113 1,587 1,453 1,699 Operating EBITDA 1,125 1,483 1,953 1,831 2,111 Depreciation of fixed assets (375) (370) (367) (378) (412)
Operating EBIT 750 1,113 1,587 1,453 1,699 Net income from investments 192 323 338 378 397
Interest expense (12) (18) (29) (21) (22)
Exceptional income - net - - 294 -
-Pre-tax profit 930 1,418 2,190 1,810 2,074 Taxation (23) (253) (449) (362) (415)
Minority interests (3) - (7) -
-Profit after tax & minorities 904 1,165 1,733 1,448 1,659 Reported net profit 904 1,165 1,733 1,448 1,659 Recurring net profit 904 1,165 1,439 1,448 1,659 Source: Company data, RHB estimates Cash flow (THBm) Dec-11 Dec-12 Dec-13 Dec-14F Dec-15F Operating profit 750 1,113 1,587 1,453 1,699 Depreciation & amortisation 375 370 367 378 412
Change in working capital 1,747 3,265 723 (440) 412
Other operating cash flow (191) (502) (1) (7)
-Operating cash flow 2,681 4,246 2,676 1,385 2,523 Interest paid (12) (18) (29) (21) (22)
Dividends received 169 296 360 378 397
Tax paid (23) (253) (449) (362) (415)
Cash flow from operations 2,815 4,271 2,557 1,380 2,483 Capex 1,382 (249) (517) (500) (300)
Other new investments (2,153) 136 (334) (24) (24)
Other investing cash flow 8 5 298 -
-Cash flow from investing activities (763) (108) (552) (524) (324)
Dividends paid (261) (652) (867) (724) (830)
Proceeds from issue of shares - - 339 -
-Increase in debt 62 115 (116) 125 19
Other financing cash flow (403) 56 (24) 37 0
Cash flow from financing activities (602) (481) (668) (561) (810)
Cash at beginning of period 2,057 3,507 7,189 8,663 8,821
Total cash generated 1,450 3,682 1,337 295 1,349 Implied cash at end of period 3,507 7,189 8,526 8,958 10,170
See important disclosures at the end of this report 4
Financial Exhibits
Balance Sheet (THBm) Dec-11 Dec-12 Dec-13 Dec-14F Dec-15F
Total cash and equivalents 3,507 7,189 8,663 8,821 10,170 Inventories 845 322 1,118 401 463 Accounts receivable 5,320 5,997 7,831 8,967 10,306 Other current assets 2,016 2,417 2,251 2,273 2,296
Total current assets 11,688 15,925 19,863 20,462 23,235
Total investments 2,312 2,211 2,497 2,522 2,547 Tangible fixed assets 2,074 2,160 2,650 2,908 2,796 Total non-current assets 4,386 4,371 5,146 5,430 5,343
Total assets 16,074 20,296 25,009 25,892 28,578
Short-term debt 115 192 108 208 227 Accounts payable 5,262 8,505 9,659 10,351 11,880 Other current liabilities 4,629 4,967 6,927 6,228 6,527
Total current liabilities 10,006 13,664 16,694 16,787 18,634
Total long-term debt 115 153 121 146 146 Other liabilities 115 367 418 427 437
Total non-current liabilities 230 520 539 573 583 Total liabilities 10,236 14,184 17,233 17,360 19,217
Share capital 1,186 1,186 1,525 1,525 1,525 Retained earnings reserve 2,269 2,508 3,851 4,575 5,404 Other reserves 2,180 2,236 2,250 2,250 2,250
Shareholders' equity 5,635 5,930 7,625 8,349 9,179
Minority interests 203 182 189 182 182 Other equity - - (37) -
-Total equity 5,838 6,112 7,777 8,531 9,361 Total liabilities & equity 16,074 20,296 25,009 25,892 28,578
Source: Company data, RHB estimates
Key Ratios (THB) Dec-11 Dec-12 Dec-13 Dec-14F Dec-15F
Revenue growth (%) 59.9 33.8 12.2 8.6 15.0
Operating profit growth (%) 79.0 48.4 42.6 (8.4) 16.9
Net profit growth (%) 103.6 28.9 48.8 (16.5) 14.6
EPS growth (%) 103.6 28.9 30.2 (25.7) 14.6
Bv per share growth (%) 25.7 5.2 0.0 9.5 9.9
Operating margin (%) 5.0 5.6 7.1 6.0 6.1
Net profit margin (%) 6.1 5.9 7.8 6.0 6.0
Return on average assets (%) 6.9 6.4 7.7 5.7 6.1
Return on average equity (%) 17.9 20.1 25.6 18.1 18.9
Net debt to equity (%) (56.1) (112.0) (108.5) (99.2) (104.7)
DPS 0.22 0.55 0.57 0.47 0.54
Recurrent cash flow per share 2.37 3.60 1.89 0.90 1.63
See important disclosures at the end of this report 5
SWOT Analysis
• Healthy orderbook
• Strong and solid balance sheet with a net cash position • Volatility in prices of construction materials • Delays in the implementation of Government-backed infrastructure projects • Massive infrastructure projects by the Government • Strong demand for power plants
• Contracts are long-term in nature
• Labour-intensive -40% -22% -4% 13% 31% 49% 67% 84% 102% 120% 0 5 10 15 20 25 30 35 40 45 J an -11 J an -12 J an -13 J an -14 J an -15
P/E (x) vs EPS growth
P/E (x) (lhs) EPS growth (rhs)
0% 3% 7% 10% 13% 17% 20% 23% 27% 30% 0.0 0.5 1.0 1.5 2.0 2.5 3.0 3.5 4.0 4.5 J an -11 J an -12 J an -13 J an -14 J an -15 P/BV (x) vs ROAE
P/B (x) (lhs) Return on average equity (rhs)
Source: Company data, RHB estimates Source: Company data, RHB estimates
Company Profile
Sino-Thai Engineering is one of the leading engineers and contractors in Thailand, with over 40 years of experience in private and public projects. Its competitive advantage lies in its extensive experience in the construction of power and petrochemical plants.
See important disclosures at the end of this report 6
Recommendation Chart
0 5 10 15 20 25 30 35Feb-09 May-10 Sep-11 Dec-12
Price Close NR 16.5 27.3 36.6 30.8 33. 0 32. 0 20. 0
Recommendations & Target Price
Buy Neutral Sell Trading Buy Take Profit Not Rated
Source: RHB estimates, Bloomberg
Date Recommendation Target Price Price
2014-02-03 Buy 20.0 13.8 2013-10-30 Buy 32.0 23.2 2013-05-13 Trading Buy 33.0 27.5 2013-04-17 Trading Buy 30.8 27.5 2013-02-14 Trading Buy 36.6 26.3 2012-11-07 Buy 27.3 17.9 2012-08-09 Buy 16.5 12.1
7 RHB Guide to Investment Ratings
Buy: Share price may exceed 10% over the next 12 months
Trading Buy: Share price may exceed 15% over the next 3 months, however longer-term outlook remains uncertain
Neutral: Share price may fall within the range of +/- 10% over the next 12 months
Take Profit: Target price has been attained. Look to accumulate at lower levels
Sell: Share price may fall by more than 10% over the next 12 months
Not Rated: Stock is not within regular research coverage
Disclosure & Disclaimer
All research is based on material compiled from data considered to be reliable at the time of writing, but RHB does not make any representation or warranty, express or implied, as to its accuracy, completeness or correctness. No part of this report is to be construed as an offer or solicitation of an offer to transact any securities or financial instruments whether referred to herein or otherwise. This report is general in nature and has been prepared for information purposes only. It is intended for circulation to the clients of RHB and its related companies. Any recommendation contained in this report does not have regard to the specific investment objectives, financial situation and the particular needs of any specific addressee. This report is for the information of addressees only and is not to be taken in substitution for the exercise of judgment by addressees, who should obtain separate legal or financial advice to independently evaluate the particular investments and strategies.
This report may further consist of, whether in whole or in part, summaries, research, compilations, extracts or analysis that has been prepared by RHB’s strategic, joint venture and/or business partners. No representation or warranty (express or implied) is given as to the accuracy or completeness of such information and accordingly investors should make their own informed decisions before relying on the same.
RHB, its affiliates and related companies, their respective directors, associates, connected parties and/or employees may own or have positions in securities of the company(ies) covered in this research report or any securities related thereto, and may from time to time add to, or dispose off, or may be materially interested in any such securities. Further, RHB, its affiliates and related companies do and seek to do business with the company(ies) covered in this research report and may from time to time act as market maker or have assumed an underwriting commitment in securities of such company(ies), may sell them or buy them from customers on a principal basis and may also perform or seek to perform significant investment banking, advisory or underwriting services for or relating to such company(ies), as well as solicit such investment, advisory or other services from any entity mentioned in this research report.
RHB and its employees and/or agents do not accept any liability, be it directly, indirectly or consequential losses, loss of profits or damages that may arise from any reliance based on this report or further communication given in relation to this report, including where such losses, loss of profits or damages are alleged to have arisen due to the contents of such report or communication being perceived as defamatory in nature.
The term “RHB” shall denote where applicable, the relevant entity distributing the report in the particular jurisdiction mentioned specifically herein below and shall refer to RHB Research Institute Sdn Bhd, its holding company, affiliates, subsidiaries and related companies.
All Rights Reserved. This report is for the use of intended recipients only and may not be reproduced, distributed or published for any purpose without prior consent of RHB and RHB accepts no liability whatsoever for the actions of third parties in this respect.
Malaysia
This report is published and distributed in Malaysia by RHB Research Institute Sdn Bhd (233327-M), Level 11, Tower One, RHB Centre, Jalan Tun Razak, 50400 Kuala Lumpur, a wholly-owned subsidiary of RHB Investment Bank Berhad (RHBIB), which in turn is a wholly-owned subsidiary of RHB Capital Berhad.
Singapore
This report is published and distributed in Singapore by DMG & Partners Research Pte Ltd (Reg. No. 200808705N), a wholly-owned subsidiary of DMG & Partners Securities Pte Ltd, a joint venture between Deutsche Asia Pacific Holdings Pte Ltd (a subsidiary of Deutsche Bank Group) and OSK Investment Bank Berhad, Malaysia which have since merged into RHB Investment Bank Berhad (the merged entity is referred to as “RHBIB”, which in turn is a wholly-owned subsidiary of RHB Capital Berhad). DMG & Partners Securities Pte Ltd is a Member of the Singapore Exchange Securities Trading Limited. DMG & Partners Securities Pte Ltd may have received compensation from the company covered in this report for its corporate finance or its dealing activities; this report is therefore classified as a non-independent report.
As of 17 February 2014, DMG & Partners Securities Pte Ltd and its subsidiaries, including DMG & Partners Research Pte Ltd do not have proprietary positions in the securities covered in this report, except for:
a) -
As of 17 February 2014, none of the analysts who covered the securities in this report has an interest in such securities, except for: a) Sino-Thai Engineering & Construction PCL
Special Distribution by RHB
Where the research report is produced by an RHB entity (excluding DMG & Partners Research Pte Ltd) and distributed in Singapore, it is only distributed to "Institutional Investors", "Expert Investors" or "Accredited Investors" as defined in the Securities and Futures Act, CAP. 289 of Singapore. If you are not an "Institutional Investor", "Expert Investor" or "Accredited Investor", this research report is not intended for you and you should disregard this research report in its entirety. In respect of any matters arising from, or in connection with this research report, you are to contact our Singapore Office, DMG & Partners Securities Pte Ltd
Hong Kong
This report is published and distributed in Hong Kong by RHB OSK Securities Hong Kong Limited (“RHBSHK”) (formerly known as OSK Securities Hong Kong Limited), a subsidiary of OSK Investment Bank Berhad, Malaysia which have since merged into RHB Investment Bank Berhad (the merged entity is referred to as “RHBIB”), which in turn is a wholly-owned subsidiary of RHB Capital Berhad.
8 RHBSHK, RHBIB and/or other affiliates may beneficially own a total of 1% or more of any class of common equity securities of the subject company. RHBSHK, RHBIB and/or other affiliates may, within the past 12 months, have received compensation and/or within the next 3 months seek to obtain compensation for investment banking services from the subject company.
Risk Disclosure Statements
The prices of securities fluctuate, sometimes dramatically. The price of a security may move up or down, and may become valueless. It is as likely that losses will be incurred rather than profit made as a result of buying and selling securities. Past performance is not a guide to future performance. RHBSHK does not maintain a predetermined schedule for publication of research and will not necessarily update this report
Indonesia
This report is published and distributed in Indonesia by PT RHB OSK Securities Indonesia (formerly known as PT OSK Nusadana Securities Indonesia), a subsidiary of OSK Investment Bank Berhad, Malaysia, which have since merged into RHB Investment Bank Berhad, which in turn is a wholly-owned subsidiary of RHB Capital Berhad.
Thailand
This report is published and distributed in Thailand by RHB OSK Securities (Thailand) PCL (formerly known as OSK Securities (Thailand) PCL), a subsidiary of OSK Investment Bank Berhad, Malaysia, which have since merged into RHB Investment Bank Berhad, which in turn is a wholly-owned subsidiary of RHB Capital Berhad.
Other Jurisdictions
In any other jurisdictions, this report is intended to be distributed to qualified, accredited and professional investors, in compliance with the law and regulations of the jurisdictions.
Kuala Lumpur Hong Kong Singapore
Malaysia Research Office
RHB Research Institute Sdn Bhd Level 11, Tower One, RHB Centre
Jalan Tun Razak Kuala Lumpur
Malaysia Tel : +(60) 3 9280 2185 Fax : +(60) 3 9284 8693
RHB OSK Securities Hong Kong Ltd. (formerly known as OSK Securities
Hong Kong Ltd.)
12th Floor World-Wide House 19 Des Voeux Road Central, Hong Kong Tel : +(852) 2525 1118 Fax : +(852) 2810 0908
DMG & Partners Securities Pte. Ltd.
10 Collyer Quay #09-08 Ocean Financial Centre
Singapore 049315 Tel : +(65) 6533 1818 Fax : +(65) 6532 6211
Jakarta Shanghai Phnom Penh
PT RHB OSK Securities Indonesia (formerly known as PT OSK Nusadana
Securities Indonesia)
Plaza CIMB Niaga 14th Floor Jl. Jend. Sudirman Kav.25 Jakarta Selatan 12920, Indonesia
Tel : +(6221) 2598 6888 Fax : +(6221) 2598 6777
RHB OSK (China) Investment Advisory Co. Ltd. (formerly known as OSK (China) Investment
Advisory Co. Ltd.)
Suite 4005, CITIC Square 1168 Nanjing West Road
Shanghai 20041 China Tel : +(8621) 6288 9611 Fax : +(8621) 6288 9633
RHB OSK Indochina Securities Limited (formerly known as OSK Indochina Securities Limited)
No. 1-3, Street 271 Sangkat Toeuk Thla, Khan Sen Sok
Phnom Penh Cambodia Tel: +(855) 23 969 161 Fax: +(855) 23 969 171
Bangkok
RHB OSK Securities (Thailand) PCL (formerly known as OSK Securities (Thailand) PCL)
10th Floor, Sathorn Square Office Tower 98, North Sathorn Road,Silom
Bangrak, Bangkok 10500 Thailand Tel: +(66) 2 862 9999 Fax : +(66) 2 108 0999
Thai Institute of Directors Association (IOD) – Corporate Governance Report Rating 2013
ADVANC BCP CPF ERW IVL NKI PS ROBINS SCB SNC TCAP TMB UV
AOT BECL CPN GRAMMY KBANK NOBLE PSL RS SCC SPALI THAI TNITY VGI
ASIMAR BKI CSL HANA KKP PAP PTT S&J SCSMG SPI THCOM TOP WACOAL
BAFS BROOK DRT HEMRAJ KTB PG PTTEP SAMART SE-ED SSI THRE TRC
BANPU BTS DTAC ICC LPN PHOL PTTGC SAMTEL SIM SSSC TIP TRUE
BAY CIMB EASTW INTUCH MCOT PR QH SAT SIS SVI TASCO TTW
BBL CK EGCO IRPC MINT PRANDA RATCH SC SITHAI SYMC TKT TVO
2S AYUD CNT GL KKC MBK OISHI SABINA STANLY TK TTCL zZMICO
ACAP BEC CPALL GLOW KSL MBKET PB SAMCO STEC TLUXE TUF
AF BFIT CSC GOLD KWC MFC PDI SCCC SUC TMILL TWFP
AHC BH DCC GSTEL L&E MFEC PE SCG SUSCO TMT TYM
AIT BIGC DELTA GUNKUL LANNA MODERN PF SEAFCO SYNTEC TNL UAC
AKP BJC DTC HMPRO LH MTI PJW SFP TASCO TOG UMI
AMANAH BLA ECL HTC LHBANK NBC PM SIAM TCP TPC UMS
AMARIN BMCL EE IFEC LHK NCH PPM SINGER TF TPCORP UP
AMATA BWG EIC INET LIVE NINE PPP SIRI TFD TPIPL UPOIC
AP CCET ESSO ITD LOXLEY NMG PREB SKR TFI TRT UT
APCO CENTEL FE JAS LRH NSI PRG SMT THANA TRU VIBHA
APCS CFRESH FORTH JUBILE LST NWR PT SNP THANI TSC VIH
ASIA CGS GBX KBS MACO OCC PYLON SPCG THIP TSTE VNG
ASK CHOW GC KCE MAJOR OFM QTC SPPT TICON TSTH VNT
ASP CM GFPT KGI MAKRO OGC RASA SSF TIPCO TTA YUASA
*** PHATRA was voluntarily delisted from the Stock Exchange of Thailand effectively on September 25,2012
A BCH CRANE FPI IT MBAX PICO SGP TBSP TPP WIN
AAV BEAUTY CSP FSS JMART MDX PL SIMAT TCCC TR WORK
AEC BGI CSR GENCO JMT PRINC POST SLC TEAM TTI
AEONTS BLAND CTW GFM JTS MJD PRECHA SMIT TGCI TVD
AFC BOL DEMCO GJS JUTHA MK PRIN SMK TIC TVI
AGE BROCK DNA GLOBAL KASET MOONG Q-CON SOLAR TIES TWZ
AH BSBM DRACO HFT KC MPIC QLT SPC TIW UBIS
AI CHARAN EA HTECH KCAR MSC RCI SPG TKS UEC
AJ CHUO EARTH HYDRO KDH NC RCL SRICHA TMC UOBKH
AKR CI EASON IFS KTC NIPPON ROJNA SSC TMD UPF
ALUCON CIG EMC IHL KWH NNCL RPC STA TMI UWC
ANAN CITY EPCO ILINK LALIN NTV SCBLIF SUPER TNDT VARO
ARIP CMR F&D INOX LEE OSK SCP SVOA TNPC VTE
AS CNS FNS IRC MATCH PAE SENA SWC TOPP WAVE
BAT-3K CPL FOCUS IRPC MATI PATO SF SYNEX TPA WG
*** CIMBI was voluntarily delisted from the Stock Exchange of Thailand effectively on September 25, 2012.
IOD (IOD Disclaimer)