HAL Id: hal-02275646
https://hal.archives-ouvertes.fr/hal-02275646
Submitted on 1 Sep 2019
HAL
is a multi-disciplinary open access
archive for the deposit and dissemination of
sci-entific research documents, whether they are
pub-lished or not. The documents may come from
teaching and research institutions in France or
abroad, or from public or private research centers.
L’archive ouverte pluridisciplinaire
HAL
, est
destinée au dépôt et à la diffusion de documents
scientifiques de niveau recherche, publiés ou non,
émanant des établissements d’enseignement et de
recherche français ou étrangers, des laboratoires
publics ou privés.
for people counting in a crowded area
Songchenchen Gong, El-Bay Bourennane
To cite this version:
Songchenchen Gong, El-Bay Bourennane. A method based on texture feature and edge detection for
people counting in a crowded area. Digital Image and Signal Processing (DISP’19), Apr 2019, Oxford,
United Kingdom. �hal-02275646�
A method based on texture feature and edge detection
for people counting in a crowded area
Gong songchenchen
Université Bourgogne Franche-Comté Laboratoire LE2I
Dijon, France [email protected]
El-Bay Bourennane
Université Bourgogne Franche-Comté Laboratoire LE2I
Dijon, France [email protected]
ABSTRACT
We propose a population counting method for feature fusion and edge detection.The image is extracted from multiple information sources to estimate the count by image feature extraction and texture feature analysis, as well as for crowd head edge detection. We count people in high-density still images.For example, in the city bus station, subway. Our method uses a still image taken by the camera to estimate the count in the crowd density image, using multiple sources of information, namely: HOG, LBP, CANNY, these sources provides separate estimates of the number of counts and other statistical measures, through the support vector Machine SVM, classification, and regression analysis to obtain high-density populations. This method can get good results in crowded scenes.
Keywords
HOG, LBP, SVM, CANNY.
1.
INTRODUCTION
Counting the number of people in these years has become a hot topic because people are paying more and more attention to safety awareness. With the improvement of living standards, there are countless kinds of entertainment activities, and it also brings hidden dangers to people's safety. In fact, it is extremely important to accurately estimate the number of people in public areas for security control, to prevent people in some areas from exceeding a certain level, and to provide early warning. A stampede on the Bund in Shanghai, China, takes place on New Year's eve, December 31, 2014. In order to prevent such accidents, some people in some areas need to accurately estimate the number of people in real time, take safety measures, evacuate the crowd, and avoid the occurrence of the stampede.
Figure 1. This figure shows four arbitrary images from the dataset used in this paper.
2.
Related work
There are many methods that have been used for crowd detection and counting. Some of the efficient techniques are:
The HOG feature is used to detect the human head. Dalal et al. (2005) first use the HOG feature for the pedestrian detection in the static image. The main idea is to use the gradient histogram of the local region to describe the target feature. HOG features combined with Support Vector Machine (SVM) classifier for head detection, SVM classifier training and head detection are divided into two stages [1].
Propose a model that combines sources of information extracted from the images. Dense crowds can be thought as
a texture that corresponds to a harmonic pattern of fine scales. Counts from texture analysis methods: crowds are repetitive in nature since all human appear similar from a distance. We will adopt three different texture analysis methods which separately give an estimate of the count [2-5].
The Bayesian 3D model based method solves the problem of human detection in crowded scenes. Find the best configuration and its corresponding shape model by specifying the human head and foot detectors. In the model matching process, the solution is obtained in a way that balances the computational cost and the performance. Results on various data show the effectiveness of the proposed method [6].
According to the people counting method based on head detection and tracking to evaluate the number of people who move under an over-head camera. The main methods are: foreground extraction, head detection, head tracking, and crossing-line judgment. Using an effective foreground extraction method to obtain mobile the foreground area of the person, and some morphological operations are used to optimize the foreground area. Based on the head tracking, a cross-line determination is used to determine if the head object is counted [7-9].
A novel integrated framework for the analysis of crowds including all relevant aspects as simulation, detection and tracking of pedestrians and dense crowds and event detection. It utilizes an appearance-based approach for object detection since this method has been successfully applied for very small objects. Track the pedestrian using the Bayesian tracking method. Graph-based event detection using hidden Markov models HMM [10].
The method of combining global with local edge detection to extract edge. Based on the adaptive smoothing algorithm of Canny operator, the local area detection method is selected for edge extraction. Local edge detection which uses a distance weighted average method based on k-average method can overcome the impact of outliers on clustering effect. Complete image edge is getting through an edge detection method that combines global with local [11].
Detect the crowd, use the point of interest detector to specify the image of the head area, and then count the number of people in the crowd [12,13].
A deep-learning approach to estimate the number of individuals in the mid-level crowd visible in a still image. The proposed deep-learning framework is used to learn a feature-count regression, which can estimate the number of people within each part, and the crowd estimation in the whole image is therefore the sum of that in all parts [14,15].
Based on MID foreground segmentation module, it provides active areas of the head-shoulder detection module to detect head and count the number of people [16-19].
3.
Proposed system
We propose a population counting method for feature fusion and edge detection. By image feature extraction and texture feature analysis, and for crowd head edge detection, the fusion of counts
from multiple sources is used to estimate the count. We use high-density still images to count the number of people.
3.1
HOG based Head Detections
HOG is used for head detection [1-2]. Locally normalized HOG descriptors perform better than existing feature sets (including wavelets). Compared to the edge direction histograms and SIFT descriptors, the HOG is calculated on a grid-sized uniform cell units, and in order to improve performance, overlapping local contrast normalization is also used.
In a static image, the representation and shape of the local target can be well described by the gradient or an edge direction density distribution. Its basis is the gradient of statistical information, and the gradient mainly exists on the edge of the space. In order to reduce the effect of light factors, we firstly normalize the image. For the texture intensity of the image, the proportion of the local surface exposure is larger. Therefore, the compression process can effectively reduce the image of the local shadow and light changes. Because the function of color information does not work well, images are usually converted to grayscale. We calculate the gradient of the image abscissa and the ordinate direction, as well as the gradient direction value for each pixel position. The guidance operation captures the edge, silhouette and some texture information, further weakening the lighting effects. The gradient of the pixel (x, y) in the image is:
H
x y
H
y
Gx x,y ,1 x ,1 (1)
,
,
1
,
1
yx
y
H
x
y
H
x
y
G
(2)Where Gx, Gyrepresents the horizontal gradient, vertical gradient,
and H (x, y) pixel values of the pixel (x, y) in the input image. The gradient and gradient directions at the pixel (x, y) are:
x,y G
x,y 2 G
x,y 2 G x y (3)
y
x
Gy
y
x
G
y
x
x,
,
tan
,
1 (4)A gradient orientation histogram is constructed for each cell unit. We divide the image into several "cells", each cell consisting of 8*8 pixels. Suppose we use nine bin histograms to count the 8*8 pixel gradient information. We divide the gradient of the cell by 360 degrees into nine directions. Due to changes in local illumination and changes in the foreground and background contrast, the range of gradient intensity is very large. This requires normalizing the gradient intensity. Normalization can further illuminate light, shadows, and edge compression. The approach we take is to combine the individual cell units into large blocks and spatially connected intervals. Normalizing the HOG feature vector in the block and introducing v to represent a vector that has not been normalized. It contains all histogram information for a given block. According to the ||V_{k}|| standard, where k is 1 or 2, and e is a small constant. At this point, the normalization factor can be expressed as follows:
2 2 2 || || norm -2 e V v f L , (5)
We refer to the normalized block descriptors (vectors) as HOG descriptors. In this way, the HOG descriptor becomes a vector consisting of the histogram components of all cell units in each interval. A vector with HOG feature dimensions.
3.2
LBP feature
The Local Binary Patterns (LBP) were first proposed by T. Ojala, M.Pietikäinen, and D. Harwood. LBP is a simple but very effective texture operator [7]. It compares each pixel with its nearby pixels and saves the result as a binary number. The most important advantage of LBP is its robustness to changes in grayscale such as illumination changes. Its other important feature is its simple calculation, which makes it possible to analyze the image in real time. The basic LBP operator is defined as the 3*3 window. Using the value of the center pixel of the window as the threshold, the gray value of the adjacent 8 pixels is compared with it. If the surrounding pixel value is greater than the central pixel value, the pixel value is of the location is marked as '1'. Otherwise, it is '0'. In this way, the 8 points in the 3*3 neighborhood can be compared to produce 8-bit binary numbers (usually converted to decimal numbers, is 256 types of LBP codes), which is to get the LBP value of the pixel in the center of the window, and use this value to reflect the texture information of the area, for example: 00010011. Each pixel has 8 adjacent pixels, and 28possibilities.
The basic LBP feature for a given pixel is formed by thresholding the 3x3 neighbourhood with the centre pixel value as the threshold, where(Xc,Yc) is the center pixel, ic is the intensity of the centre pixel and in (n=0,1,2....7) pixel intensities from the neighborhood. The LBP is given by:
1 02
,
P n n c n c cY
s
i
i
X
LBP
(6)Where P is the number of sample points and:
else
x
if
x
0
0
1
s
(7)The LBP could be interpreted as an 8-bit integer. The basic LBP concept is presented in Figure 2:
Figure 2. Illustration of the standard LBP operator. The image is taken from the Daimler pedestrian dataset.
When the LBP operator is used for texture classification or face recognition, the statistical histogram of the LBP mode is often used to express the image information, and more pattern types will make the data volume too large and the histogram too sparse. Therefore, it is necessary to reduce the dimension of the original
LBP mode so as to best represent the image information in the case of a reduced data amount. In order to solve the problem of too many binary patterns and improve statistics, we proposed a "Uniform Pattern" to reduce the dimension of LBP operator's pattern. In an actual image, most LBP patterns only contain at most two transitions from '1' to '0' or from '0' to '1'. When a loop binary number corresponding to an LBP change from '0' to '1' or from '1' to '0' at most twice, the binary corresponding to the LBP is called an equivalent pattern class. For example, 00000000 (0 jumps), 00000111 (only one transition from '0' to '1'), and 10001111 (first jump from '1' to '0', then '0' to '1' and two jumps in total) are all equivalent modes class. The modes other than the equivalent mode class are classified as another class, called a mixed model class, such as 10010111 (a total of four transitions). With this improvement, the variety of binary patterns are greatly reduced without losing any information. The number of modes is reduced from the original 2P to P (P-1)+2, where P represents the number of sampling points in the neighborhood set. For the 8 sampling points in the 3*3 neighborhood, the binary pattern is reduced from the original 256 to 58. This allows the feature vector to have fewer dimensions and can reduce the effects of high-frequency noise.
3.3
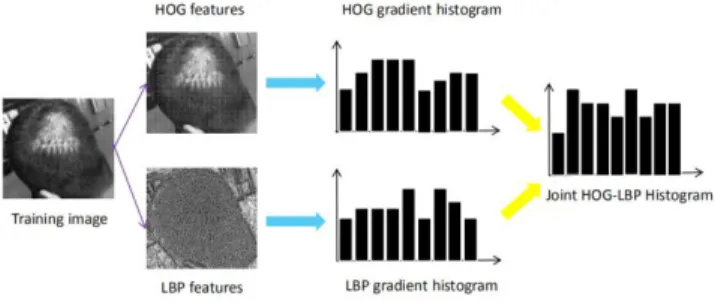
Training of joint HOG-LBP classifiers
Feature extraction is one of the most critical aspects of human head detection. Extracting features with distinguishing the significance plays an important role in the accurate detection of the human head. Our work integrates the features of HOG and LBP, which not only combines the effective identification information of multiple features, but also eliminates most of the redundant information, thereby realizing effective compression of information, saving information storage space, and facilitating the acceleration of operations and real-time processing of information. Here we use a serial fusion approach, as shown in Figure 3:
Figure 3. Joint HOG-LBP Histogram.
Here, we use support vector machines to achieve the optimal classification of linearly separable data. For a linear SVM with the training samples {(xi,yi),1≤i≤N}, where xi is the ith instance
sample, yi is the corresponding category labels(i.e.,the expected
response),its decision surface equation can be expressed as:
0
x
b
(8)Where x is the input vector, ω is the dynamically variable weight vector,and b is the offset. In essence to find an optimal classifier is to find an optimal hyper plane, according to formula(8), which can not only separate two classes correctly but also maximize the between-class distance. Accordingly,support vectors refer to the training sample points located in the classification boundaries, which are the key elements of the training sample set. Based on these theories and concepts, the following formula is used to classify the input samples:
k i aiyi xi x b x f 1 sgn (9)where ai is the weight coefficient corresponding to the support
vector xi.
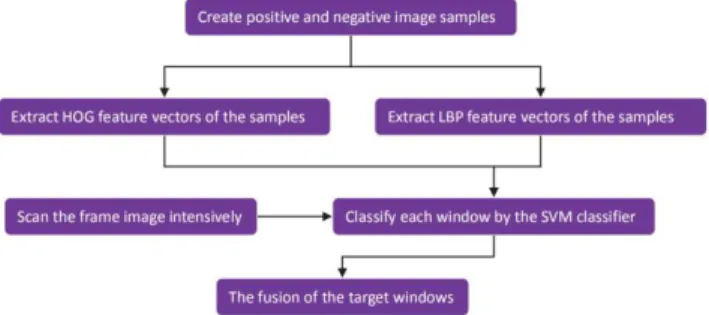
The next step, we connect the sample HOG feature vector and the LBP feature vector in series to form a joint feature vector input SVM. Here, in the classification process, the linear inseparable low-dimensional space is converted into a linearly separable high-dimensional space mainly through SVM kernel functions and use the cross-validation method to select the SVM optimal parameters, so that the classifier has the highest classification accuracy of the input training samples. In accordance with the above method, the training process for joint HOG-LBP SVM classifiers are shown in Figure 4:
Figure 4. Training process for joint HOG-LBP SVM classifiers.
3.4
Canny based head edge detection
Analysis of the principles of the Canny edge detection algorithm of Canny operator in the Gaussian filtering process were in-depth study [11], and to use first order partial derivatives of the finite difference to calculate the magnitude and direction of the gradient is extended, are calculated by using the four directions, effectively improve the accuracy of Canny edge detection.
First of all, denoise by using, Gaussian filtering, Its purpose is to smooth the original image and remove or weaken the noise in the image. Assuming two dimensional Gauss's function:
exp
2
2
1
,
y
2x
2y
2x
G
(10)Gradient vector:
To improve the speed of decomposition method, the 2 filter at convolution template G is decomposed into 2 one-dimensional filters:
kxe e h
h y x y x G a y a x 2 1 2 2 x , , 2 2 2 2
( 12)
kxe e h
h x y y x G ya a x 2 1 2 2 y , , 2 2 2 2
(13)Where k is a constant, σ is Gaussian filter parameters. It controls the degree of smoothing. The σ filter, although the positioning accuracy is high, but the signal to noise ratio is low; σ is the opposite, so according to the need to adapt to the selection of Gaussian filter parameter σ .
We adopt a new 3x3 neighborhood in calculating the gradient amplitude. The procedure is as follows:
The partial derivatives of the 4 directions are calculated at first: Partial derivative of x direction:
,
,
1
,
1
x
x
y
G
x
y
G
x
y
P
(14)Partial derivative of y direction:
x
y
G
x
y
G
x
y
P
y,
,1
,1
(15)45 degree directional partial derivative:
,
-
,1
1
,1
-
1
45
x
y
G
x
y
G
x
y
P
(16)135 degree directional partial derivative:
,
,1
1
-
,1
-
1
135
x
y
G
x
y
G
x
y
P
(17)Difference in horizontal direction:
x
,
y
P
x
,
y
P
45
x
,
y
P
135
x
,
y
/
2
f
x
x
(18)Difference in vertical direction:
,
,
45
,
135
,
/
2
y
x
y
P
x
y
P
x
y
P
x
y
f
y
(19)The gradient magnitude is obtained:
x
,
y
f
x
,
y
2f
x
,
y
2M
x
y (20)The gradient direction is:
y
x
f
y
x
f
y
x
y x,
,
arctan
,
(21)The method takes into account the pixel diagonal direction, increase the pixels to compute the partial derivative direction, improves the traditional canny operator, uses differential mean value calculations, and improve the accuracy of the positioning of the edge.
Then, non-maxima suppression of gradient amplitude:the gradient of the non-maxima suppression, only according to the gradient magnitude image is not enough to determine the edge, in order to determine the edge must be in the refinement of the gradient
y
/
x
/
G
G
G
(11)magnitude image ridge belt, so as to produce the refinement edge. Non-maxima suppression through inhibition of gradient direction of the non-roof peak of the gradient magnitude to refine the gradient magnitude of the roof.
Finally, dual threshold detection and edge linking:non- maximum suppression,the gradient array processing after thresholding. Marginal discriminant: every edge intensity above a high threshold of edge points; every edge strength less than low threshold is definitely not the edge points; if the edge strength are higher than the lower threshold than the high threshold, then look at the pixel adjacent pixels in no more than the high threshold of edge points and if there is, it is the edge point, if not, it is not the edge points.
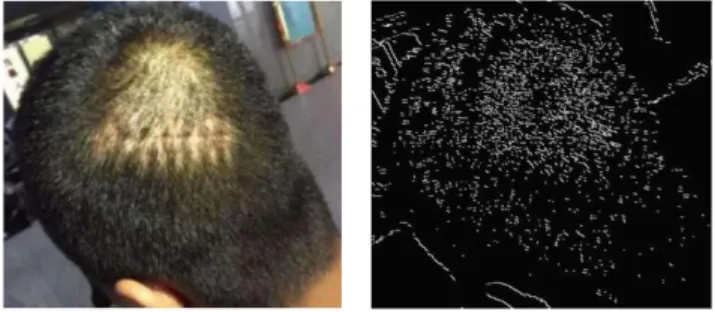
Through the Canny operator's detection of the head image, we can get a clear head outline shown in figure 5:
Figure 5. The original image (left) and the output (right) of the Canny algorithm.
We propose the optimization of the Canny operator. We use advanced the Gauss filter, its purpose is to the original image smoothing processing to remove or reduce the image noise. Then, the first order partial derivative of finite difference to calculate the gradient magnitude and direction of the expansion, the calculation of four directions, effectively improve the canny edge detection accuracy. Then, non-maxima suppression through inhibition of gradient direction on all non-roof peak gradient magnitude to refine the gradient magnitude. Finally, non-maxima suppression processing after the gradient amplitude array threshold value of the high and low threshold edge points, reduce the false edge segments Number, get the image.
By optimizing the Canny operator, the effect of noise on the image can be reduced, and the image data can be better preserved, making it easier to find the outline of the head image for extraction.
3.5
Training of joint HOG-LBP-CANNY
classifiers
It is shown by the study of the human visual system, image boundary is particularly important, often a rough outline of the line alone can by identifying an object. This fact for machine vision research provides important enlightenment, namely: objects available the boundary represented by the grayscale image discontinuous points consisting of basic original carrying the original image of the vast most useful information. In addition, the edge of the seat easily integrated into a wide variety of object recognition algorithm, in a broad sense, all visual information
processing process it can be summed up as a combination of discontinuities (edges) and matching two operations.
Here, we obtain a clear head contour, fusion feature extraction and texture feature analysis by edge detection of the head image, and combine the information sources from multiple sources to estimate the counting population. The process is as follows:
Figure 6. Crowd counting .
4.
Experimental Results
In order to objectively verify the performance of the algorithm proposed, some experiments were made for it and some frequently-used algorithms. Our experiment is mainly divided into two parts: the first part is the pedestrian detection, and the second part is the counting of the crowd pictures.
The first part of the experiment: The training set we used contained 500 head, face images clipped manually and enough non-head face images from some sample sets including INRIA, PETS2000, and MIT. During training negative samples can be selected as needed automatically from the background images. The test set contains 500 images with or without pedestrians, including about 1,500 apparent head face and covering various scenes, angles, postures, and clothing, etc. The algorithm is embodied in a program developed with Matlab 2017a function library.
Extract sample HOG, LBP texture features and CANNY head contour edge detection:
Sample HOG feature calculation steps: For each positive and negative sample set, each size of 32*32 grayscale pictures (in this case, the grayscale picture is used to consider the effect of the size of the calculation, and the final detection result has little effect), and the rectangular HOG feature is calculated. Descriptor: The set cell size is 8*8, the size of the block is 16*16, and the slide step size is the width of a Cell. The specific process of HOG feature calculation is as follows: To reduce the influence of lighting, the sample is first Gamma standardization of images. Then calculate the gradient of x and y directions for each pixel in the grayscale image, and use the [-1,0,1] template to calculate the direction and amplitude of the gradient. In each Cell, set the projection direction to 9 bins, and use the gradient magnitude of each pixel as the weight, and vote to count the weighted histograms of gradient directions of each Cell. The dimension of this histogram is 9. Four cells in a Block (with overlaps between Blocks) are normalized using L2-norm, and the gradient histograms of four cells are counted, and the dimension is 36. Finally, all blocks in the image are concatenated, and the dimension of the obtained HOG feature vector is calculated.
Sample LBP feature calculation steps: For each positive and negative sample set, each size is a 32*32 grayscale image, and
LBP feature extraction based on a sliding window is used. The general description of the sliding window for the image algorithm is as follows: In an image of size W*H, the w*h window (W>>w, H>>h) is moved according to a certain rule, and a pixel in the window is performed. In the series operation, the window moves one step to the right or down after the operation is completed, until the entire image is processed. Set the size of the window to 16*16, and set the window's horizontal and vertical sliding steps to half the width of the window. The specific process of the LBP feature calculation is as follows: For one pixel in each window, an LBP feature value is calculated using an operator LBP (representing a radius 1, a ring containing 8 neighborhoods, a uniform mode). According to the LBP eigenvalue calculated in the window, the histogram of each window is calculated, that is, the number of occurrences of each LBP eigenvalue, and then L2-norm is used for L2-normalization. The statistical histograms of all windows in the tandem image, the dimensions of the resulting LBP eigenvectors.
Sample CANNY head contour edge detection: Advanced the Gauss filter, its purpose is to the original image smoothing processing to remove or reduce the image noise. Then, the first order partial derivative of finite difference to calculate the gradient magnitude and direction of the expansion, the calculation of four directions, effectively improve the canny edge detection accuracy. Then, non-maxima suppression through inhibition of gradient direction on all non-roof peak gradient magnitude to refine the gradient magnitude. Finally, non-maxima suppression processing after the gradient amplitude array threshold value of the high and low threshold edge points, reduce the false edge segments Number, get sample head contour image.
Finally, the sample HOG feature vector and the LBP feature vector are connected in series to form a joint feature vector. Add CANNY edge detection to extract the outline of the head. We use the SVM classifier to transform the linear indivisible, low-dimensional space into a linearly separable, high-low-dimensional space by using a kernel function. The cross-validation method is used to select the optimal SVM parameters so that the classifier pairs the input training samples. The highest classification accuracy. The experimental test image size is 384*288. The algorithm is modified based on Matlab 2017a and runs on an Inter Core i5-5250 (1.60 GHz), 4 GB RAM computer. The experimental results are shown in Table 1:
Table 1. Algorithm performances shown by 4 experiments.
The second part of the experiment: we will process the image of the crowd and divide it into small pieces. For example, a set of 256*256 pixel pictures, each of which is defined by a size of 1*1 pixel, 2*2 pixels, 4*4 pixels, and 8*8 pixels. Through the feature fusion of HOG-LBP, CANNY is used to extract the edge of the head contour, and combined with the SVM classifier, the population density is estimated and counted for each small block image. The training set contains 500 head facial images that were
manually cut from the INRIA sample set. The experimental test image size is 595*350, and the experimental results are as figure 7:
Figure 7. This figure shows four arbitrary images from the dataset used in this paper
We have tried many times and got the results. In the table, number of people detected, number of people actually present in the scene, the difference between the detected number of people and actual number of people and time. Based on the above results, precision calculated is: 92.30%.
Table 2. Result summary.
5.
Conclusion
In this paper, we propose a feature fusion method for crowd counting. By image feature extraction and texture feature analysis methods, data obtained from multiple sources are used to count the crowd. Therefore, we use multiple sources of information, namely, HOG, LBP and CANNY. These sources provide separate estimates and other combinations of statistical measurements. Using the support vector machine (SVM) classification technique, and regression analysis, we count the crowd with high density. The approach adopted is easy and fast in processing. Our experiments showed the method gives good results in crowded scenes.
6.
Future work
In order to improve the detection efficiency and apply it to the crowd testing in the real world, we plan to use the FPGA cards which is famous for its performance in real-time crowd image processing.
7.
REFERENCES
[1] M. Li, and Z. Zhang, "Estimating the number of people in crowded scenes by MID based foreground segmentation and head-shoulder detection", 19th International Conference on Pattern Recognition, pp. 1-4, Tampa, FL, 2008.
[2] T. Le and C. Huynh, "Human-Crowd Density Estimation Based on Gabor Filter and Cell Division," 2015 International Conference on Advanced Computing and Applications (ACOMP), Ho Chi Minh City, 2015, pp. 157-161
[3] D. Kim, Y. Lee, B. Ku and H. Ko, "Crowd Density Estimation Using Multi-class Adaboost," 2012 IEEE Ninth International Conference on Advanced Video and Signal-Based Surveillance, Beijing, 2012, pp. 447-451.
[4] A. N. Marana, S. A. Velastin, L. F. Costa and R. A. Lotufo, "Estimation of crowd density using image processing," IEE Colloquium on Image Processing for Security Applications (Digest No: 1997/074), London, UK, 1997, pp. 11/1-11/8. [5] H. Idrees, I. Saleemi, C. Seibert and M. Shah, "Multi-source
Multi-scale Counting in Extremely Dense Crowd Images," 2013 IEEE Conference on Computer Vision and Pattern Recognition, Portland, OR, 2013, pp. 2547-2554.
[6] L.Wang and N. H. C. Yung, "Bayesian 3D model based human detection in crowded scenes using efficient optimization," 2011 IEEE Workshop on Applications of Computer Vision (WACV), Kona, HI, 2011, pp. 557-563. [7] Krishna A.N et al.,"A People Counting Method Based on
Head Detection and Tracking," 2016 International Journal of Innovative Research in Computer and Communication Engineering,2016,2320-9801.
[8] H. Yang and H. Zhao, "A novel method for crowd density estimations," IET International Conference on Information Science and Control Engineering 2012 (ICISCE 2012), Shenzhen, 2012, pp. 1-4.
[9] Z. Ma and A. B. Chan, "Crossing the Line: Crowd Counting by Integer Programming with Local Features," 2013 IEEE Conference on Computer Vision and Pattern Recognition, Portland, OR, 2013, pp. 2539-2546.
[10] M.Butenuth et al., "Integrating pedestrian simulation, tracking and event detection for crowd analysis," 2011 IEEE International Conference on Computer Vision Workshops (ICCV Workshops), Barcelona, 2011, pp. 150-157.
[11] L.Yuan and X. Xu, "Adaptive Image Edge Detection Algorithm Based on Canny Operator," 2015 4th International Conference on Advanced Information Technology and Sensor Application (AITS), Harbin, 2015, pp. 28-31. [12] V. B. Subburaman, A. Descamps and C. Carincotte,
"Counting People in the Crowd Using a Generic Head
Detector," 2012 IEEE Ninth International Conference on Advanced Video and Signal-Based Surveillance, Beijing, 2012, pp. 470-475.
[13] D. Conte, P. Foggia, G. Percannella and M. Vento, "A Method Based on the Indirect Approach for Counting People in Crowded Scenes," 2010 7th IEEE International Conference on Advanced Video and Signal Based Surveillance, Boston, MA, 2010, pp. 111-118.
[14] Yaocong Hu,Huan Chang,Fudong Nian,YanWang,Teng Li,"Dense crowd counting from still images with convolutional neural networks,"2016 Journal of Visual Communication and Image Representation,2016,Pages 530-539.
[15] Cong Zhang, Hongsheng Li, X.Wang and Xiaokang Yang, "Cross-scene crowd counting via deep convolutional neural networks," 2015 IEEE Conference on Computer Vision and Pattern Recognition (CVPR), Boston, MA, 2015, pp. 833-841.
[16] M. Li, Z. Zhang, K. Huang and T. Tan, "Estimating the number of people in crowded scenes by MID based foreground segmentation and head-shoulder detection," 2008 19th International Conference on Pattern Recognition, Tampa, FL, 2008, pp. 1-4.
[17] M. Rodriguez, I. Laptev, J. Sivic and J. Audibert, "Density-aware person detection and tracking in crowds," 2011 International Conference on Computer Vision, Barcelona, 2011, pp.2423-2430.
[18] Y. Hou and G. K. H. Pang, "Human detection in crowded scenes," 2010 IEEE International Conference on Image Processing, Hong Kong, 2010, pp. 721-724.
[19] H. Fradi and J. Dugelay, "Low level crowd analysis using frame-wise normalized feature for people counting," 2012 IEEE International Workshop on Information Forensics and Security (WIFS), Tenerife, 2012, pp. 246-251.