Abstract— Due to the subjectivity involved currently in pulmonary auscultation process and its diagnostic to evaluate the condition of respiratory airways, this work pretends to evaluate the performance of cluster-ing algorithms such as k-means and DBSCAN to per-form a computational analysis of lung sounds aiming to visualize a representation of such sounds that high-lights the presence of crackles and the energy associ-ated with them. In order to achieve that goal, Wavelet analysis techniques were used in contrast to tradition-al frequency antradition-alysis given the similarity between the typical waveform for a crackle and the wavelet sym4. Once the lung sound signal with isolated crackles is obtained, the clustering process groups crackles in re-gions of high density and provides visualization that might be useful for the diagnostic made by an expert. Evaluation suggests that k-means groups crackle more effective than DBSCAN in terms of generated clusters.
Keywords--- Lung Sounds, Crackles, Vesicular Sounds, Adventitious Sounds, Transformed Wavelet, Decomposition Wavelet, Symlet, Clustering, k-means, DBSCAN, Log-energy.
Resumen— Debido a la subjetividad que involucra actu-almente el proceso de auscultación pulmonar y su diag-nóstico para evaluar la condición de las vías respiratorias de un paciente, este trabajo busca evaluar el desempeño de los algoritmos de clustering: k-means y DBSCAN para efectuar un análisis computacional de sonidos pul-monares con el objetivo de visualizar una representación de dichos sonidos que exalte la presencia de estertores
y la energía contenida en ellos. Para este fin, se em -plearon técnicas de descomposición y análisis Wavelet a diferencia del tradicional análisis en frecuencia dada la similitud entre la forma de onda de un estertor típico y la wavelet sym4. Obtenida la señal de sonido pulmonar con estertores aislados, el proceso de clustering agrupa estertores en regiones de alta presencia y ofrece una vi-sualización que puede ser de utilidad para el diagnóstico hecho por un experto. La evaluación hecha sugiere que k-means agrupa conjuntos de estertores de forma más efectiva que DBSCAN en términos de clusters generados. Palabras Clave— Sonido Pulmonar, Estertores, Soni-dos Vesiculares, SoniSoni-dos Adventicios, Transformada Wavelet, Descomposición Wavelet, symlet, Clustering, k-means, DBSCAN, log-ennergy
Application of Clustering Techniques for
Lung Sounds to Improve Interpretability
and Detection of Crackles
*Aplicación de Técnicas de Clustering
en Sonidos Adventicios para Mejorar la
Interpretabilidad y Detección de Estertores
DOI:http://dx.doi.org/10.17981/ingecuc.11.1.2015.05
Research Article - Reception Date: August 19, 2014 - Acceptance Date: March 13, 2015
Germán D. Sosa
Electronic Engineer, Universidad de los Llanos. Villavicencio (Colombia). [email protected]
Fabián Velásquez Clavijo
Master of Applied Mathematics, Universidad de los Llanos. Villavicencio (Colombia). [email protected] To cite this paper:
G. D. Sosa & F. Velásquez Clavijo, “Application of Clustering Techniques for Lung Sounds to Improve Interpretability and Detection of Crackles,” INGE CUC, vol. 11, no. 1, pp. 53-62, 2015. DOI: http://dx.doi.org/10.17981/ingecuc.11.1.2015.05
* Research paper deriving from the research Project “Identificación de sonidos pulmonares mediante uso de fonendoscpio electrónico y procesamiento digital de señales de audio basado en transformada Wavelet”. Funded by Universidad de los Llanos y Colciencias. Starting date: Juny 2013. Ending date: July 2014.
I. IntroductIon
Every year around 4 million people die due to lung disease; diseases that affect more than 30 million people around the world, according to studies carried out in 2010 and 2011 (1). These studies and some others relate the growing num-ber of patients with lung cases to increasingly polluted environments and to social factors such as obesity and the smoking habit.
Given the recurrence of lung disease, the method of auscultation is widely popular due to the rapid diagnosis that provide the ease of the procedure and the stethoscope portability which is an instrument used by the examiner to hear lung sounds, whose identification and characte-rization is crucial to associate a specific patho-logy. However, despite the relevance of ausculta-tion to determine the condiausculta-tion of the respiratory system, this procedure has not technologically evolved markedly in recent decades, leaving the nature of the diagnosis entirely on the skills and expertise of the examiner and involving much subjectivity.
A departure point will be the basic classifica-tion of lung sounds associated with an abnormal condition known as adventitious sounds (rhon-chus, wheezing and crackles). Crackles are par-ticularly common presenting a series of acoustic characteristics that make it difficult to detect, such as its low tone that ranges from 100-200 Hz [2] and a very short time duration ranging between 30-40 ms [3] [4] which permits to des-cribe them according to Laennec, inventor of the stethoscope, as discontinuous sounds of explosi-ve nature and superimposed on the normal lung or vesicular sounds.
Crackles, depending on their frequency within a respiratory cycle, are divided into coarse crac-kles (CC) and fine craccrac-kles (FC), and usually they are due to the presence of secretions or obstructions in the airway. Classifying them as thick (coarse) and thin (fine) provides informa-tion about the type and severity of obstrucinforma-tion.
With the use of (more popular today than a few years ago) electronic stethoscopes, it is pos-sible to digitally reveal and capture lung sounds in order to apply some sort of signal processing to help the examiner to facilitate the diagnosis of auscultation. Since then, one of the most fre-quent approaches in computational analysis of lung sound has been crackling parametrization that allows finding crackles accurately within
a lung sound signal and evaluating their pro-perties, information that can be a support for a diagnosis.
For this purpose, the analysis of data based on Machine Learning has been applied to the analysis of lung sound in order to automatically detect one or more types of sound [5], [6]. To this end, the typical procedure in machine learning involves, on the one hand, a signal preprocessing that emphasizes the defining characteristics for its classification and, on the other hand, a lear-ning phase to develop a discriminative model that identifies each of the concerning sounds.
In the preprocessing stage, because of its short duration, the classical analysis in frequency, normally carried out by the Fourier Transform, is insufficient to capture relevant information about crackling. Moreover, wavelet analysis, thanks to its inherent local analysis of the sig-nal, allows the performance of this task with more reliably than many procedures for signal analysis, as shown in [7], [8], and [9].
As for learning algorithms, this paper pro-poses an unsupervised learning to detect crac-kles. Thus forcing the model to detect by itself what portions of sound is observed as abnormal, without the need to compare against the ver-dict of an examiner. In this way, the robustness of the algorithm does not lie in the amount of crackling sounds noted by an examiner, but the ability of the wavelet to represent crackles sa-tisfactorily.
With the hypothesis that an unsupervised learning provides better detection of crackling given the properties of the wavelet, this article evaluates the performance of the most popular clustering methods (k-means and DBSCAN) within this context and, in turn, it aims at de-termining whether they can become a diagnostic tool for the medical community support.
II. Methods
A. Wavelet Analysis
Wavelet analysis, developed by Haar in the early twentieth century and continued by Gabor in 1946 [10], allows multi-resolution analysis of the signal similar to that of the Fourier transform. However, instead of representing the signal in scaled versions of sinusoids, it does so by scaling a signal of short wave called wavelet denoted with the letter Ψ, as shown in (1).
Where a and b denote the scaling and movement of the wavelet Ψ (t) and the values contained in WT (x (t)) can reconstruct the signal in time f (t).
1) Discrete Wavelet Transform (DWT): In 1988,
Mallat [10] developed a new scheme for the wave-let transform, which obtains a subset in powers of 2 (dyadic) of the coefficients of the traditional trans -form but through digital filters.
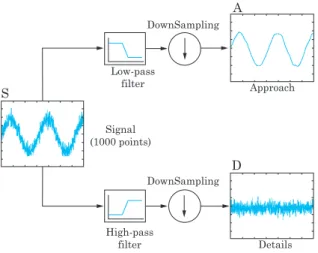
This new scheme, allowed a signal to be divided into 2 new samples resulting from a low-pass and a high-pass filter respectively, which are complemen -tary and, when added together, resulted in the ori-ginal signal.
The product signal from the low-pass filter is called approach (A), because it contains the coeffi -cients that contribute most to the waveform of the original signal. Moreover, the result of the high pass filter is called details (D) and it contains the remai-ning coefficients which is information from A that is not contained in the original signal (Fig . 1).
Signal (1000 points) Approach Low-pass filter Details High-pass filter DownSampling DownSampling D A S
Fig. 1. WDT decomposition stage. Source : Authors
This decomposition can be performed in cascade, thereby obtaining a decomposition tree that meets at each stage various levels of approximation and
details that together include all information of the
original signal (Fig . 2) .
A3 D3 A2 D2 A1 S D1
Fig. 2. Three level wavelet decomposition tree. Source : Authors.
B. Clustering
In the context of machine learning, clustering is one of the approaches of unsupervised learning that aims at grouping subsets called clusters from a dataset, so that the elements belonging to each cluster are the most similar to each other compa-red to those of other cluster [11].
The concept of clustering in itself is not an al-gorithm, but the partition task of a dataset into a number of clusters. When mapping the dataset in a vector space of dimension n, where n defines the number of characteristics of the dataset, the clus-tering process groups the points corresponding to each data in a number of clusters, where each of these groups together data that are “close “ within that vector space given some metric, being Eucli-dean the most common, as shown in (2).
|| AB || = √
‹
A,B›
(2)Currently there are a variety of clustering al-gorithms that are widely used. However, given the typical properties of a lung sound signal, not all of them offer an efficient performance. Such cha -racteristics require an algorithm that is scalable in the order of several thousand points presenting a vector with recorded audio quality (higher sam-pling frequency to 10 KHz), likewise, the num-ber of clusters, corresponding to found crackling groups can vary from a few or dozens. Therefore, given the recommendations of machine learning module scikit-learn [11], this work implements those clustering algorithms that have greater sca-lability, once provided the amount of points and clusters, which are k-means and DBSCAN.
1. k-means: The k-means algorithm groups data
into clusters seeking to separate dataset in k
groups presenting the same variance of the data assigned to each cluster in connection to the center of mass of the same, called centroid [12]. Therefore, the algorithm finds k centroi-ds so as to minimize the expression (3).
J(X,C) =
Σ
kj
= 0 min || xj _ μj ||2
μi C
con j = 1, 2 , 3 … number of samples (3)
2. DBSCAN: A different way to approach the
task of grouping data into clusters is perfor-med by DBSCAN. This algorithm sees clus-ters as high density areas separated by areas of low density [11]. Under this procedure so generic, DBSCAN clusters may have any sha-pe, rather than regular clusters of k-means, which for example, using an L2 norm tend to
Fig. 3. k-means applied to a 2D dataset.
Source: http://scikit-learn.org/stable/modules/clustering.html [11] More formally, the DBSCAN algorithm is cente-red on the concept of core-samples, which are sam-ples in high-density regions of the dataset that are close to each other under any metric. Likewise, there are the non-core-samples, which oppositely, are sam-ples in low-density regions that are close to a core-sample but are not core-core-samples themselves.
Given these concepts, DBSCAN define a cluster by means of two parameters, a distance d and a mi-nimum of m samples. Having m samples of the da-taset, that all meet the fact of being separated from one another by a distance less than or equal to d;
this subset of samples, will define a cluster.
Regarding k-means, DBSCAN has the advantage that the number of clusters is not defined by the user and that not all elements of the dataset are assigned to a cluster and can be discarded and considered due to being located in areas of low density. However, a potential drawback is that it is very sensitive to variations of the parameters d and m. When trying the wrong parameters, the algorithm can define too many or too few clusters for the given dataset.
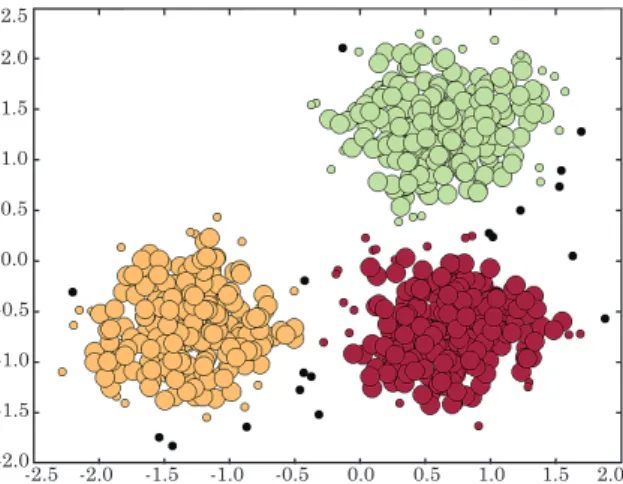
Fig. 4 shows an example of DBSCAN on a 2D da-taset, the black points are those considered in areas of low density. 2.5 2.0 2.0 1.5 1.5 1.0 1.0 0.5 0.5 0.0 0.0 -0.5 -0.5 -1.0 -1.0 -1.5 -1.5 -2.0-2.5 -2.0
Fig. 4. DBSCAN applied to 2D dataset. In this example, three clusters are demarcated based on a defined m and d. Source: http://scikit-learn.org/stable/modules/clustering.html [11]
C. Databases
Lung sounds, on which the performance of the pro-cedures described in Section IV was evaluated, co-rrespond to 20 audio samples from RALE Repository [13], which corresponds to lung sounds with presence of coarse or fine crackles.
Each sound has a sampling frequency Fs = 10240 Hz. In addition, each sample was converted to WAV format with 16-bit PCM modulation to a single chan-nel using the Audacity [14] software and cropped so that it keeps the corresponding sound of a respira-tory cycle.
III. desIgn
A. Removing Crackles by Wavelet Transform
Former works for separating vesicular sounds from crackling sounds by wavelet transform were done in [7] and [8]. A similar procedure was conducted for the above, as shown below:
A three level wavelet decomposition tree was imple-mented in MATLAB R2011b language, using Symlet wavelet family, more specifically, the wavelet sym4.
This wavelet was chosen because of its similarity in waveform with a typical crackle, as shown in Fig. 5.
1) Reconstruction of signal and thresholding: once
decomposition is performed on the signal, it is neces-sary to rebuild so that only relevant information is retrieved.
Sound
Ψ(x)
Fig. 5. Typical crackle waveform (right); Wavelet sym4 (left). Source: “Elimination of vesicular sounds from pulmonary crackle waveforms” Computer methods
and programs in biomedicine (2008) [3].
Taking a similar scheme to that of Fig. 2, each new stage of decomposition comes from breaking down each approach to the three levels established.
Provided the assumption that the crackles behave
as details on the decomposition, each level extracts
different types of crackles, from the least scaled in time (D1) to the shortest duration (D3).
A threshold stage is used for eliminating coeffi -cients in each level which are very small in relation to those extreme values of the signal. These atypical extreme values are those which occur due to the ap-pearance of a crackle [8]. Values located within the range of quartiles Q1 and Q3 are eliminated using the median as the estimator.
Once these new coefficients are obtained for de -tails, the signal is reconstructed inversely to the decomposition process, although for this procedure, the last level of approximation is not used (see Fig. 6); the results are as shown in Fig. 7.
TRESHOLDING TRESHOLDING TRESHOLDING 0 D3´ D3 A3 A2 D2 A1 D1 S A2´ D2´ A1´ S´ D1´
Fig. 6. Scheme of decomposition, threshold and reconstruction. D1, D2 and D3 containing the high
frequency coefficients of the signal S. A threshold is implemented in each one for obtaining D1 ‘, D2’ and D3 ‘. The new signal S’ is reconstructed from
these new details regardless A1, A2 or A3. Source: Authors
B. Clustering over Extracted Crackles
Samples of lung sound signals converted into time, where crackles can be highlighted using wavelet transform over the rest of the sound, can be of great help to the interpretability in auscultation.
However, to effectively group subsets found crac-kles and see what energy they contain within the sig-nal is a task that can hardly be made by an examiner and, if he had this information at hand, this would further support the diagnosis of the patient. There-fore, clustering algorithms are arranged in a form suitable for this procedure, and using the results ob-tained, it is possible to make a visual representation of these for interpretation.
Due to the nature of audio signals, consisting of a 1D vector of tens of thousands of samples, as a typical audio signal, not all clustering algorithm scales well for the task to do. For this work, k-means and DBS-CAN were chosen because they scale well for large volumes of data, provided they do not have too many dimensions and, in the case of k-means, the number of clusters is not high.
1 0+8 0+6 0+4 0+2 -0+2 -0+4 -0+6 0+5 1+5 2+5 333+++555 0 0 1 2 4 3 0+5 0+6 0+4 0+3 0+2 0+1 -0+1 -0+2 -0+3 0+5 1+5 2+5 333+++555 0 0 1 2 4 3 1 0+8 0+6 0+4 0+2 -0+2 -0+4 -0+6 -0+8 -1 2000 6000 10000 140001400014000 160001600016000 180001800018000 0 0 4000 8000 12000 2000 4000 6000 8000 10000 12000 14000 160001400014000 1600016000 180001800018000 0+6 0+4 0+2 -0+2 -0+4 -0+6 -0+8 0 0
Fig. 7. Signs of lung crackling sound (left); reconstructed signals from the details of wavelet decomposition tree (right). Source: Authors
The clustering procedure was implemented in Python 2.7.3 using IPython programming environ-ment. Additionally, clustering algorithms were pro-vided by the module scikit-learn v0.14 [11], designed to work in this language.
1) Preprocessing (crackling indexing). Time
sig-nal S ‘(see Fig 6) provided by the wavelet asig-nalysis is not useful for the clustering procedure as it does not directly represent in what instant of time a crac-kle appears. This signal corresponds to a series of values of the same length as the original signal S which emphasizes the presence of crackles and sets the rest to 0.
Information relevant to the process of clustering is the location of the crackling, so a new vector Spos is created from the crackling signal S’ that stores indexes S’ that are due to the presence of a crackle. That is, Spos indexes = | S ‘|> 0.
2) Clustering with k-means: once obtained the
vector with the location of each crackle, the k-means algorithm from scikit-learn module [11] is applied to the Spos vector.
The only relevant k-means parameter is the num-ber of clusters k. There are other user-adjustable parameters, like how to initialize the cluster or the number of iterations, but these are focused on mana-ging the computational cost.
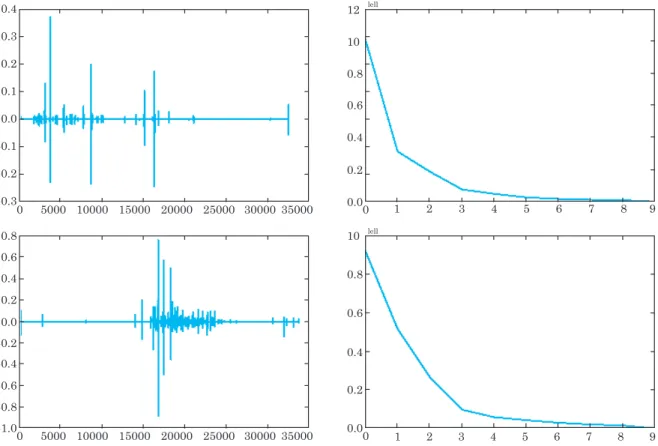
To set the number of clusters k, an elbow curve was used to determine optimal k manually. The elbow diagram shows the inertia of implementing k-means based on k. The inertia is expressed as shown in (4).
Inertia = Σk
j
= 1Σ = il 1 || xi _ μj ||2 to l samples (4)
Logically, each elbow curve is different for each sound. However, all comply with a similar pattern where the inertia goes down to almost 0 using over 10 kernels as shown in Fig. 8.
3) Clustering with DBSCAN: As in k-means,
DBSCAN is applied to the index crackling vector Spos to estimate the optimal value of its parame-ters.
DBSCAN requires the parameters d and m (see section II) to adjust the model on a dataset. In this case, d was fixed as = 1000, as it was assumed that separated crackles among themselves by a space of 100 ms or less are due to a high density area. Given the sampling frequency Fs = 10240 Hz, it means that 100 ms comply with a space of Fs * 0.1≈1000 points in the time series.
With fixed d, it is easier to determine the opti-mal value of m by a curve that plots the number of clusters found by DBSCAN depending on m.
0.4 0.3 0.2 0.1 0.0 0 5000 10000 15000 20000 25000 30000 35000 -0.1 -0.2 -0.3 0.4 0.6 0.8 0.2 0.0 0 5000 10000 15000 20000 25000 30000 35000 -0.6 -0.4 -0.2 -0.8 -1.0 0 0.8 10 lell lell 0.6 0 1 2 3 4 5 6 7 8 9 1 2 3 4 5 6 7 8 9 0.2 0.4 0.0 0.8 10 12 0.6 0.2 0.4 0.0
Fig. 8. elbow curves (right) for two signal samples with extracted crackling (left). The minimum inertia is achieved with k> 10. Source: Authors
0.4 0.3 -0.3 0.2 -0.2 0.1 -0.1 0.0 0 5000 10000 15000 20000 25000 30000 3500035000 0.4 0.6 0.8 -0.4 -0.6 -0.8 -1.0 0.2 -0.2 0.0 0 5000 10000 15000 20000 25000 30000 3500035000 2500 2000 1000 200 1500 1000 500 300 400 500 600 700 800 900 10001000 2500 3000 3500 4000 2000 1000 200 1500 1000 500 300 400 500 600 700 800 900 10001000
Fig. 9. Curves showing the number of clusters found by DBSCAN depending on the number of core-samples needed to define a cluster (right) corresponding to the signal samples with accented crackles of each curve (left).
Source: Authors It is important to note that when m>d, the
num-ber of clusters is 0. This case can only be present in this type of one-dimensional signals, because if the algorithm DBSCAN is asked to find more than m
samples in a space of k points in one dimension, it is logically impossible, and therefore the entire sample will be considered as non-core-samples.
Based on the results of Fig. 9, together with tho-se obtained from the other samples, it is difficult to determine a fixed value for m for the entire dataset, because when m exceeds a certain value, the num-ber of found clusters drops steeply until almost 0. However, in order to fix a value, m= 200 is establis-hed, which defines a consistent number of clusters, although very high compared to k-means.
IV. results
K-means and also DBSCAN were applied to a set of twenty pulmonary signals with crackling sounds. The information on each one of the found clusters was used to create a visual representation, as shown in Fig. 10, which draws every cluster in a time window equal in length to the original signal.
An important observation about these graphs is that unlike k-means where the clustering number
is not greater than 10, the abundant number of clusters estimated by DBSCAN generates a graph that does not differ much from that obtained if we equal any found value in the crackling signal S ‘to a unique value, for example, to 1.
Therefore, it was decided to establish k-means as k = 10 clusters for displaying crackles of a sam-ple of lung sound.
A. Measurement of Post-clustering Energy
To display the partitions obtained by clustering has the disadvantage that it does not take into account some information relating to the energy contained in the Spos crackling signal, as only their location is taken into account for the clustering process.
That’s why as a final addition to the visualiza -tion, the color of each partition process regarding the energy contained in each cluster of the measu-red signal on the portion between t1 and t2 corres-ponding to the signal S’ as in (5) is determined.
V. AcknowledgMents
D. Germán Sosa thanks for their support and funding to the Young Scholars Program No.
566/2012 of the Administrative Department of Science, Technology and Innovation COLCIEN-CIAS and Research Institute of the Colombian Orinoco IIOC of Universidad de los Llanos respec-tively.
VI. conclusIons
The proposal for a visual representationby making use of techniques of wavelet analysis and cluste-ring that facilitates the interpretation of how crac-kles affect lung sound is shown possible and with results that can support a medical diagnosis when linking found patterns in these visualizations with a specific pathology.
Of the various clustering algorithms currently used, there were chosen those known as scaling
0.4 0.3 0.2 0.1 0.0 0 0 0.0 0.2 -0.2 -0.4 -0.6 -0.8 -1.0 0.4 0.6 0.8 5000 10000 15000 20000 25000 30000 35000 5000 10000 15000 20000 25000 30000 35000 -0.1 -0.2 -0.3 0 50 100 150 200 250 300 80 60 40 20 0 0 50 100 150 200 250 300 80 60 40 20 0 0.4 0.6 0.8 1.0 0.2 0.00 5000 10000 15000 20000 25000 30000 35000 0.4 0.6 0.8 1.0 0.2 0.0 0 5000 10000 15000 20000 25000 30000 35000
Fig. 10. Display of clusters obtained by DBSCAN and k-means (2nd and 3rd row respectively).
Source: Authors Due to low amplitude of the Spos signal, the
ener-gy measured by the above equation results in very small values. Therefore, a slight change was made in a base 10 logarithmic scale for easy interpreta-tion as shown in (6).
(6)
Using the values of E0s for coloring each clus-ter, a new presentation is obtained, as shown in Fig. 11.
0.4 0.3 0.2 0.1 0.0 0 0 0.0 0.2 -0.2 -0.4 -0.6 -0.8 -1.0 0.4 0.6 0.8 5000 10000 15000 20000 25000 30000 35000 5000 10000 15000 20000 25000 30000 35000 -0.1 -0.2 -0.3 0 50 100 150 200 250 300 80 60 40 20 0 0 50 100 150 200 250 300 80 60 40 20 0 0 50 100 150 200 250 300 80 60 40 20 0 0 50 100 150 200 250 300 80 60 40 20 0 Low High
Fig. 11. Display of clusters obtained by k-means (2nd row) and color clusters according to the energy contained in S ‘(3rd row).
Source: Authors. well with large dataset and not many clusters
(k-means and DBSCAN), which complies with the nature of an audio signal and the aim sought in this work. However, due to the instability of the
m parameter for the DBSCAN algorithm and the huge amount of estimated clusters, DBSCAN was discarded leaving k-means with k = 10 clusters as partitioning method of the signal in representati-ve groups of crackling.
The graphs obtained after measuring the ener-gy in each partition facilitates the interpretation of how the presence of crackles affect a lung sound signal specifically. Even, due to the little infor -mation that is required to obtain this chart (lo-cation of the centroid, width of each cluster, and corresponding energy), it is possible that this re-presentation will work for a lung sound classifier
based on machine learning, however, this hypothesis should be tested in future work.
references
[1] W. H. Organization et al., “The top 10 causes of death: The 10 leading causes of death in the world, 2000 and 2011,” 2013.
[2] M. Munakata, H. Ukita, I. Doi, Y. Ohtsuka, Y. Masaki, Y. Homma, and Y. Kawakami, “Spectral and waveform cha-racteristics of fine and coarse crackles.” Thorax, vol. 46, no. 9, pp. 651–657, 1991. DOI:10.1136/thx.46.9.651 [3] M. Yeginer and Y. P. Kahya, “Elimination of vesicular
sounds from pulmonary crackle waveforms,” Computer methods and programs in biomedicine, vol. 89, no. 1, pp. 1–13, 2008. DOI:10.1016/j.cmpb.2007.10.002
[4] T. Kaisia, A. Sovijarvi, P. Piirila, H. Rajala, S. Haltsonen, and T. Rosqvist, “Validated method for automatic detec-tion of lung sound crackles,” Medical and Biological Engi-neering and Computing, vol. 29, no. 5, pp. 517–521, 1991. DOI:10.1007/BF02442324
[5] M. Yeginer and Y. P. Kahya, “Probing the existence of medium pulmonary crackles via model-based clustering,” Computers in biology and medicine, vol. 40, no. 9, pp. 765– 774, 2010. DOI:10.1016/j.compbiomed.2010.07.004 [6] M. Paoletti, G. Camiciottoli, E. Meoni, F. Bigazzi, L.
Ces-telli, M. Pistolesi, and C. Marchesi, “Explorative data analysis techniques and unsupervised clustering methods to support clinical assessment of chronic obstructive pulmonary disease (COPD) phenotypes,” Journal of bio-medical informatics, vol. 42, no. 6, pp. 1013–1021, 2009. DOI:10.1016/j.jbi.2009.05.008
[7] X. Lu and M. Bahoura, “An automatic system for crac-kles detection and classification,” in Electrical and Computer Engineering, 2006. CCECE’06. Canadian Conference. IEEE, 2006, pp. 725–729. DOI:10.1109/CCE-CE.2006.277698
[8] M. Bahoura and X. Lu, “Separation of crackles from vesicu-lar sounds using wavelet packet transform,” in Acoustics, Speech and Signal Processing, 2006. ICASSP 2006 Proce-edings. 2006 IEEE International Conference, vol. 2. IEEE, 2006, pp. II–II. DOI:10.1109/ICASSP.2006.1660533
[9] L. J. Hadjileontiadis and S. M. Panas, “Separation of discontinuous adventitious sounds from vesicular sounds using a wavelet-based filter,” Biomedical En-gineering, IEEE Transactions on, vol. 44, no. 12, pp. 1269–1281, 1997. DOI:10.1109/10.649999
[10] S. Mallat, A wavelet tour of signal processing. Acade-mic Press, 1999.
[11] F. Pedregosa et al., “Scikit-learn: Machine learning in Python,” J Mach Learn Res, vol. 12, pp. 2825– 2830, 2011.
[12] E. Alpaydin, Introduction to machine learning. MIT press, 2004.
[13] J. J. Ward, “Rale lung sounds 3.1 professional edi-tion,” Respiratory Care, vol. 50, no. 10, pp. 1385– 1388, 2005.
[14] D. Mazzoni, M. Brubeck, and J. Haberman, “Audaci-ty: Free audio editor and recorder”. [En línea] Dispo-nible en: http://audacity.sourceforge.net, 2005.