Multi-Stage Attack Detection Using Contextual Information
Francisco J. Aparicio-Navarro,
and Jonathon A. Chambers
School of Engineering,
Newcastle University,
Newcastle upon Tyne, NE1 7RU, UK
{francisco.aparicio-navarro, jonathon.chambers}@ncl.ac.ukKonstantinos G. Kyriakopoulos, Ibrahim Ghafir,
and Sangarapillai Lambotharan
Wolfson School of Engineering,
Loughborough University,
Loughborough, LE11 3TU, UK
{k.kyriakopoulos, i.ghafir, s.lambotharan}@lboro.ac.ukAbstract— The appearance of new forms of cyber-threats, such as Multi-Stage Attacks (MSAs), creates new challenges to which Intrusion Detection Systems (IDSs) need to adapt. An MSA is launched in multiple sequential stages, which may not be malicious when implemented individually, making the detection of MSAs extremely challenging for most current IDSs. In this paper, we present a novel IDS that exploits contextual information in the form of Pattern-of-Life (PoL), and information related to expert judgment on the network behaviour. This IDS focuses on detecting an MSA, in real-time, without previous training process. The main goal of the MSA is to create a Point of Entry (PoE) to a target machine, which could be used as part of an APT attack. Our results verify that the use of contextual information improves the efficiency of our IDS by enhancing the detection rate of MSAs in real-time by58%.
Keywords−Contextual Information, Dempster-Shafer The-ory, Fuzzy Cognitive Maps, Intrusion Detection System, Multi-Stage Attack, Network Security, Pattern-of-Life, Point of Entry
I. INTRODUCTION
Cyber-security has increasing importance to Internet users. The appearance of new forms of cyber-threats, such as Multi-Stage Attacks (MSAs), has created new challenges to which Intrusion Detection Systems (IDSs) need to adapt. To overcome these new challenges, novel and more intelligent detection approaches need to be proposed, and the detection process needs to exploit new sources of information.
An MSA differs from traditional one-off network attacks as it is launched in multiple stages and steps [1], and aims to maintain long-term access to the target machine. Each of the stages that composes an MSA comprises of different steps, which may not be malicious when implemented individually, but all are necessary for its successful completion. Only when executed sequentially, the attacker could succeed in the completion of the MSAs. Also, the time between separate attack stages can span hours, days or months, making the detection of MSAs extremely challenging for most current IDSs.
An Advanced Persistent Threat (APT) is a complex version of an MSA, and its main objective is data exfiltration and intelligence appropriation. This attack targets selected organisations and persists on the completion of the attack until it is achieved [2]. As part of the APT life cycle, an attacker creates a Point of Entry (PoE) to the target network. This is usually achieved by installing malware in the targeted machine to leave a back-door open for future access. A common technique employed to breach into the network, which involves the use of social engineering, is by the use of a phishing email containing both links to malicious websites, and malicious attachments [3]. Nonetheless, as will be shown here, there are other methods by which malware can be installed to create the PoE.
Current IDSs use measurable network traffic information from the protected system or signatures of known cyber-attacks during the intrusion detection process. However, these systems do not generally take into account available high-level information (i.e. above the network operation) regarding the protected system [4]. The next generation of IDSs should incorporate contextual infor-mation, situational awareness and cognitive inforinfor-mation, pertaining to the judgment of experts on the network behaviour within the intrusion detection process. IDSs should be able to adapt their detection characteristics based not only on the measureable network traffic information, but also on the context in which these systems operate, and the information provided by the network users or administrators.
In this paper, we present a novel unsupervised anomaly-based IDS designed to detect MSAs, which exploits contextual informa-tion in the form of a Pattern-of-Life (PoL) model, and informainforma-tion related to expert judgment on the network behaviour. In particular, this IDS focuses on detecting a 5-steps MSA, in real-time, without previous training process. The main goal of this MSA is to create a PoE to a targeted machine, which could be used for the completion of an APT attack. As we previously demonstrated in [5], a Fuzzy Cognitive Map (FCM) [7] can be used to incorporate the PoL into the detection process, which would improve the detection results of the IDS. The FCM is used to fine-tune the techniques used by the IDS to assign evidence of attack. The experimental analysis demonstrates the efficient detection performance of the proposed IDS detecting an MSA when contextual information is considered. The rest of the paper is organised as follows. In Section II, the most relevant previous work is reviewed. The detection methodol-ogy used by our IDS is explained in Section III. In Section IV, the proposed approach for the use of an FCM within our IDS is described. The network testbed and the analysed network traffic dataset, as well as the implemented MSA are described in Sec-tion V. SecSec-tion VI describes the experiment results. Finally, con-clusions and suggestions for future work are given in Section VII.
II. RELATEDWORK
With the increasing complexity of cyber-attacks, the next gener-ation of IDSs needs to detect network attacks by using measurable data from the network, as well as available contextual information into the detection process. The authors of [6] survey current research on context-based information fusion systems, and highlight the importance gained by these systems in the last few years.
A technique that provides the capability of integrating contextual information to the detection process is the FCM. The authors of [7] provide a detailed description of the FCM and its mathematical foundation. The authors of [8] develop, using FCMs, an actionable model of situation awareness for army infantry platoon leaders that could replicate human cognition. Their FCM design structures the goals and subgoals of the platoon, and the relationships between these goals. The people responsible for designing this FCM model
do not provide weight values to the concepts, but rank the impor-tance of each modelled concept. A similar approach is presented in [9], in which situation awareness is represented using an FCM. In [10], the authors use an FCM to model causal knowledge within network data. Based on this knowledge, their system cal-culates the severity of the modelled network data to attacks. This approach allows the IDS to discard irrelevant events and focus only on important ones. However, in contrast to the approach that we propose, this research does not use an FCM to modify parameters in the detection process, but as an events filtering process prior to the actual detection.
Regarding predicting follow-up attack stages in MSAs, machine learning has been used for training datasets to identify associations between stages of attack and predicting the likelihood of a forth-coming individual stage [11]. Many works on MSAs have also used attack graphs on alert messages for network security assessment, attack countermeasure selection and mitigation deployment [12]. The attack graph technique has also been used in collaboration with alert correlation clustering to decrease the false positive alerts [13]. However, attack graph techniques do not scale effectively to repre-sent rich and complex scenarios and for this reason are impractical to use in real case environments.
The authors of [14] propose a flow-based IDS to detect brute force Secure Shell (SSH) attacks in real-time. This work considers a brute force SSH attack as a 3-phase MSA. The IDS uses the metrics packets-per-flow and minimum number of flow records to identify the different phases of the attack. The detection is based on a number of thresholds defined based on these metrics. In [15], a classification model based on machine learning techniques is presented. This model is evaluated using a malware employed to implement an APT. A number of features are extracted and used to train machine learning techniques. Despite been an efficient approach, this model is limited to the detection of the same malware used during the training process.
III. INTRUSIONDETECTIONMETHODOLOGY The detection methodology that we present builds upon the unsupervised anomaly-based IDS that we presented in [5]. It is based on the combined use of various metrics from multiple layers of the protocol stack to carry out the detection. Each metric provides different levels of evidence about the real nature of the network traffic. It uses the Dempster-Shafer (D-S) Theory [16] as the data fusion technique. The goal is to create an overall belief on whether the currently analysed network traffic is normal or malicious.
A. Dempster-Shafer Theory of Evidence
D-S is a data fusion technique that combines evidence of infor-mation from multiple and heterogeneous events in order to calculate the belief of occurrence of another event. Since we want to identify whether the analysed network traffic is normal or malicious, the frame of discernmentΘ(i.e. the finite set of all possible mutually exclusive outcomes) is comprised of two elements,N=Normaland
A=Attack. Hence, the hypotheses for this problem are defined as the power set{N,A,{N|A},/0},2Θ. The subset{N|A}corresponds
toU ncertainty(eitherNorA), and /0 is the empty set.
Each hypothesis is assigned a belief value within the range [0, 1], also known as a Basic Probability Assignment (BPA), through the mass probability function m. This belief value expresses the evidence attributed directly to the hypothesis. This is:
m : 2Θ → [0,1]i f m(/0) =0 m(H)≥0, ∀H⊆Θ
∑
H⊆Θ m(H) =1 (1)Then, Dempster’s rule of combination is used to calculate the orthogonal summation of the belief values from two different observers, and fuses this information into a single belief. This
rule is defined in (2), wherem1(H)and m2(H)are the beliefs in the hypothesisH, from observers 1 and 2, respectively. Similarly,
XT
Y=H refers to all combinations of evidence which yield H; whereasXT
Y= /0 refers to the mutually exclusive subsets of the hypothesisH, thus their intersection is the empty set.
m(H) = ∑X
TY=Hm1(X)·m2(Y)
1−∑XT
Y=/0m1(X)·m2(Y)
∀H6=/0 (2)
B. Automatic Basic Probability Assignment Methodology
Although D-S depends on the BPA, D-S theory does not dictate a specific methodology to derive the belief values. There exist multiple proposed methods to assign BPA values but few of them could be used without a prior thorough training or fine tuning period. In [17], we proposed a novel BPA methodology which is able to automatically adapt the belief assignment to the current characteristics of the network traffic, without intervention from an IDS administrator. This methodology uses three independent statistical approaches to provide the belief values for each of the hypothesis:
• The assignment of BPA values in the hypothesisNormaluses the distribution of the network traffic. The BPA in Normal,
m(N), indicates how strong the belief is that the current analysed data are non-malicious.
• The assignment of BPA values inAttack uses the Euclidean distance from a defined reference. The BPA inAttack,m(A), indicates how strong the belief is that the current analysed data are malicious.
• The BPA in the hypothesisU ncertaintyis assigned based on the valuesm(N)andm(A). The belief inU ncertainty,m(U), indicates how doubtful the system is regarding whether the current analysed data are malicious or normal.
Further description about the BPA methodology can be found in [17]. The BPA values generated by all the observers are then fused according to Dempster’s rule of combination (2). After the data fusion process, the network traffic is classified according to the hypothesis with the highest BPA, which is considered to be the correct decision.
IV. MODELLINGCONTEXTUALINFORMATION This work employs one of the three methodologies that we previously proposed in [5]. In particular, an FCM is integrated within an IDS to include the contextual information into the detection process. It is based on the adjustment of the BPA values assigned prior to the data fusion process, by using the outcome of the FCM. This is done by adding the outcome of the FCM tom(N)
and m(A). Then, m(U) is calculated using the newly computed values ofm(N)andm(A). The adjustment is applied to each of the considered metrics. It is worth noting that, because it is unlikely for the metrics to be assigned the same BPA value, the adjustments would impact each of the metrics differently.
A. Fuzzy Cognitive Map
An FCM is a technique used for prediction and decision making, which can be applied to represent the behaviour of a system as perceived by human experts. The main goal of modelling a decision problem using an FCM is to predict the outcome of the evaluated problem by letting the relevant events interact, and to calculate the degree of influence that one event may have upon the system.
The graphical design of an FCM is characterised by a set of nodes interconnected by causal links. The nodes represent time-varying concepts, events or actions that describe the behaviour of the system. Each nodeC carries a weightA(t)in the fuzzy range [0, 1], which indicates the importance that the concept has in the system, at time t. The links between nodes represent the causal relationship between concepts. Each link is assigned a weight value
wi j(t)in the fuzzy interval [-1, 1], which indicates the relationship and degree of influence from the nodesCi toCj. There are three
possible relationships between nodes: 1) wi j >0, indicating a positive relationship (i.e.Aj(t)increases asAi(t)also increases); 2) wi j<0, negative relationship (i.e. Aj(t) increases asAi(t)decreases, andAj(t)decreases asAi(t)increases); 3)wi j=0, no relationship. A description of the design of FCM models can be found in [7].
An FCM can be represented by an [m×m] adjacency matrix
M, where [M(t)]i j=|wi j(t)|, andmis the number of nodes in the
modelled FCM. The matrixM describes the relationship between the nodes and the weight valueswi j(t)associated with each link. The FCMs evolve via an iterative process in which, at each future time step, the weight value of each conceptA(t)is computed using an activation function f. The value ofAi(t)changes at each iteration as described in (3): Ai(t+1) =f(K) =f Ai(t) + m
∑
j=1j6=i wi j(t)·Aj(t) ! (3) whereAi(t+1)is the weight value of nodeCiat timet+1,Aj(t)is the weight value of nodeCj at timet, andwji(t)is the degree of influence of nodeCion nodeCj.
In this work, we have employed the hyperbolic tangent activation function, defined in (4). This function produces weight valuesAi(t)
normalised in the range [-1, 1]. The FCM process continues for a number of iterations until the activation function converges to a final fixed model (i.e. when the weight valuesA(t)in all the nodes do not change in successive iterations). In our experiments, the activation function always converges after a number of iterations.
f(K) =e
K−e−K
eK+e−K (4)
B. FCM Design Based on Contextual Information
In this work, we have made use of two main sources of contextual information. First, the PoL of the network usage generated by mon-itoring the behaviour of the network over a period of time. Second, information related to expert judgment on network behaviour during the different stages of the MSA implemented in our experiments.
In order to model the contextual information, four nodes have been defined. These represent the different steps that compose the implemented MSA: fping, nmap, OpenVAS, and Brute Force SSH. Also, two additional concepts have been defined as the two possible outcomes of the FCM (i.e.C5=NormalandC6=Attack).
The weights A(t) associated with these two concepts are used to incorporate the contextual information into the detection process of our IDS. The relationships between concepts have been designed by the network administrator, and the weight valueswi j(t)are assigned based on previous knowledge.
The FCM model used in our experiments is represented in Fig. 1. As can be seen, only four weightswi j have been included in the FCM model representation. The actual weights wi j used in our experiments have been tabulated in the [6×6] matrixM, as shown in Fig. 2. As an example, the weightw15=0.7, which represents
the level of influence of nodeC1onC5, corresponds with the (1,5)th
element of the adjacency matrix. In this example, since fping can be benign, a high weight value is assigned tow15. Also, since fping
may also be part of an MSA, a very low weight value is assigned to the conceptAttack(i.e.w16=0.1). Similarly, a low weight value
is assigned tow12 because fping can be followed by nmap as part
of an MSA, although it may not be always the case.
It is assumed that the network usage would show unexpected measurable changes from the normal behaviour of the network during the implementation of the different steps of the MSA, which could occur at any time of the day. These abnormal changes would manifest themselves differently in each analysed metric. Based on this assumption, we have defined a number of thresholds for the detection system to infer which of the MSA steps is being measured. In particular, these thresholds correspond with the metric value expected at a given time and day, based on the PoL of the network.
C1 fping C2 nmap C3 OpenVAS C4 Brute Force SSH C5 Normal C6 Attack w12=0.3 w15=0.7 w23=0.3 w45=0.3
Fig. 1. FCM model of the MSA attack used in the presented experiments, in which nodes represent steps of the MSA and connections denote the relationships between concepts.
M= C1 C2 C3 C4 C5 C6 C1 0 0.3 0 0 0.7 0.1 C2 0 0 0.3 0.3 0.5 0.5 C3 0 0 0 0.3 0.3 0.7 C4 0 0 0 0 0.3 0.9 C5 0 0 0 0 0 −0.1 C6 0 0 0 0 −0.3 0
Fig. 2. [6×6] adjacency matrix including the weight valueswi j used in
our experiments. It maps the FCM model shown in Fig. 1.
We have also provided an approach to address the challenge created by the temporal relation between the different steps of the MSA. We have defined a fixed time frame, within which the weight value ofAi(t)remains active after the attack inCi,i=[1,4]has been
detected. Since the MSA design for this work runs lasted for 7 minutes, we have empirically set the time frame to 2 minutes. As an example, consider the situation in which the IDS detectsC2=nmap,
the initial vector state would beA(0) = [0, 1, 0, 0, 0, 0]. If the IDS detects C3=OpenVAS within the following 2 minutes, the
initial vector state would beA(0) = [0, 1, 1, 0, 0, 0]. However, if the IDS detectsC3=OpenVAS once the predefined 2 minutes
time frame has expired, the initial vector state would then be
A(0) = [0, 0, 1,0, 0, 0]. This approach would bring the temporal relation between the different MSA steps into the initial vector state employed in (3).
V. TESTBED ANDNETWORKTRAFFICMEASUREMENTS
A. Testbed LAN
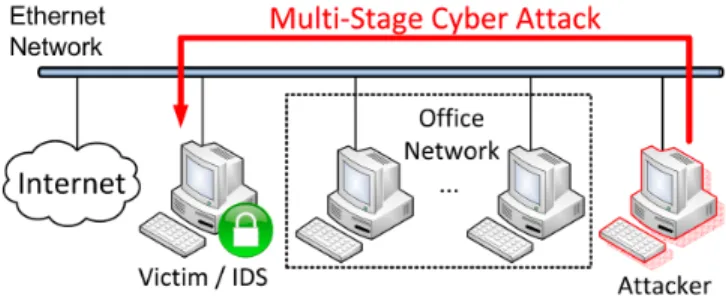
The live operational IDS that we present has been evaluated in an Ethernet Local Area Network (LAN) testbed presented in Fig. 3. This testbed LAN includes an attacker PC running Kali Linux, and a victim PC running our IDS. The attacker initiates an MSA against the victim PC. Additionally, the testbed LAN comprises a portion of the University’s network. This is represented by the office network within the dashed box. The PCs in the office network are used by 15 researchers daily for Internet access. One Cisco switch was used to aggregate the traffic from these PCs using a SPAN port. The real network traffic generated by the PCs in the office network is used as realistic background traffic needed to construct the PoL.
B. Evaluated Multi-Stage Attack
The attacker implements an MSA against the victim. All the tools used to implement the MSA can be found as part of the Penetration
Fig. 3. Logical topology of the testbed LAN; PC on the right initiates an MSA against the victim PC in the left. The PCs in the Office Network generate background traffic used to construct the PoL.
Testing Linux distribution Kali Linux [19]. A bash script was used to automate and to reduce the delay of implementing the different MSA steps. The attack lasted for 7 minutes approximately, and the different steps were launched at aleatory times.
The implementation of the MSA is composed of five steps: 1) Scanning for active machines in the network, using fping 2) Scanning for open network ports, using nmap
3) Scanning for vulnerabilities, using OpenVAS 4) Dictionary brute force SSH and
5) Drop malicious payload, both using Metasploit
Fig. 4 represents the different stages and steps that compose the MSA. Although the steps that comprise the MSA have been specifically designed for this work, the order at which the different stages are implemented follows the Zero Entry Hacking (ZEH) methodology described in [1].
Initially, we assume that a passive reconnaissance stage has been conducted in which the attacker obtains the username and the network IP address where the targeted machine is connected. Since the reconnaissance is implemented passively and does not actively interact with the targeted victim, this step has been excluded from the MSA detection process.
The first step in the scanning stage uses fping to obtain a list of IP addresses for all the live machines in the network. This step provides the attacker with the information required to identify the specific IP address of the target. The next step is implemented using the network mapper nmap [20]. This is a popular open source tool that provides a variety of probing techniques for network exploitation and security auditing. This step would provide the attacker with a list of open ports in the target machine. The last step during the scanning stage aims to identify possible vulnerabilities. The vulnerability scan is implemented using OpenVAS [21], a soft-ware framework that offers vulnerability scanning and vulnerability management capabilities.
During the exploitation stage, the attacker exploits the informa-tion obtained during the scanning stage. In particular, the fourth step attempts to guess the login credentials of the target victim using a dictionary brute force. The attacker uses a list of frequently used passwords to establish an SSH connection to the target. Finally, the attacker uses the connection established with the target to install a malware payload that will leave a back-door open in the victim machine. In other words, it will create a PoE to the target. The penetration testing framework Metasploit [22] has been used to implement the last two steps.
C. Network Traffic Measurements
The victim PC, which runs the IDS, gathers the network traffic in pcap format using the network packets analyser Tcpdump [23]. Next, the pcap file is processed using tshark [24] to filter the relevant set of metrics employed during the MSA detection process. It is worth noting that the network traffic from the office network, used as background traffic, was collected beforehand and retransmitted
Fig. 4. Diagram comprising the different stages and steps that compose the 5-steps MSA employed in this work.
using tcpreplay [25]. A detailed description of the office network can be found in [5].
Five different metrics have been extracted from the dataset, which are used to carry out the intrusion detection analysis. These metrics are Communication Rate (COM), i.e. the number of frames transmitted per second; Destination Port Distribution (DPD), i.e. the number of unique destination ports that receive traffic per second; Throughput (THR), i.e. the number of transmitted bytes per second; Address Resolution Protocol (ARP), i.e. the number of ARP frames transmitted per second; and SSH Request (SHR), i.e. the number of SSH requests transmitted per second.
Due to the amount of data and the speed at which network traffic is generated, analysing the information in a per frame basis would be highly computationally demanding. Hence, we decided to aggregate all the information per second, reducing therefore the computational complexity of the detection process. The aggregation of network traffic is conducted per metric. Then, the aggregated metrics are analysed by the proposed IDS, including the contribu-tion of the contextual informacontribu-tion.
VI. RESULTS ANDANALYSIS
This section describes the detection results of the presented IDS in an online and live mode, and compares the results generated with and without the use of an FCM. The dataset has been analysed combining the metrics described in Section V-C. The main purpose of the results is to evidence that the use of contextual information improves the detection capabilities of the IDS.
The efficiency of the IDS has been evaluated using the following performance metrics, which provide evidence of how effective the IDSs are at making correct detections:
• Detection Rate (DR) - Proportion of malicious correctly classified as anomalous among all the malicious data:
DR=T P/(T P+FN)
• False Positive Rate (FPr) - Proportion of normal data misclas-sified as malicious among all the normal data:
FPr=FP/(T N+FP)
• Overall Success Rate (OSR) - Proportion of frames correctly classified among all the data:
OSR= (T P+T N)/(T P+FP+T N+FN)
where True Positive (TP) represents anomalies classified as mali-cious; True Negative (TN) represents normal instances classified as normal; False Positive (FP) represents normal instances mis-classified as attack; and False Negative (FN) represents anomalies misclassified as normal.
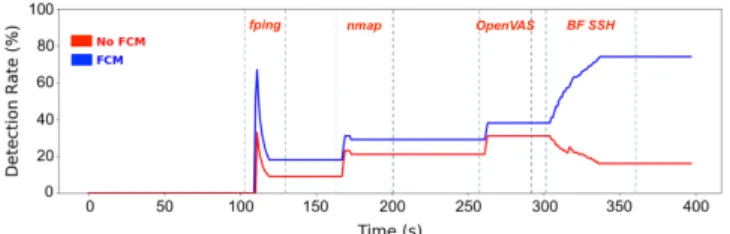
The comparison evaluation of the experimental results with and without the use of an FCM are presented in Figs. 5-7. The Y-axis of the figures represents the results in percentage, while the X-axis of the graphs represents time in seconds. The graphs in blue and red correspond to the results with and without the use of contextual information, respectively. All the figures include extra annotations to help identify the different steps of the MSA.
Fig. 5. Detection Rate results comparison between the methodologies: IDS with and without FCM.
Regarding the DR, there is an evident improvement in the detection results when contextual information is included in the detection process. The graphs in Fig. 5 display a step change improvement, which relates to the different stages of the MSA that have been detected. When the contextual information is considered, the IDS is able to generate 74% of DR. The change improvement is consistent in both graphs. However, when the MSA reaches the step BF SSH, the IDS without an FCM starts misclassifying a large portion of malicious traffic (i.e. produces FN alarms). At the end of the MSA, the DR reaches 16% produced by the IDS without contextual information. Additionally, the detection results when FCM is considered are better for most of the experiments due to a more accurate detection of the initial step fping.
Fig. 6. False Positive Rate results comparison between two methodologies: IDS with and without FCM.
The FPr results of our IDS with and without the use of an FCM are compared in Fig. 6. We can see that the use of contextual information produces a relatively low number of false positive alarms, reaching 12% of FPr at the end of the MSA. This represents a 9% worsening in the FPr results in comparison with the IDS alone, which reaches 3% of FPr. Nonetheless, it is worth repeating that these results are generated by an unsupervised IDS detecting MSA, without any prior training process. Therefore, producing 12% of FPr at the end of the MSA can be considered as good results, considering the improvement provided in terms of DR.
Fig. 7. Overall Success Rate results comparison between two methodolo-gies: FCM in conjunction with IDS, and the IDS without FCM.
Fig. 7 presents the OSR comparison results. We can see that there is no evident difference between the two approaches. When the contextual information is considered as part of the detection process, 87% of OSR is reached at the end of the attack. On the other hand, the IDS without FCM produces only 2% of
improvement. The presented results evidence that the use of the FCM provides improvement to the effectiveness of the IDS, without greatly affecting the correct classification of normal network traffic. In addition to the previous results, Fig. 8 shows the actual progression of the belief inAttackgiven by the IDS as the different stages of the MSA are implemented. The Y-axis of the figure represents the belief value, while the X-axis of the graphs represents time in seconds. As we can see, the belief value increases when the different MSA steps are implemented and decreases when the attack has stopped. As we can see, Fig. 8 also includes extra annotations to help identify the different steps of the MSA.
Fig. 8. Progression of the Belief inAttack; As the different stages of the MSA are implemented, the level of belief in Attack computed by the Intrusion Detection System would increase. The figure includes extra annotations to help identify the different steps of the MSA.
VII. CONCLUSIONS
The appearance of new forms of cyber-threats, such as MSAs, creates new challenges to which IDSs need to adapt. To over-come these new challenges, novel and more intelligent detection approaches need to be proposed, and new sources of information need to be exploited during the detection process. In this paper we have presented a live operational IDS able to efficiently detect the presence of an MSA in real-time, without prior training process. This novel IDS exploits contextual information in the form of PoL model, and information related to expert judgment on the network behaviour by the use of an FCM in conjunction with our IDS.
From the presented results, we can see that the use of contextual information clearly improves the efficiency of our IDS detecting an MSA. In terms of DR, the proposed live operational detection system, including an FCM, has provided an improvement of 58% of DR when compared against the IDS without an FCM. Nonetheless, the number of FP alarms slightly increases when the contextual information is considered, reaching 12% of FPr. Despite this 9% increase in false alarms, the gain in terms of DR well justifies the use of an FCM, and does not affect the results in terms of OSR.
It is important to highlight that the design of an FCM is very context-specific, and may not be easily generalised. In our exper-iments, we have employed a 5-steps MSA specifically designed for this work. The design of the FCM has been adapted to this particular case. Therefore, in order for the model to be applied to other situations and to detect other MSAs, a new FCM design should be constructed. Additionally, the approach that we have implemented to address the temporal relation between MSA steps does not efficiently adapt to the implementation of other MSAs. The used time frame has been defined for this particular work. Hence, efficiently addressing this challenge remains an open issue.
As for our future work, we wish to research novel methods to characterise the contextual information in the FCM, and to propose methods to automatically adapt the detection to different MSAs.
ACKNOWLEDGMENT
This work was supported by the Engineering and Physical Sciences Research Council (EPSRC) Grant number EP/K014307/2 and the MOD University Defence Research Collaboration in Sig-nal Processing, and by the British Council UK-Gulf InstitutioSig-nal Link Grant and the EPSRC Grant numbers EP/R006385/1 and EP/R006377/1.
REFERENCES
[1] P. Engebretson,The basics of hacking and penetration testing: ethical hacking and penetration testing made easy, Elsevier, 2013. [2] I. Ghafir, and V. Prenosil, “Advanced persistent threat attack detection:
an overview,” in International Journal of Advances in Computer Networks and its Security (IJCNS), vol. 4, no. 4, 2014, pp. 50-54. [3] I. Ghafir, and V. Prenosil, “Advanced persistent threat and spear
phishing emails,” in Proc. of the International Conference Distance Learning, Simulation and Communication (DLSC), 2015, pp. 34-41. [4] A. Sadighian, S. T. Zargar, J. M. Fern´andez, and A. Lemay,
“Semantic-based context-aware alert fusion for distributed Intrusion Detection Systems,” in Proc. of the International Conference on Risks and Security of Internet and Systems (CRiSIS), 2013, pp. 1-6.
[5] F. J. Aparicio-Navarro, K. G. Kyriakopoulos, Y. Gong, D. J. Parish, and J. A. Chambers, “Using pattern-of-life as contextual information for anomaly-based intrusion detection systems,” inIEEE Access, vol. 5, no. 1, 2017, pp. 22177-22193.
[6] L. Snidaro, J. Garc´ıa, and J. Llinas, “Context-based information fusion: A survey and discussion,” inInformation Fusion, 25, 2015, pp. 16-31. [7] C. D. Stylios, and P. P. Groumpos, “Modeling complex systems using fuzzy cognitive maps,” in IEEE Transactions on Systems, Man and Cybernetics: Systems and Humans, vol. 34, no. 1, 2004, pp. 155-162. [8] R. E. T. Jones, E. S. Connors, M. E. Mossey, J. R. Hyatt, N. J. Hansen, and M. R. Endsley, “Modeling situation awareness for Army infantry platoon leaders using fuzzy cognitive mapping techniques,” inProc. of the Behavior Representation in Modeling and Simulation Conference (BRiMS), 2010, pp. 216-223.
[9] M. M. Kokar, and M. R. Endsley, “Situation awareness and cognitive modeling,” inIEEE Intelligent Systems, vol. 3, 2012, pp. 91-96. [10] M. Jazzar, and A. Jantan, “Towards real-time intrusion detection
using fuzzy cognitive maps modeling and simulation,” inProc. of the International Symposium on Information Technology (ITSim), vol. 2, 2008, pp. 1-6.
[11] B.-C. Cheng, G.-T. Liao, C.-C. Huang, and M.-T. Yu, “A novel probabilistic matching algorithm for multi-stage attack forecasts,” in IEEE Journal on Selected Areas in Communications, vol. 29, no. 7, 2011, pp. 1438-1448.
[12] S. Luo, J. Wu, J. Li, and L. Guo, “A multi-stage attack mitigation mechanism for software-defined home networks,” in IEEE Transac-tions on Consumer Electronics, vol. 62, no. 2, 2016, pp. 200-207. [13] N. El Moussaid, A. Toumanari, and M. El Azhari, “Security analysis
as software-defined security for SDN environment”, inProc. of the 4th International Conference on Software Defined Systems (SDS), 2017, pp. 87-92.
[14] L. Hellemons, L. Hendriks, R. Hofstede, A. Sperotto, R. Sadre, and A. Pras, “SSHCure: a flow-based SSH intrusion detection system,” in IFIP International Conference on Autonomous Infrastructure, Man-agement and Security, 2012, pp. 86-97.
[15] S. Chandran, P. Hrudya, and P. Poornachandran, “An efficient classifi-cation model for detecting advanced persistent threat,” inProc. of the International Conference on Advances in Computing, Communications and Informatics (ICACCI), 2015, pp. 2001-2009.
[16] G. Shafer,A mathematical theory of evidence, Princeton University Press, 1976.
[17] K. G. Kyriakopoulos, F. J. Aparicio-Navarro, and D. J. Parish, “Manual and automatic assigned thresholds in multi-layer data fusion intrusion detection system for 802.11 attacks,” inIET Information Security, vol. 8, no. 1, 2014, pp. 42-50.
[18] R. E. Jones, E. S. Connors, and M. R. Endsley, “Incorporating the human analyst into the data fusion process by modeling situation awareness using fuzzy cognitive maps,” inProc. of the International Conference on Information Fusion (FUSION), 2009, pp. 1265-1271. [19] M. Aharoni, D. Kearns, and R. Hertzog, “Kali Linux: Penetration
Testing and Ethical acking Linux Distribution,” [online] Available: https://www.kali.org (Access Date: 05 Mar, 2018).
[20] G. Lyon, “Nmap: The network mapper Free security scanner,” [online] Available: http://nmap.org/ (Access Date: 21 Jun, 2016).
[21] Greenbone, “Open Vulnerability Assessment System,” [online] Avail-able: http://www.openvas.org/index.html (Access Date: 05 Mar, 2018). [22] Metasploit, L.L.C., “The metasploit framework,” [online] Available:
http://www.metasploit.com (Access Date: 05 Mar, 2018).
[23] V. Jacobson, C. Leres, and S. McCanne, “Tcpdump,” 1987. [online] Available: http://www.tcpdump.org (Access date: 23 Jun, 2016).
[24] G. Combs, “TShark - The wireshark network analyser 2.4.6,” [online] Available: https://www.wireshark.org/docs/man-pages/tshark.html (Access Date: 5 Apr, 2018).
[25] A. Turner and M. Bing, “Tcpreplay: Pcap editing and replay tools for *NIX and Windows,” [online] Available: http://tcpreplay.sourceforge.net (Access Date: 05 Mar, 2018).
![Fig. 2. [6 × 6] adjacency matrix including the weight values w i j used in our experiments](https://thumb-us.123doks.com/thumbv2/123dok_us/9018933.2799720/3.918.491.805.406.533/fig-adjacency-matrix-including-weight-values-used-experiments.webp)