ORIGINAL PAPER
Why do drivers exceed speed limits
George Yannis&Georgia Louca&Sophia Vardaki& George Kanellaidis
Received: 4 April 2012 / Accepted: 8 February 2013 / Published online: 2 March 2013
#The Author(s) 2013. This article is published with open access at SpringerLink.com
Abstract
Purpose The present study attempts to explore relationships between drivers’attitude towards exceeding speed limits in different types of road and the drivers’characteristics and self-reported speed behaviour.
Method The basis of the study was the answers that approxi-mately 1.000 drivers from each of 23 European countries gave to specific questions of a specially designed questionnaire relat-ing to speed behaviour and other personal characteristics. Log linear analysis was used and four models were developed: for motorways, main roads, country roads and built-up area roads. Results/Conclusions The model application revealed that the dependent variable (self-reported exceeding the speed limit) is strongly dependent on the belief that other drivers exceed speed limits for all four road types. Other variables found to have an impact on the attitude towards exceeding speed limits concern driver characteristics (gender, age group, annual kilometrage), opinions (enjoyment of driving fast, the expectation of speed enforcement and wishes for higher limits) and self-reported behaviour (having received penalty for speeding) and other parameters (engine capacity of its car, signalling others about police trap).
Keywords Road safety . Speeding . Speed limits . Driver . Opinions . Attitude
1 Background
Speeding is considered one of the principal determinants of traffic safety affecting not only the risk of being involved in a road accident but also the severity of the consequences of these accidents [19,22,27,28]. The establishment of safe speed limits has contributed to the reduction of fatal accidents and accidents with serious trauma, nonetheless speeding re-mains on the top of the accidents’causality list [17,32]. It is also reported that compliance with speed limits is positively related to improvement of traffic safety [7,23]. In addition, the understanding of the behaviour to exceed speed limits may be also useful for the development of the necessary regulations to reduce inappropriate speed choice [4,20,21]. The factors that compose the speeding issue are related to social attitudes and road behaviours as well as the road and vehicle characteristics [8,11,29]. The establishment of speed management measures and their enforcement is also related to the problem of speeding. The appropriate driving speed is set for each type of road or road section according to the road design [16]. But speed is also affected by the drivers’ social and psychological situation on driving time and other human factors [13]. Consequently, the opinion and self-reported behaviour of drivers on speeding is a serious matter that must be taken into account in setting and enforcing speed limits.
Rumar [22] stated that drivers do not believe that speed-ing is strongly related to road safety because human bespeed-ings do not fear the excessive speed as they fear the height, even though both speed and height can be transformed into kinetic energy. They also underestimate the impact of speed on road accidents, as they do not know that doubling their speed leads to four times more crash energy because the relationship between speed and energy gives the square of the second. At the same time, drivers appear to prefer to reduce their travel time rather than driving more safely, because they believe that they drive safer than others [12]. G. Yannis (*)
:
G. Louca:
S. Vardaki:
G. KanellaidisDepartment of Transportation Planning and Engineering, School of Civil Engineering, National Technical University of Athens, 5, Iroon Polytechniou str,
15773 Athens, Zografou Campus, Greece e-mail: [email protected] G. Louca
e-mail: [email protected] S. Vardaki
e-mail: [email protected] G. Kanellaidis
This is encouraged also by the fact that nowadays vehicle technology and road design developments make drivers feeling safer than few years ago.
The factors that influence speed choice are strongly related to drivers’ opinion in speeding and their social attitudes [10]. Their speed choice is especially affected by specific social environments like family, friends, passengers in the vehicle, police enforcement and speed management measures [6]. To this end, drivers are likely to choose their speed according to their estimation for other drivers’speed [9]. Sometimes, drivers exceed speed limits because they do not consider their existence important or because they drive carelessly [30]. Maybe this happens also because of the improvement of vehicle technology that isolates the driver from the outside acoustic environment [3].
Between the social reasons of exceeding speed limits is the configuration of the image of“slow drivers”. This social group is characterised by lack of self-confidence, low driv-ing ability and insecurity. Nobody wants to be placed in that group. Nevertheless, Deery [5] has noted that estimating the risk in driving is subjective for each driver and it consists of two parts. The first part concerns the incoming information from the driving environment and the second part concerns the part of the information that a driver uses in order to avoid a risk situation. So, the reasons for which a driver is willing to take risk may be a combination of wrong risk estimation, low driving ability and high risk level.
In order to face speeding, the most usual measure that is being taken is setting appropriate speed limits. Speed limits have a feedback relationship with factors that influence speed choice [14,15]. Setting appropriate speed limits is commonly related to the type of road and the driving risk estimation [18] and variable speed limits are often used on motorways’ seg-ments taking also into account the variable traffic conditions [1]. Speeding is different than exceeding speed limits respec-tively to the type of road and other factors. Respecting speed limits is also highly dependent on the level and the duration of the enforcement effort put by the Police [33].
During the last two decades, a group of scientists and re-searchers has been working on the study of opinions and self-reported behaviour of car drivers throughout the European continent, including SARTRE project (Social Attitudes to Road Traffic Risk in Europe). The first survey [24] was carried out from 1991 to 1992 in 15 countries, the second survey [25] was carried out from 1996 to 1998 in 19 countries, the third survey [26] was carried out from 2002 to 2005 in 23 countries and SARTRE 4 survey is just completed on mid 2011 with the participation of 22 countries. The SARTRE surveys are based on ad hoc gathering data, which involves a representative questionnaire study. In each country, 1.000 questionnaires have been completed and the answers were gathered and coded in a united database. This database was used for the statistical analysis of the European drivers’attitude towards road safety.
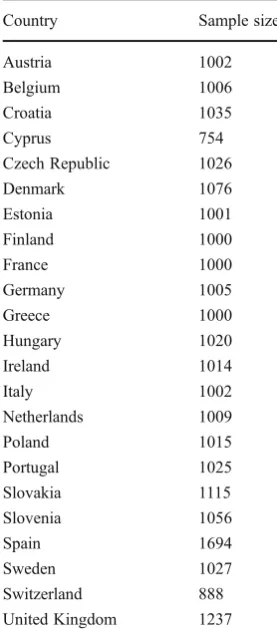
The present study attempts to explore relationships be-tween attitude towards exceeding speed limits in different types of road and the driver characteristics, his opinions and his self-reported speed behaviour. The basis of the study was the answers that drivers gave to specific questions of the SARTRE 3 questionnaire relating to speed behaviour and other personal characteristics. The questionnaires consisted of 55 questions on personal characteristics and attitudes towards road safety. Sample size per country participating in the SARTRE 3 survey is shown in Table1.
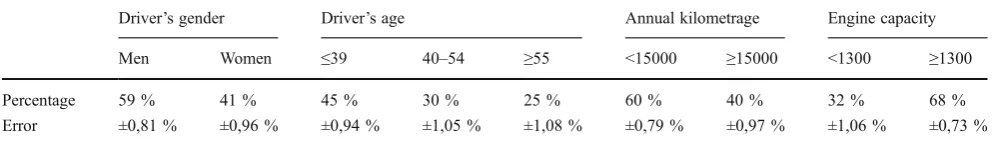
Basic characteristics of the sample of the survey are presented in Table2. These characteristics concern the gen-der and the age of the driver, the annual kilometrage of each driver and the engine capacity of the car he/she usually drives. Reliability was tested by calculating the error for a 95 % interval, using the following formula:
E¼K
ffiffiffiffiffiffiffiffiffi
pq n
r
where:
Ε: error
Κ=1.96: constant corresponding to a 95 % interval (U distribution)
p: percentage of observations with specific characteristics q=1- p
n: number of observations (n>30)
Table 1 Sample size per country participating in the SARTRE 3 survey
Country Sample size
Austria 1002
Belgium 1006
Croatia 1035
Cyprus 754
Czech Republic 1026
Denmark 1076
Estonia 1001
Finland 1000
France 1000
Germany 1005
Greece 1000
Hungary 1020
Ireland 1014
Italy 1002
Netherlands 1009
Poland 1015
Portugal 1025
Slovakia 1115
Slovenia 1056
Spain 1694
Sweden 1027
Switzerland 888
In order to choose the methodology and the variables in the analysis, a literature review on speeding issues took place. Next, the most appropriate methodology is being presented, following with the presentation of the results of the analysis and the conclusions.
This research investigated the hypothesis that the re-lationships between exceeding speed limits and other variables present similarities in all European countries participating in the SARTRE 3 survey.
2 Methodology
2.1 The methodology
The hypothesis, on which the analysis was based, was that it should be possible to identify relationships between vari-ables that are the same all over Europe. It was therefore necessary, as a first step, to select the most significant parameters for detailed analysis. Parameters included in the analysis should be well distributed otherwise they would not yield information for differentiation.
The method of log linear analysis was used to de-scribe the relationship between the dependent variables (self-reported exceeding the speed limit on a certain type of road) and a set of independent variables (logit models) [31]. Log linear analysis uses a generalised linear model, which estimates the cell counts of a Table, using differ-ent combinations of the margins. In a two-way Table the margins are the row and the column totals. In higher dimensional Tables, the margins are the sub-Tables of lower dimension.
The advantages of this method have also been described in the analyses of SARTRE 1 and SARTRE 2 data set [24, 25]. Log-linear modelling, in contrast to chi-square or cross-product ratios, can take more than two variables into con-sideration and can also include higher order interactions. This means that the procedure can also account for different relationships in different subgroups (e.g. for men and women, different age-groups, different countries). Log-linear modelling not only estimates parameters showing the extent to which variables and categories are linked, but also provides a test which indicates how well the finished model fits the data underlying the analysis
(Goodness of Fit). This is an important advantage of the selected method compared to traditional factor anal-ysis, for example, which does not provide such an indicator.
The rationale of the analysis can be briefly described as follows: look for the simplest model, which will recalculate the distribution of the dependent variable. The more com-plex the chosen model is, the better the recalculated distri-bution of the dependent variable will fit to the original data set. The Goodness of Fit (GoF) statistics stands for the quality of the model. Significance 0.1 and higher indicates well-adapted models. Consequently, the strategy of this methodology is to obtain a balance between model com-plexity and sufficient goodness of fit statistics.
Log-linear analysis, however, needs specific qualities of the variables and can only be reasonably applied to sets of variables not exceeding seven to ten. Therefore this method requires a few steps of preparation at the beginning.
2.2 Modelling process
A set of theory based variables, which attempts to explain self-reported behaviour of exceeding speed limits (depen-dent variable) was firstly developed. The set in question included variables concerning the socio-demographic characteristics of the driver as well as his/her driving experience, his/her beliefs about other driver behaviour, his/her attitudes to regulations (were included into the set of variable considered).
Log-linear modelling needs categorical data and modelling is usually more successful if the number of categories is limited. Therefore, distribution characteris-tics were an important criterion for selecting variables. Variables were recoded to obtain the desired qualities for analysis.
In order to reduce the number of variables, simple statistical methods of data analysis were initially used to understand distribution patterns and to select the most important ones. Subsequently, correlation analyses and analyses of variance determined the final selection of a set of variables.
Variables with a stated significant impact on the behaviour of drivers exceeding speed limits, included in the model, are described below, those related to
Table 2 Distribution (%) of the characteristics of the survey sample
Driver’s gender Driver’s age Annual kilometrage Engine capacity
Men Women ≤39 40–54 ≥55 <15000 ≥15000 <1300 ≥1300
Percentage 59 % 41 % 45 % 30 % 25 % 60 % 40 % 32 % 68 %
sample characteristics presented first and those express-ing specific questions afterwards:
& dage_cl–age-groups. Age of drivers is classified into
three groups: drivers under 39 years-old (class value 1), drivers of age between 40 and 54 years-old (class value 2) and drivers over 55 years old (class value 3).
& dkilom_c(1 2)–annual kilometrage. It is a continuous
variable and consequently a classification into two groups was chosen. Value 1 refers to those driving less than 15.000 km annually and value 2 refers to those driving 15.000 km or more annually.
& gender(1 2). Value 1 refers to men and value 2 refers to
women.
& dq50 (1 2)–engine capacity. Value 1 refers to those
driving cars of low engine capacity (below 1,300 cc) and value 2 refers to those driving cars of high engine capacity (over 1,300 cc).
& dq13_e (1 2)–Warning police controls. This variable
concerns answers to the question “How often do you signal other drivers to warn them of a police speed trap ahead?”. The answers were classified into two groups, where“never”,“rarely”and“sometimes”were recoded as value 1 and“often”,“very often”and“always”were recoded as value 2.
& dq12 (1 2)–penalty for speeding. In the last 3 years, if a
driver reported not been fined and/or not been ex-perienced a sanction for breaking the speed limit, the respective answer was recoded as 1. Otherwise (the driver was fined), the answer was recoded as 2.
& dq07 (1 2)–others brake speed limits. At the question
“How often do you think other drivers break the speed limits?”, value 1 refers to answers“never”,“rarely”and “sometimes” and value 2 refers to answers “often”, “very often”and“always”.
& dq29_b (1,2)–enjoyment of driving fast. If the driver
agreed to the statement that he/she enjoys driving fast very or fairly, his/her answer was recoded as 1, otherwise his/her answer was recoded as 2.
& dq10 (1 2)–wished speed limit in…. Value 1 refers to
drivers who whished for higher or no speed limits and value 2 refers to drivers not whishing higher or no speed limits, for each specific category of road network.
& dq11 (1 2)–expectation of speed enforcement. If a
driver believed that on a typical journey it is never, rarely or sometimes likely to be checked for speeding, his/her answer was recoded as 1, otherwise, his/her answer was recoded as 2.
Additionally, variables considered but not finally retained in the models were:
& dq02_b (1 2)–more enforcement on the traffic. When
drivers reported being strongly in favour or in favour of
having more enforcement of traffic laws, their answers were recoded as 1. Otherwise, their answers were recoded as 2.
& dq08 (1 2)–speed choice compared to others. The
drivers’self-reported behaviour is described in this var-iable. According to previous studies [3], this appears to be a useful parameter, even though it was not included in the models finally adopted. If they believed that they drive faster than average speed, their answer was recoded as 1; otherwise, it was recoded as 2.
Several log linear regression models were developed in order to explain exceeding speed limit for all types of roads using variables from the set of independent variables described above. However those models have been unsuccessful for any type of road. Consequently, the set of variables was reduced step by step for every type of road independently. In this way suitable models were developed for each type of road.
It is noted that the development of a model for all types of roads was outside the scope of this investigation as the objective of this work is the identification of specific vari-ables influencing driver attitude and behaviour in each type of road. Such a model for all types of roads would propose a global picture of drivers’behaviour loosing thus the speci-ficity and individual characteristics of drivers’behaviour in the various road types (urban, rural, etc.).
3 Model development and application
The four models developed are presented in the following sections. The presentation progresses from roads with higher speed limits (motorways and main roads) to roads with lower speed limits (country and urban roads). Numbers connecting the various boxes of the diagrams stand for the z-values of each parameter (parameter is a part of the log-linear equation). All of the variables were recoded and they contain two values (1, 2), except from the age groups, which contain three values (1, 2, 3). Age groups were categorized into three groups, so in the models where this variable appears, there are two z-values standing for the respective parameters.
3.1 Motorways
For those roads with the highest speed limits, a general model for exceeding the speed limit was developed, which includes the following set of variables.
Variables in the model:
& annual kilometrage
& gender
& engine capacity
& others break speed limits
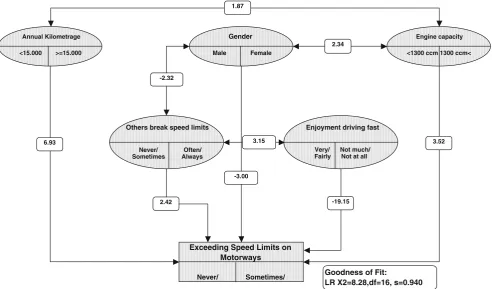
Figure1shows the five main effects on exceeding speed limits on motorways and the five interactions between inde-pendent variables, which are also relevant to exceeding speed limits on motorways.
The model achieves a considerable fit with significance of 0,940, which indicates that this model describes the large majority of the sample.
Direct relations between independent variables and exceeding speed limits on motorways: Results indicates the following:
& Drivers, who declare that they enjoy driving fast, exceed
speed limits on motorways.
& Drivers with an annual kilometrage of more than
15.000 km exceed speed limits on motorways frequently.
& The vehicle’s engine capacity is related to exceeding
speed limits on motorways. Drivers whose vehicle’s engine capacity is more than 1,300 cc exceed speed limits on motorways more frequently than those whose vehicle’s engine capacity is less than 1,300 cc.
& Male drivers exceed speed limits on motorways more
often than female drivers.
& Drivers, who believe that other drivers exceed speed
limits, exceed speed limits themselves on motorways often.
Interactions between several independent variables and exceeding speed limits on motorways: Interactions
between independent variables (ranked by importance) and their relation to exceeding speed limits on motorways are to be understood as follows:
& Drivers who enjoy driving fast, never or sometimes
believe that other drivers exceed speed limits.
& Male drivers, who believe that other drivers exceed
speed limits, drive cars with low engine capacity.
& Drivers of cars with low engine capacity and with an
annual kilometrage of less than 15.000 km, never or rarely exceed speed limits on motorways.
3.2 Main roads
Similarly to the analysis for exceeding speed limits on motorways, the model for exceeding the speed limits on main roads includes the following set of variables.
Variables in the model:
& annual kilometrage
& gender
& age group
& others break speed limits
& engine capacity
Comparing to the model for exceeding speed limits on motorways, it can be observed that the age of the drivers is relevant to their self-reported behaviour towards exceeding
Annual Kilometrage
<15.000 >=15.000
Gender
Male Female
Engine capacity
<1300 ccm 1300 ccm<
Others break speed limits
Never/ Often/ Sometimes
Enjoyment driving fast
Very/ Not much/ Fairly Not at all
Exceeding Speed Limits on Motorways
Never/ Sometimes/ -2.32
6.93
2.42 -19.15
2.34
-3.00 1.87
3.52 3.15
Goodness of Fit:
LR X2=8.28,df=16, s=0.940 Always
speed limits on main roads but it is not relevant to exceeding speed limits on motorways. It is worth noting that driver gender has not a significant direct relation to the dependent variable (self-reported exceeding speed limits on main roads), but its significant interactions with the annual kilometrage and the age groups provide a more detailed relation of those independent variables with exceeding speed limits on main roads.
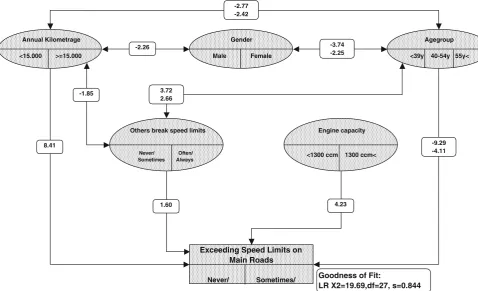
Figure2shows the five main effects on exceeding speed limits on main roads and the five interactions between independent variables, which are also relevant for exceeding speed limits on motorways.
The model attains a considerable fit with significance of 0,844.
Direct relations between independent variables and exceeding speed limits on main roads: Results here indi-cate that:
& Younger drivers exceed speed limits on main roads
more often.
& Drivers with an annual kilometrage of more than
15.000 km exceed speed limits on main roads more often.
& Drivers, whose vehicle’s engine capacity is more than
1,300 cc, exceed speed limits on main roads more often.
& Drivers, who believe that other drivers exceed speed
limits, exceed speed limits themselves more often on main roads.
Interactions between several independent variables and exceeding speed limits on main roads: Interactions between independent variables (ranked by importance) and their relationship to exceeding speed limits on main roads are to be understood as follows:
& Drivers, who believe that other drivers exceed speed
limits, are younger drivers with an annual kilometrage of less than 15.000 km.
& Younger female drivers drive less than 15.000 km
annually.
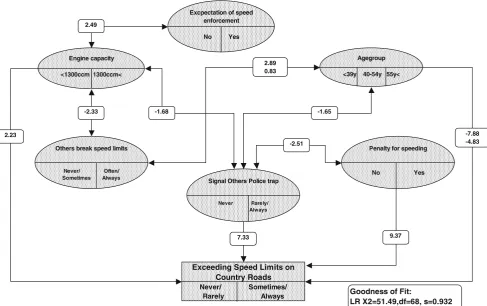
3.3 Country roads
Similarly to the analysis for exceeding speed limits on motor-ways and main roads, the model for exceeding the speed limits on country roads includes the following set of variables.
Variables in the model:
& age group
& engine capacity
& warning police controls
& penalty for speeding
& others break speed limits
& expectation of speed enforcement
The final model has very good GoF-statistics and it in-cludes variables associated with the drivers’ self-reported
Annual Kilometrage
<15.000 >=15.000
Gender
Male Female
Agegroup
<39y 40-54y 55y<
Others break speed limits
Never/ Often/ Sometimes Always
Engine capacity
<1300 ccm 1300 ccm<
Exceeding Speed Limits on Main Roads
Never/ Sometimes/
-2.26 -3.74
-2.25
3.72 2.66
-2.77 -2.42
8.41
-1.85
1.60
-9.29 -4.11
4.23
Goodness of Fit:
LR X2=19.69,df=27, s=0.844
speed behaviour and their experience in sanctions for speeding.
The interactions between the independent variables are complicated. Experience in sanctions for speeding, as well as the expectation of speed enforcement, is included in the model giving high goodness of fit statistics. Therefore there is no significant direct relationship between expec-tation of speed enforcement and exceeding speed limits on country roads.
Figure3shows the four main effects of exceeding speed limits on country roads and the six interactions between independent variables.
The model attains a considerable fit with significance of 0,932, which represents a high fidelity model.
Direct relations between independent variables and exceeding speed limits on country roads: Results here show that:
& Drivers, who have been fined for exceeding speed limits
on country roads, are more likely to exceed speed limits again on this type of roads.
& Younger drivers exceed speed limits on country roads
more frequently.
& Drivers, who signal others for police traps, exceed speed
limits on country roads more frequently.
& Drivers of vehicles with an engine capacity of more than
1,300 cc exceed speed limits on country roads more often.
Interactions between several independent variables and exceeding speed limits on country roads: Interactions between independent variables (ranked by importance) and their relation to exceeding speed limits on country roads are to be understood as follows:
& The fact that younger drivers exceed the speed limit on
country roads is more pronounced in the group of younger drivers who believe that other drivers often or always exceed speed limits.
& Younger drivers, who signal other drivers for police
traps, are more likely to exceed speed limits on country roads than the rest of the drivers in the group.
& Regarding the self-reported penalty for exceeding speed
limits, drivers who have been fined before, usually sig-nal other drivers for police traps.
& Although drivers of vehicles with high engine capacity
expect speed enforcement, they continue to exceed speed limits on country roads.
& Drivers of cars with high engine capacity, who believe
that other drivers exceed speed limits, are more likely to exceed speed limits on country roads.
Engine capacity
<1300ccm 1300ccm<
Agegroup
<39y 40-54y 55y<
Others break speed limits
Never/ Often/ Sometimes Always
Penalty for speeding
No Yes
Exceeding Speed Limits on Country Roads Never/ Sometimes/
Rarely Always -1.68
2.89 0.83
2.23
-2.33
-7.88 -4.83
Signal Others Police trap
Never Rarely/ Always
-1.65
-2.51
7.33
Goodness of Fit:
LR X2=51.49,df=68, s=0.932 Excpectation of speed
enforcement
No Yes 2.49
9.37
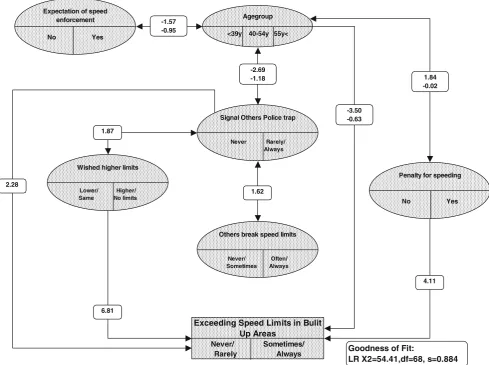
3.4 Built-up area roads
Finally, regarding exceeding speed limits in built up areas, the same procedure was followed and the final model in-cludes the following set of variables.
Variables in the model:
& age group
& wished higher limits
& warning police controls
& penalty for speeding
& others break speed limits
& expectation of speed enforcement
The final model has very good GoF-statistics and it includes variables regarding the drivers’ self-reported speed behaviour and their experience in sanctions for speeding.
It is important to note that the variable of wishing for different speed limits in built up areas is included in the model while the respective variable did not show to be good in models concerning the other types of road.
Another issue to consider is that the opinion that other drivers exceed speed limits and the expectation of speed enforcement are not directly related to exceeding speed limits, in built up areas, but have interactions with other variables as shown in this section.
Figure4shows the four main effects of exceeding speed limits in built up areas and the five interactions between independent variables. The model attains a considerable fit with significance of 0,841, which means a very high quality of model.
Direct relations between independent variables and exceeding speed limits in built up areas: The direct rela-tionship between independent variables and exceeding speed limits in built up areas ranked by importance are given as follows.
& People who wished for higher limits in built up areas, exceed
speed limits from sometimes to always in those areas.
& As found for the other types of roads, younger drivers
exceed speed limits more often than the other age groups, in built up areas too.
Agegroup
<39y 40-54y 55y<
Others break speed limits
Never/ Often/ Sometimes Always
Penalty for speeding
No Yes
Exceeding Speed Limits in Bulit Up Areas
Never/ Sometimes/ Rarely Always
1.62 2.28
-3.50 -0.63
Wished higher limits
Lower/ Higher/ Same No limits
1.87
6.81
Signal Others Police trap
Never Rarely/ Always
4.11
Goodness of Fit:
LR X2=54.41,df=68, s=0.884 Expectation of speed
enforcement
No Yes
-1.57 -0.95
-2.69
-1.18 1.84
-0.02
& Regarding the drivers’ experience in penalties for ex-ceeding speed limits, people who have been fined, insist in exceeding speed limits in built up areas.
& Finally, people who signal others for police controls,
exceed speed limits themselves.
Interactions between several independent variables and exceeding speed limits in built up areas: Interactions between independent variables (ranked by importance) and their relation to exceeding speed limits in built up areas are to be understood as follows:
& The finding that younger drivers exceed the speed limit
in built up areas is more pronounced in the group of younger drivers who signal other drivers for police traps.
& In addition, people who wished for higher speed limits
and exceed the existing limits, usually warn other drivers for police traps.
& Drivers, who exceed the speed limits in built up areas and
also warn other drivers for police controls, are more pro-nounced to speed if they also believe that other drivers exceed speed limits, too. However, this belief is not di-rectly related to exceeding speed limits in built up areas.
& Younger drivers, who do not expect speed enforcement,
are more likely to exceed speed limits in built up areas.
& The same appears to happen with older drivers who have
not been fined for speeding.
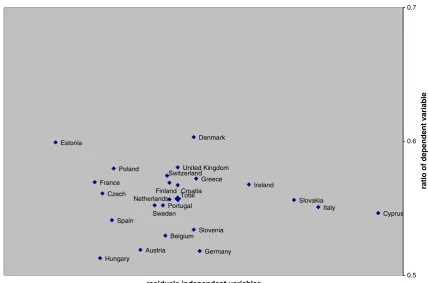
3.5 Validity of the exceeding speed limits model for different types of road with respect to the different countries
It is important to note that, in spite of this general model, there is still a range of differences concerning exceeding speed limits in different types of road among the countries, which have participated in the survey. Applying the method of log-linear modelling to samples of countries individually tended, in some cases, to yield different results for each type of road. This means that, in some countries, specific circum-stances tended to change the model in the sense that it would be improved according to the special conditions in that given country. These conditions (traffic density and compo-sition, pedestrian traffic density, level of enforcement, etc.) are specifically related to certain distribution patterns of the variables, which have been included in the models.
For example, Fig.5shows on the y-axis that the percent-age of people who say that they exceed the speed limits on motorways ranges from about 51 % in Hungary to about 60 % in Denmark and Estonia; the average in the total sample being about 56 %. Those percentages concern drivers who fulfil the conditions described by the log-linear model. More specifically, the parameters that affect the proportion of drivers exceeding the speed limits on motorways in this model are the annual kilometrage, the engine capacity, the drivers’gender, and whether they enjoy
Total Estonia Denmark
Poland United Kingdom
France
Switzerland
Czech
Ireland
Netherlands Portugal
Spain
Hungary
Austria Belgium Sweden
Slovenia
Germany Greece
Slovakia Italy
Cyprus Croatia
Finland
0.5 0.6 0.7
residuals independent variables
ratio of dependent variable
driving fast and/or believe that other drivers exceed speed limits. The results of the principal analysis indicated that the differences among the participating countries tend to be associated with the above-mentioned variables. On the x-axis the residuals of the independent variables for the Netherlands, Portugal, Sweden, Croatia, Finland, Greece, Switzerland and United Kingdom are quite close to the total, while Estonia, Hungary, Denmark, Germany and Cyprus have the greatest distance.
The closer the dot of the country to the“Total”the better the described model will fit to the data of that country. Regarding motorways, it is noted that models specific to the countries Estonia, Italy and Cyprus differ from the described model.
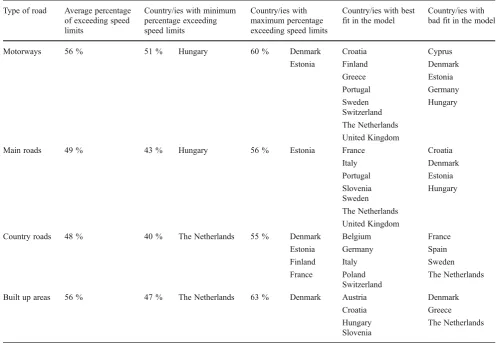
Similarly to the above, Table 3 shows the average, the minimum and maximum percentage of drivers exceeding speed limits on different types of road accordingly to their country. It also shows the countries with the best and the worst fitting to the model each time.
The proportions in Table3refer to drivers who fulfil the conditions described in the log-linear model. So, in a prin-cipal analysis within the whole sample of the participant countries, the proportions of drivers exceeding speed limits on different types of road might be different.
4 Discussion
4.1 Summary of results
The in-depth analysis of drivers attitudes towards exceeding speed limits on the four types of roads (motorways, main roads, country roads and built up areas) revealed that several variables are directly associated with the choice of exceed-ing speed limits. The log-linear models developed have very high Goodness-of-fit (GoF) results. However, the GoF-statistics may not always be that good if the models are applied to each country separately. This difference could be explained by the different characteristics of road traffic and drivers’behaviour in each country.
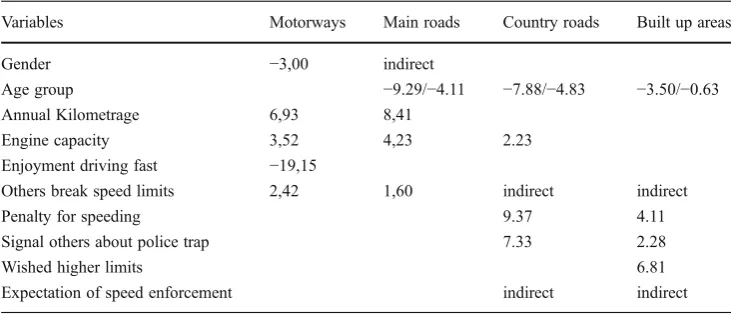
The relations between independent and dependent vari-ables are summarised in Table4showing an overview of the parameters influencing attitudes towards exceeding speed limits in each type of road network. The most important finding is that drivers’belief of other drivers braking speed limits is the parameter influencing drivers’attitude towards exceeding speed limits in all types of networks; however this finding is only indirectly related to urban roads. Engine capacity is shown to influence drivers’attitudes in all roads
Table 3 Distance from average distribution from set of independent variables and from distribution of dependent variable
Type of road Average percentage of exceeding speed limits
Country/ies with minimum percentage exceeding speed limits
Country/ies with maximum percentage exceeding speed limits
Country/ies with best fit in the model
Country/ies with bad fit in the model
Motorways 56 % 51 % Hungary 60 % Denmark Croatia Cyprus
Estonia Finland Denmark
Greece Estonia
Portugal Germany
Sweden Hungary
Switzerland The Netherlands United Kingdom
Main roads 49 % 43 % Hungary 56 % Estonia France Croatia
Italy Denmark
Portugal Estonia
Slovenia Hungary
Sweden The Netherlands United Kingdom
Country roads 48 % 40 % The Netherlands 55 % Denmark Belgium France
Estonia Germany Spain
Finland Italy Sweden
France Poland The Netherlands Switzerland
Built up areas 56 % 47 % The Netherlands 63 % Denmark Austria Denmark
Croatia Greece
outside urban areas, whereas driver’s age was found to influence driver’s attitude in all types of roads except in motorways. Gender, annual kilometrage and enjoyment driving fast were found to be significant influencing drivers self-reported speed behaviours and attitudes only in high speed roads (motorways and main roads), whereas having received penalty for speeding, signalling other drivers about police trap, wishing higher limits and expectation of speed enforcement tend to influence drivers attitudes in roads with lower speed limits (country and urban roads).
4.2 Conclusions
One of the most important findings of the survey is that about 50 % of the drivers admit exceeding speed limits in the four types of road in every country.
With respect to the four models proposed, it is important mentioning that in every model, different variables were retained for each type of road. However, the only variable constant in all models is the belief that other drivers exceed speed limits. This indicates that independently from the type of road, drivers exceeding speed limits use as a justification that other drivers exceed speed limits.
The finding that vehicle engine capacity significantly tended to influence driver attitude in all roads outside urban areas may be explained by the fact that more powerful vehicles not only can more easily use higher speeds but also they create the impression that slowing down is easier; this seems to be often true. This finding confirms existing results indicating that beliefs on the impact of vehicle engine capacity to driver speeding behaviour [2].
Driver’s age was found to have a significant impact to the self-reported behaviour of exceeding speed limits on main roads, country roads and inside built up areas. As expected, younger drivers were found to exceed speed limits more often than other drivers [5]. It is however, interesting to note that younger drivers do not exceed speed limits more often than older drivers on motorways, perhaps not because they behave better on motorways. but because drivers of all ages
break speed limits on motorways (higher design standards, less police presence).
Annual kilometrage was found significant for driver atti-tude towards breaking speed limits in high speed roads (motorways and main roads), perhaps because the gain of time in long distance may better justify breaking the limits by all those frequent drivers who attempt to minimise their exposure on the road.
The impact of drivers’ enjoyment of driving fast on drivers’ attitude towards exceeding speed limits was found significant only on motorways, as this type of network is the most appropriate for higher speeds. This finding may lead to the conclusion that, in all other types of road networks, drivers do not exceed speed limits for their pleasure.
Previous self-reported penalty for speeding was found significant for drivers’ attitude towards exceeding speed limits on country and urban roads. This finding may have psychological implications, that is, those types of drivers may exhibit psychopathic and/or gambling behaviour, and hence they continue to exceed speed even if they were fined in previous occasions. This interesting finding, however, should be further investigated by psychologically oriented research. Additionally, signalling others for police traps was also found significant in country and urban roads; this may be explained by the fact that drivers exceeding speed limits want to express their brotherhood feelings against a com-mon enemy (the police) and protect other drivers exhibiting similar behaviour (breaking speed limits) from fined and/or arrested.
The expectation of speed enforcement was also examined and the findings showed a significant interaction with other variables influencing exceeding speed limits only on country roads and in built up areas. Apparently, the higher presence of speed enforcement on those types of roads has a direct impact on driver’s attitude and self-reported behaviour towards exceeding speed limits.
Finally, it is interesting to note that drivers wishing higher speed limits in built up areas are those breaking speed limits
Table 4 Impact of variables on
exceeding speed limits Variables Motorways Main roads Country roads Built up areas
Gender −3,00 indirect
Age group −9.29/−4.11 −7.88/−4.83 −3.50/−0.63
Annual Kilometrage 6,93 8,41
Engine capacity 3,52 4,23 2.23
Enjoyment driving fast −19,15
Others break speed limits 2,42 1,60 indirect indirect
Penalty for speeding 9.37 4.11
Signal others about police trap 7.33 2.28
Wished higher limits 6.81
more often. Inappropriate speed limits are common justifi-cations of all those breaking speed limits; this was fortu-nately found significant only for urban roads. This finding leads to the conclusion that in non urban roads all those exceeding speed limits are aware that they are breaking limits they consider appropriate.
4.3 Recommendations
The belief that others break speed limits influences signifi-cantly driver attitude towards exceeding speed limits and consequently any enforcement intensification could reduce the belief of others breaking speed limits and will subse-quently lead drivers to reduce the frequency of exceeding speed limits. In fact, others exceeding speed limits is often used as a justification for drivers’own behaviour and con-sequently, the less drivers exceed speed limits the more each driver has no excuse to exceed speed limits and may revise his behaviour.
The results of this research show clearly that there is need for different measures to face speed limit breaking in roads inside and outside urban areas. In higher speed roads, em-phasis (e.g. enforcement) should be given to frequent drivers (high kilometrage) and to vehicles with higher en-gine capacity, whereas in roads with lower speed limits (country and urban roads) emphasis should be given to frequency of penalties (and required psycho-educational classes) for speeding and for drivers signalling others about police trap. The specific results of this research could be proved useful for all those designing speed management programs inside and outside urban areas, allowing for a better exploitation of the limited road safety resources.
Additionally, the role of age in exceeding speed limits was found to be–as expected–significant for all types of roads except motorways, making thus more important any safety measures focussing on speed control of younger drivers. Special provisions for novice drivers (conditional driving licence, psycho-educational classes, etc.) as well as information and enforcement campaigns targeting younger drivers could therefore be proved beneficial for promoting roads with fewer drivers exceeding speed limits and conse-quently less road accidents.
Finally, road safety measures should be designed for the specific particularities of each country as traffic conditions and driver behaviour often present significant differences. Actions at EU level are definitively necessary but they could bring more effective results if they are combined with measures at national level targeting the specific national problems.
Acknowledgments This paper is based on the work carried out in the SARTRE 3 research project, partly financed by the European Commission. The authors would like to thank Dr. Christian Brandstätter from KfV for useful suggestions in earlier drafts of this work.
Open AccessThis article is distributed under the terms of the Creative Commons Attribution License which permits any use, distribution, and reproduction in any medium, provided the original author(s) and the source are credited.
References
1. Abdel-Aty M, Dilmore J, Dhindsa A (2006) Evaluation of variable speed limits for real-time freeway safety improvement. Accid Anal Prev 38:335–345
2. Bener A, Al Maadid MGA, Ozkan T, Al-Bast DAE, Diyab KN, Lajunen T (2008) The impact of four-wheel drive on risky driver behaviours and road traffic accidents. Transp Res F Traffic Policy Pract 11:324–333
3. Corbett C (2001) Explanations for understanding in self reported speeding behaviour. Transp Res F Traffic Policy Pract 4:133–150 4. De Pelsmacker P, Janssens W (2007) The effect of norms, attitudes and habits on speeding behaviour: scale development and model building and estimation. Accid Anal Prev 39:6–15
5. Deery AH (1999) Hazard and risk perception among young novice drivers. J Saf Res 30(4):225–236
6. Elliott MA, Armitage CJ, Baughan CJ (2007) Using the theory of planned behaviour to predict observed driving behaviour. Br J Soc Psychol 46:90–96
7. Elvik R, Christensen P, Amundsen A (2004) Speed and road accidents. An evaluation of the power model. for the Institute of Transport Economics TOI, Oslo
8. FHWA (1997) Study tour of road safety audits–final report. for the Federal Highway Administration U.S. Department of Transportation
9. Haglund M, Åberg L (2000) Speed choice in relation to speed limit and influences from other drivers. Transp Res F Traffic Policy Pract 3:39–51
10. Jorgensen F, Pedersen H (2005) Enforcement of speed limits– actual policy and drivers’knowledge. Accid Anal Prev 37:53–62 11. Kanellaidis G (1995) Factors affecting drivers’choice of speed on
roadway curves. J Saf Res 26(1):46–56
12. Kanellaidis G, Golias J, Zarifopoulos K (1995) A survey of drivers’ attitudes towards speed limit violations. J Saf Res 26 (1):31–40
13. Kanellaidis G, Zervas A, Karagioules V (2000) Drivers’ risk perception of road design elements. Transp Hum Factors 2:39–48 14. Khan N, Sinha CK (1999) An analysis of speed limit policies for Indiana. Joint Transportation Research Program, Draft Final Report, FHWA/IN/JTRP-99/14, pp. 30–31
15. Letirand F, Delhomme P (2005) Speed behaviour as a choice between observing and exceeding the speed limit. Transp Res F Traffic Policy Pract 8:481–492
16. Mannering F, Washburn S, Kilareski W (2009) Principles of high-way engineering and traffic analysis, 4th edn. Wiley, New York 17. MASTER: Managing Speed of Traffic on European Roads (1997)
Present speeds and speed management methods in Europe. Deliverable 4
18. NCHRP (2009) A guide for reducing speeding-related crashes, national cooperative highway research programme, report 500, volume 23
19. OECD (2006) Speed management. OECD/ECMT, Paris
20. Quimby A, Maycock G, Palmer C, Buttress S (1999a) The factors that influence a driver’s choice of speed—a questionnaire study. for TRL, Crowthorne
21. Quimby A, Maycock G, Palmer C, Grayson GB (1999b) Driver’s speed choice: an in-depth study. for TRL, Crowthorne
23. SafetyNet (2009) Speeding, European Road Safety Observatory, European Commission, Brussels
24. SARTRE 1 (1994) European drivers and traffic safety. Presses de l’Ecole Nationale des Ponts et Chaussées. Paris, France
25. SARTRE 2 (1998) The attitude and behaviour of European Car drivers to Road Safety. Part 1; report on principal results, SWOV Institute for Road Safety Research, The Netherlands
26. SARTRE 3 (2005) Making our drivers and roads safer, INRETS, Paris 27. SWOV (2009) The relation between speed and crashes, SWOV Fact Sheet, SWOV Institute for Road Safety Research, The Netherlands 28. Taylor MC, Lynam DA, Baruya A (2000) The effects of drivers’
choice of speed on the frequency of road accidents. for TRL, Crowthorne
29. Van Schagen I, Aarts L (2006) Driving speed and the risk of road crashes. Accid Anal Prev 38(2):215–224
30. Warner H, Aberg L (2008) Drivers’beliefs about exceeding speed limits. Transp Res F Traffic Policy Pract 11:376–389
31. Washington SP, Karlaftis MG, Mannering FL (2011) Statistical and econometric methods for transportation data analysis, 2nd edn. Chapman & Hall/CRC Press, Boca Raton
32. WHO (2008) Speed management, a road safety manual for decision-makers and practitioners. World Health Organisation, Geneva