theRepository at St. Cloud State
Culminating Projects in Mechanical andManufacturing Engineering
Department of Mechanical and Manufacturing Engineering
12-2016
Improving Big Data Processing Time
Ruqia Maihveen LnuSt. Cloud State University
Follow this and additional works at:https://repository.stcloudstate.edu/mme_etds
This Starred Paper is brought to you for free and open access by the Department of Mechanical and Manufacturing Engineering at theRepository at St. Cloud State. It has been accepted for inclusion in Culminating Projects in Mechanical and Manufacturing Engineering by an authorized administrator of theRepository at St. Cloud State. For more information, please [email protected].
Recommended Citation
Lnu, Ruqia Maihveen, "Improving Big Data Processing Time" (2016).Culminating Projects in Mechanical and Manufacturing Engineering. 62.
Improving Big Data Processing Time
by
Ruqia Maihveen
A Starred Paper
Submitted to the Graduate Faculty of St. Cloud State University
in Partial Fulfillment of the Requirements for the Degree
Master of Engineering Management
December, 2016
Starred Paper Committee: Ben Baliga, Chairperson
Hiral Shah Balasubramanian Kasi
Abstract
The process of storing and processing massive amounts of data (big data) in a traditional database is expensive and consumes a lot of time to obtain desired results. This project has been implemented to solve these problems faced by an organization, with the implementation of Hadoop framework that stores huge data sets on distributed clusters and performs parallel data processing to achieve results quickly. It uses commodity hardware to store the data making it cost effective and provides data security by replicating the data sets. The main goals of the project were to improve the performance of processing huge data sets, reduce long term data storage costs and provide a platform that supports ad hoc analysis and provides real-time insights. The project was structured to follow agile model of software development and the data was collected and analyzed after the execution of the project. The results obtained by the analysis of data aided in arriving to the conclusion and validating that the stated goals were achieved.
Acknowledgements
I would like to take this opportunity to express my humble gratitude to my advisor Dr. Ben Baliga for his tremendous support and for the guidance he has provided me that led to the successful completion of my starred paper. I would also like to extend my thanks to Dr. Hiral Shah and Dr. Balasubramanian Kasi for serving as committee members and providing useful insights throughout the process. I am also very grateful for the necessary resources provided by the Department of Engineering Management, SCSU.
I wish to thank my friends for their continuous support that made my masters journey a memorable experience. Finally, I would like to express my deepest gratitude to my family for the unconditional love and support they provided me throughout my life. Their belief in me continues to motivate me to work hard towards achieving my goals.
Table of Contents Page List of Tables ... 6 List of Figures ... 7 Chapter I. Introduction ... 8 Introduction ... 8 Problem Statement ... 9
Nature and Significance of the Problem ... 9
Objective of the Project ... 10
Project Questions ... 10
Limitations of the Project ... 11
Definition of Terms ... 11
Summary ... 13
II. Background and Review of Literature ... 14
Introduction ... 14
Background Related to the Problem ... 14
Literature Related to the Problem ... 15
Literature Related to the Methodology ... 20
Summary ... 28
III. Methodology ... 29
Chapter Page
Design of the Study ... 29
Data Collection ... 33
Data Analysis ... 38
Budget ... 39
Timeline ... 39
Summary ... 40
IV. Data Presentation and Analysis ... 41
Introduction ... 41
Data Presentation ... 41
Data Analysis ... 46
Summary ... 48
V. Results, Conclusion, and Recommendations ... 49
Introduction ... 49 Results ... 49 Conclusion ... 51 Recommendations ... 52 References ... 53 Appendix ... 54
List of Tables
Table Page
1. Features of the Traditional Databases and Hadoop ... 17
2. Project Timeline ... 40
3. Time Taken to Insert Records ... 41
4. Time Taken to Update Records ... 42
5. Time Taken to Delete Records ... 42
6. Summary of Survey Results ... 45
List of Figures
Figure Page
1. Ports and adapters architecture diagram of a DDD system ... 15
2. Big Data: Expanding on 3 fronts at an increasing rate ... 16
3. High-level overview of the structure of HDFS ... 19
4. Interaction between various components of YARN ... 20
5. The sprint cycle in Agile model of software development ... 24
6. Spring burndown chart ... 25
7. Scrum task board ... 26
8. Cost vs time graph for fixing defects at different development stages ... 27
9. Hadoop v2 architecture ... 30
10. System architecture to perform batch processing and support ad hoc analysis ... 31
11. Sample data stored in traditional database in the form of tables ... 34
12. Data stored in HDFS in JSON format ... 35
13.1 Data definition–general settings ... 36
13.2 Data definition–configurations ... 37
13.3 Data definition–schema definition ... 38
14. Ad hoc analysis ... 43
15. Real-time charts ... 43
Chapter I: INTRODUCTION Introduction
The primary goal of this project was to implement Hadoop eco systems to support the transition from legacy systems to Domain Driven Design (DDD) systems within the
organization. The intent of this project was to reduce the processing time to generate reports, reduce costs related to data storage and retrieval in the long term, and to implement ad hoc analysis to achieve detailed reporting. The project structure followed the “Agile” model of software development to achieve the goals of the projects over a course of multiple releases, in order to eventually migrate from the legacy systems to Domain Driven Design systems.
Domain Driven Design (DDD) refers to designing a Ubiquitous language in an explicitly bounded context. This basically means modeling a language specific to a
domain/problem area which has certain semantic boundaries that separates it from other out of context elements (Vernon, 2016). The amount of data generated throughout the process of migration and after successful migration to DDD systems, would be more than few thousand gigabytes and would require large storage space. The traditional databases in use by the company cannot store and process non-structured or semi-structured data efficiently, and are not scalable making it a high-cost endeavor to store this additional data.
Hadoop eco system offers a cost saving, linearly scalable and flexible environment (in terms of data types) for storing and processing huge data sets, with a capability to handle any rate of increase in volume of data sets. This eco system was implemented as a part of this
project to improve the processing times, reduce costs and provide a platform for ad hoc analysis.
Problem Statement
The migration from legacy systems to Domain Driven Design (DDD) systems taking place in the organization in order to support more use cases like data traceability,
accountability, integration, etc., will create large amounts of events (each event created by a single click by user), and result in large amounts of data to be stored and processed. Storing this huge amount of unstructured data in traditional DB2 databases, and processing it using the traditional ETL Tools, may increase costs and processing time, generate less detailed reporting with increased processing time for each section of data. This project was conceptualized to improve the process of data storage and processing with respect to scalability and stability, and support ad hoc analysis.
Nature and Significance of the Problem
Clean and processed data plays a crucial role for businesses as it facilitates in the decision making process regarding performance optimizing, marketing, launching new products etc. Currently, the organization this project was conducted at stores all its data in the relational databases and uses traditional ETL tools to extract and process the data. After the migration to DDD systems, the data created from the events caused by even a single click by a user needs to be stored and processed for better accountability and to track the different changes the data undergoes from the time it has been entered till the time reports were generated. The volume of such type of data keeps increasing with time (hundreds of terabytes), and requires quick processing to be useful for real-time analytics.
While traditional DB2 databases can handle megabytes/gigabytes of data efficiently, they are not built to store/process large terabytes/petabytes of data as quickly or efficiently. It may costs a fortune to set up the hardware required to store this huge amount of data that increases with time and is not stagnant. Moreover, the traditional ETL tools may take days to run the reports if not weeks, making it difficult to carry real-time data analytics. This project aimed to reduce the processing time and costs to process massive amounts of data, by implementing Hadoop eco systems.
Objective of the Project
The main objectives of the project was to identify the problems with the current traditional data storage and processing methods, and implement Hadoop to store/process the huge amounts of data to reduce the processing time and increase the possibility of performing ad-hoc analysis i.e. analyzing data on an as-needed basis.
Project Questions
After the successful completion of the project, the following questions should be sufficiently addressed:
1. What are the features of a Hadoop eco system that might seem appropriate to handle huge data sets?
2. How effective has the Hadoop implementation been in reducing the processing time?
3. What improvements were brought about to the core competencies of the organization by the implementation of the new platform?
Limitations of the Project
Even though the implementation of Hadoop platform improved processing times significantly and supported real-time analytics, certain limitations were identified over the course of the project.
The most significant hurdle in terms of project implementation was the use of open source Hadoop platform rather than a licensed version of Hadoop eco system. As Hadoop was being implemented for the first time in the organization it was decided that the open source Hadoop version be implemented which does not provide any consultation, which resulted in a lot of time being spent in trying to understand the architecture and working of the system which caused significant delays.
Another limitation was the use of commodity hardware clusters that were available in the company rather than cloud computing clusters. Mid-way through the project it was realized that there was a need to increase the number of clusters to facilitate better
performance, however due to the limited availability of commodity hardware in the company, the cluster size was not increased as investing in new hardware would require getting
approval for the additional funding which would further cause delays, this affected the performance of the new system.
Definition of Terms
Domain Driven Design (DDD): Domain-driven design (DDD) is an approach
to software development for complex needs by connecting the implementation to an evolving model.
Ad hoc Analysis: Ad hoc analysis is a business intelligence process designed to answer a single, specific business question. The product of ad hoc analysis is typically a statistical model, analytic report, or other type of data summary.
Big Data: Big data usually refers to the data sets that exceed the ability of traditional tools to manipulate them- typically, those in the high terabyte range and beyond.
Hadoop: Hadoop is an open source, Java-based programming framework that supports the processing and storage of extremely large data sets in a distributed computing environment. It is part of the Apache project sponsored by the Apache Software Foundation.
Hadoop Distributed File System (HDFS): The Hadoop Distributed File System (HDFS) is the primary storage system used by Hadoop applications. It provides high-performance access to data across Hadoop clusters. It breaks the information down into separate pieces and distributes them to different nodes in a cluster, allowing for parallel processing.
MapReduce: MapReduce is a programming model and an associated implementation for processing and generating large data sets with a parallel, distributed algorithm on a cluster.
Relational Database Management System (RDBMS): It is a type of database management system (DBMS) that stores data in the form of related tables. Relational databases are powerful because they require few assumptions about how data is related or how it will be extracted from the database. As a result, the same database can be viewed in many different ways.
Summary
This chapter provided a detailed analysis of the problem and its significance through the problem statement, and also outlined the intent and need for this project. The project questions stated in this chapter will be addressed throughout the course of this project to achieve the primary goals of the project. The definitions of terms that are used in this project help understand the project by providing the definitions in the context of the project. The next chapter will discuss in detail the literature of the problem and methodology employed for project execution.
Chapter II: BACKGROUND AND REVIEW OF LITERATURE Introduction
This chapter will provide a detailed description of background and literature related to the problem to get a better understanding of the project goals and objectives stated in the earlier chapter. This chapter will also provide literature related to the methodology followed, to justify its aptness for the execution of this project.
Background Related to the Problem
The organization this project was undertaken at is an international logistics company spread over a wide network of 331 locations across six continents. The services provided by this company include but are not limited to consolidation and forwarding of air or ocean freight, customs brokerage, time-definite transportation, cargo insurance, order management, warehousing, distribution and customized logical solutions. It is critical for a company of this stature to have optimized systems that relentlessly support critical functional areas within the organization, to deliver excellent services to the customers.
Domain Driven Design systems aim at improving the process of creating software that correctly models the business needs and performs at scale, making it ideal for the business of this stature, hence, leading to the migration from legacy systems to Domain Driven Design systems in the organization. The data (Big Data) generated by the events created by even a single user click in DDD systems needs to be stored and processed to allow for improved analysis of patterns, trends and behavior of consumers. The type of data created by events is often times semi-structured/non-structured data, and storage of this type of data is either not supported by the traditional databases or is expensive to do so.
The current system in use by the organization to store the data is traditional DB2 database, and “Informatica” is the ETL tool used to extract and process the data. The
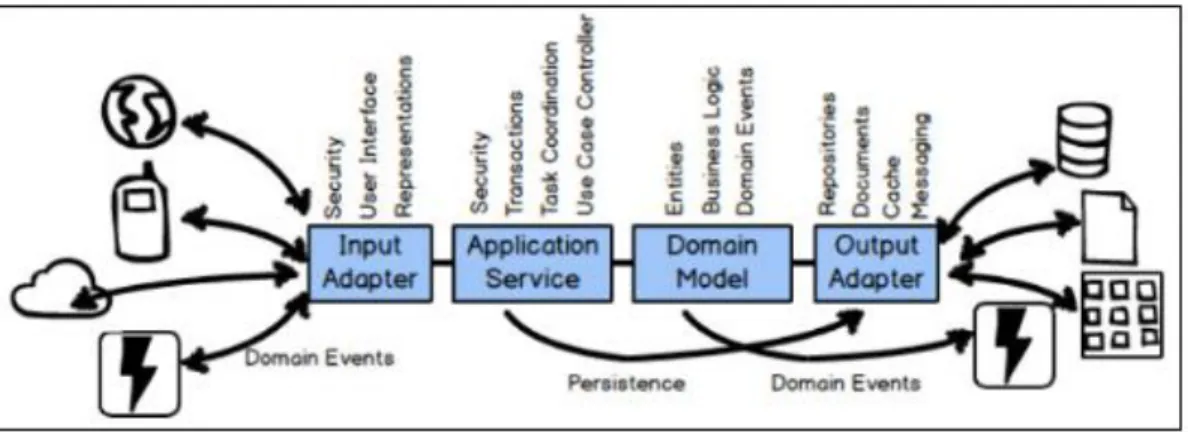
relational database lacks the functionality to efficiently store and process semi-structured/non-structured data making it difficult to perform required analysis quickly and efficiently, to support the strong architecture of DDD systems. Figure 1 (Vernon, 2016) illustrates the different layers of bounded context in a DDD system, using ports and adapters.
Figure 1. Ports and adapters architecture diagram of a DDD system. Literature Related to the Problem
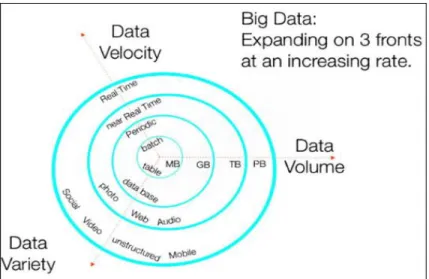
Big Data: Big Data refers to the huge sets of data that are difficult to manage with any traditional data tools as it does not adhere to just the volume of data but it also encompasses the velocity of increase and the variety of data in question (Frampton, 2014). The 3Vs that define the big data more appropriately are as follows:
a) Volume: Volume refers to the overall size of the data set.
b) Velocity: Velocity refers to the rate of arrival of data and the rate at which it needs to be processed.
c) Variety: Variety refers to the different formats in which the data arrives- audio, images, videos, web logs, sensor data, device data and many other types of data. Figure 2 (Frampton, 2014) illustrates the 3Vs that define Big Data.
Figure 2. Big Data: Expanding on 3 fronts at an increasing rate.
Hadoop: Hadoop is a platform that processes data using the functions of storage, retrieval and processing of data by combining database elements, integration tools and parallel coding environments. It differs from a traditional data base in that it stores data files (objects, records, etc.) across a collection of servers by making several copies of the data to recover any lost data, and the retrieval process is done without relating different data sets, and the data processing is performed through programs rather than SQL queries (Third Nature, 2014). Hadoop utilizes an interpreter “Hive” that compiles SQL into Hadoop jobs to run the queries, however, hive does not provide strong schema support, high level of concurrency or
interactive response times which are major requirements of a data warehouse to deliver traditional BI functions (Third Nature, 2014).
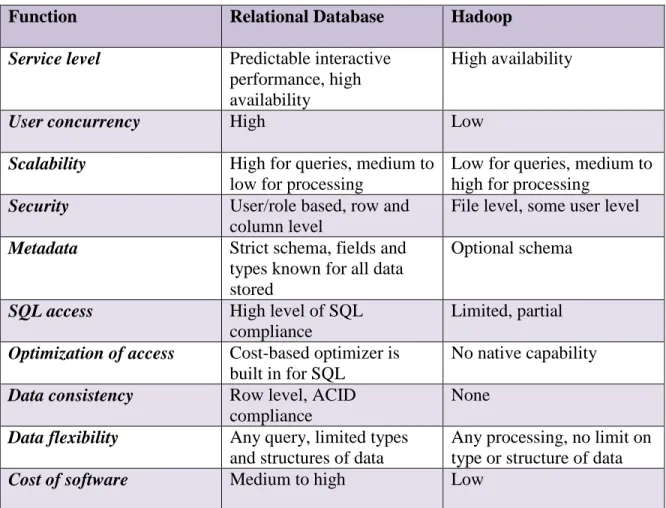
Table 1 (Third Nature, 2014) shows the different features of Hadoop and traditional relational database with respect to service level, security, metadata, SQL access and many other features.
Table 1
Features of the Traditional Databases and Hadoop
Function Relational Database Hadoop
Service level Predictable interactive performance, high availability
High availability
User concurrency High Low
Scalability High for queries, medium to low for processing
Low for queries, medium to high for processing
Security User/role based, row and column level
File level, some user level Metadata Strict schema, fields and
types known for all data stored
Optional schema
SQL access High level of SQL compliance
Limited, partial Optimization of access Cost-based optimizer is
built in for SQL
No native capability Data consistency Row level, ACID
compliance
None Data flexibility Any query, limited types
and structures of data
Any processing, no limit on type or structure of data
Cost of software Medium to high Low
Based on the features described in Table 1, it can be deduced that Hadoop may not be a suitable replacement for a database but can be used as an extension to perform batch
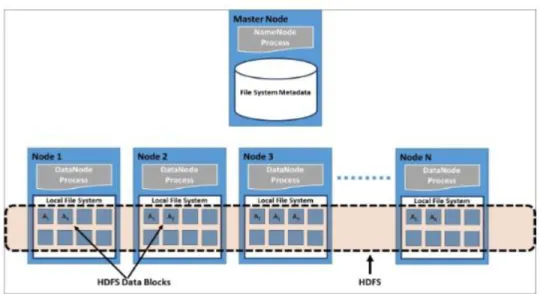
Hadoop Distributed File System (HDFS): HDFS is a distributed system that supports storage of massive amounts of data across multiple nodes providing throughput access to the data (Gunarathne, 2015). It allows for distribution of data blocks across all nodes of a cluster to facilitate parallel processing of data and ensures reliability by storing redundant copies of the data sets. HDFS is based on the following types of nodes that are inclusive to its structure.
a) Name Nodes: The name node stores the metadata of the file system without actually storing any real data blocks. The actual data is retrieved for processing by the applications by contacting the Name Node that directs to the actual location of the requested data. Name Node stores the information regarding the source path, name, number of data blocks, location of blocks, number of replicas and other metadata related to the configuration settings.
b) Data Nodes: The data node stores the actual data and is responsible for reading and writing data based on the client requests which can triggered only by Name Node. It performs various tasks of creating, replicating and deleting a block of data upon requests.
Figure 3. High-level overview of the structure of HDFS.
MapReduce: MapReduce is a framework used for processing massive amounts of data stored in HDFS. This model of programming consists of Map and Reduce functions, and each input record is received as a key-value pairs and outputs as key-value pairs. The
framework executes parallel computation by using divide and conquer methodology as each Map function is independent of the other. This also allows for re-executions or duplicate executions in case of failures or load imbalances without affecting the results. Hadoop MapReduce forms groups of key-value pairs in order to distribute them to reduce tasks in the shuffle phase of computation. The implementation of the Map and Reduce functions is done by the users, while Hadoop performs the scheduling and executes them in parallel, and will return failed tasks (if any) and provides mitigation measures for any unbalanced computations (Gunarathne, 2015).
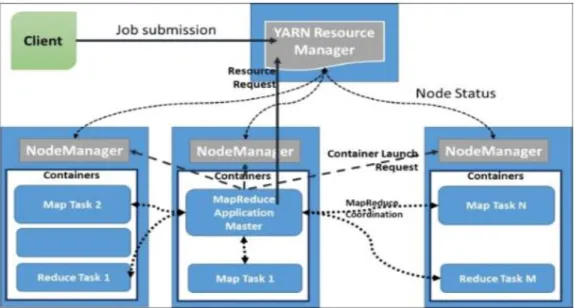
Hadoop YARN: YARN (Yet Another Resource Negotiator) is a management system introduced in Hadoop v2 that manages compute resources of a Hadoop cluster. It is
responsible allowing multiple distributed processing frameworks to effectively share the compute resources of a Hadoop cluster and utilize the data stored in HDFS. YARN supports the growth of number of distributed processing use cases including graph computations, iterative computations, real-time data computations and real-time data queries by allowing users to utilize multiple distributed application frameworks sharing a single cluster and the HDFS file system (Gunarathne, 2015). Figure 4 (Gunarathne, 2015) demonstrates the
interactions between various YARN components when a MapReduce application is submitted to the cluster.
Figure 4. Interaction between various components of YARN. Literature Related to the Methodology
The success of a software project depends on various factors including the leadership and capability of project managers, the level of skills of software developers, the available resources, complexity of problem domain, and most importantly the Software Development Life Cycle (SDLC) employed for the execution of the particular project (Öztürk, 2013).
Software Development Life Cycle is defined as a project management model that describes the sequence of stages involved in a software development project, from its inception through the maintenance of the developed application (Öztürk, 2013). There are numerous SDLC models with few variations in the execution of steps but follow a general model as follows (Lewallen, 2005).
a) Requirements: In this phase of development the stake holders and project
managers hold meetings to identify the functions to be performed by the system as a whole, including the working of the user interface.
b) Analysis: In this phase of development existing workflows and state of the system are analyzed for identifying the resources required to achieve the desired state.
c) Design: This phase of development focuses on the architecture of the system and produces the details of software design, hardware and software architecture, and communication to define the working of the system.
d) Coding: This phase tends to be the longest of all the phases as the actual code is produced here based on the design, and sometimes it may also overlap with the design and testing phases.
e) Testing: The code produced is tested in this phase against the requirements gathered in the first phase of development to make sure the product addresses all the needs.
f) Implementation: This is the final phase when the new system/product goes into production and is delivered to the client/business.
Agile SDLC model: The agile model is based on iterative development wherein requirements and solutions evolve through collaboration between self-organizing cross-functional teams. The agile model of development needs to adhere to the following four principles of the Agile Manifesto that values (Ambler & Holitza, 2012):
Individuals and interactions over processes and tools
Working software over comprehensive documentation
Customer collaboration over contract negotiation
Responding to change over following a plan
Agile model of development breaks down the requirements provided by the stake holders into small manageable chunks which are then ranked and worked on a priority order over short iterations (sprints) ranging from 1 to 4 weeks, reviewed and delivered to
production. Agile model of development is being used for a wide range of systems including web-based applications, mobile applications, business intelligence (BI) systems, and
embedded software (Ambler & Holitza, 2012). The major benefits of implementing agile model of development are improved quality, reduced risk, and responsiveness to change (Cockburn, 2001).
Types of Agile Methods: Agile model of development offers varied approaches of implementation that can be utilized based on the needs of situation/project. Some of the approaches of agile model include Scrum, XP (Extreme Programming), Lean Programming, Kanban, Agile modeling, and Unified Process (UP).
Scrum: Scrum approach of agile software development is the most common of all the approaches offered by agile model of development. The key practices associated with Scrum are discussed (Ambler & Holitza, 2012).
a) Release planning: At the beginning of each release, the product owner creates a release plan that contain a release schedule for a specific set of features. The requirements are gathered in the form of user stories which describe the product requirements in terms of what must be accomplished and for whom.
b) Sprint planning: This meeting is held at the beginning of each sprint (iteration) to identify the work to be completed in that respective sprint. Here the user stories are divided into developmental tasks and labor hours for each story are assigned.
c) Daily scrum planning: Each day begins with a stand up meeting that lasts from 5 to 15 minutes to plan the day’s work. In this phase the team works on the user stories to transform them into working features.
d) Sprint review meeting: This meeting is held at the end of each sprint cycle to review and demonstrate the work completed by the team during the sprint. The product owner decides if the deliverable produced meets the requirements and marks the user story as “accepted” or “rejected”.
e) Sprint retrospective: In this meeting all the team members including the
development team, stake holders, and product owner discuss the problems in the iteration and give inputs to improve the next iteration based on the experience of previous iteration.
Figure 5 (Lewallen, 2005) demonstrates the sprint cycle in an agile model of software development in detail.
Figure 5. The sprint cycle in Agile model of software development.
Performance metrics for agile model: There are several metrics that can be employed to effectively implement the agile model of development:
1. Sprint Burndown: The number of story points completed can be tracked using a sprint burndown chart, to monitor the iterations, releases, and project backlog. Burndown reports demonstrate the progress in terms of value delivered (number of points) and the team’s velocity (capability of team to deliver certain number of points). Figure 6 (Ambler & Holitza, 2012) demonstrates a project burndown report that shows the number of points burned in each iteration.
Figure 6. Sprint burndown chart.
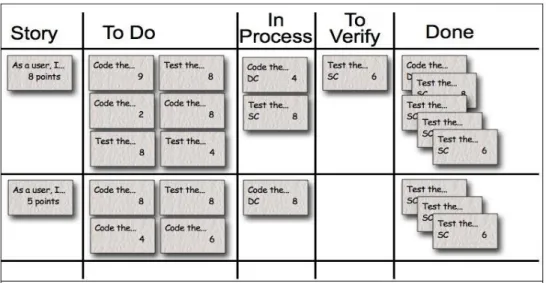
2. Scrum Task Board: A scrum task board is a physical board that displays the user stories taken up in the current sprint backlog along with their tasks. The tasks are written on index cards or post-it notes. It has columns starting from user story and the last column on the board is ‘done’ which reflects the status of the story as complete. As sprint progresses the post it notes move from left to right on the board, which helps track the progress of the team. Figure 7 (Cockburn, 2001) shows a sample task board for a sprint.
Figure 7. Scrum task board.
Software Testing: Testing plays a very crucial role in any development project as it verifies and validates that the application meets all the specified business, technical
requirements, and functional requirements. Testing is not just a single activity but a process that is carried out throughout the SDLC. Testing is done in almost all phases of the
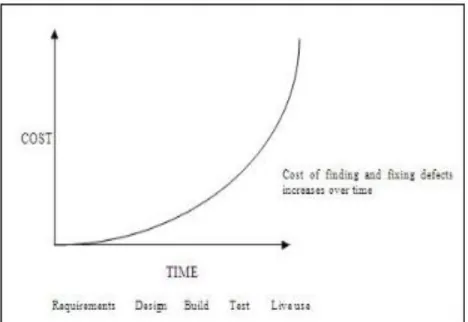
development cycle to find and fix bugs as early as possible, as the longer it takes to find a bug the costlier it gets to fix it. Figure 8 demonstrates the graph of cost vs time for finding and fixing defects in different stages of development.
Figure 8. Cost vs time graph for fixing defects at different development stages.
Types of testing: Based on the objectives, testing can be broadly classified as follows: 1. Functional Testing: Functional testing is done to test the functions of system or
code to answer questions like “can the user do this?” or “does this particular feature work?” This basically tests the business and functional requirements. 2. Non-functional Testing: Non-functional testing the quality aspects of the system or
component is tested, like scalability or security. It tends to answer questions like “how many user can log in at once?”
3. Structural Testing: Also referred to as white box or glass box testing, this type of testing is done to verify the internal working of the system or application. This type of testing is used at all levels of testing including component and component integration testing.
4. Maintenance Testing: Maintenance testing is done after the system is deployed and is in service. It is done to test the changes made over time and regression tests are performed to check if the rest of the system is not affected by the change.
Summary
This chapter provided a detailed background related to the problem and discussed the literature related to the problem to offer a deep understanding of the project. This was
followed by the detailed discussion related to the methodology adopted for the execution of this project. The next chapter will further elaborate on the methodology by discussing the design of the study, data collection and analysis tools. It will also provide an insight into other project details like budget and timeline.
Chapter III: METHODOLOGY Introduction
This chapter provides various details related to the methodology adopted for the execution of this project, and discusses in detail the data collection methods, and tools employed for data analysis. It also discusses the project timeline and budget associated with the project.
Design of the Study
The design of study selected for this project was quantitative approach. This approach was apt for the project as it is based on performance of a specific method of data storage and processing that can be analyzed based on the data collected by the performance metrics.
Hadoop framework was used to process and store this massive amount of data collected as a result of single click user events created each time the customer clicked anywhere on the website. The data collected included each minute detail from the browser used to browse the website, to the IP address of the system the request was sent to the server from. Each time a user clicked on the web page an event was created that had all the
information including the time, date, IP address, etc. This was just one type of data that was being collected, there were many other types of data including images, audios and videos that needed to be stored and processed as well. With each passing day, the data keeps increasing at exponential rate, and Hadoop supported data processing for large data sets of varied types.
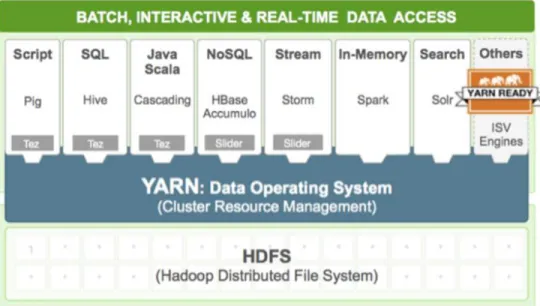
Hadoop v2 was implemented for this project as it had many new features that were missing in the previous version of Hadoop. The addition of YARN in Hadoop v2 opened up possibilities of real-time data access that support ad-hoc analysis, which is great for business
value. The addition of YARN to Hadoop has improved security and provided data governance tools across Hadoop clusters, making it possible for taking advantage of cost effective, linear-scale storage and processing of data as shown in Figure 9 (Horton Works, n.d.).
Figure 9. Hadoop v2 architecture.
Ad hoc analysis is supported by Hadoop eco system to get perform real-time analytics using Hive. The events generated by user interactions on the web page or web application are saved on web servers. This data is transferred over to Hadoop clusters in real-time by using transport systems like Apache Flume/Apache Kafka. For batch processing purposes the data is written on HDFS whereas for real-time processing the data is fed into a processing system like Apache Storm/Spark. MapReduce is used to cleanse the log data (perform
transformations) and periodically analyze the logs. The real-time aggregates are stored in HBase which can be used to create real-time dashboards. Finally, the reporting tools available can be used to access the results and perform exploratory analysis, making ad hoc analysis a
possibility. Figure 10 (Motgi, 2015) demonstrates the system architecture to perform batch processing, real-time insights and performing ad hoc analysis.
Figure 10. System architecture to perform batch processing and support ad hoc analysis. The structure of the project implemented the agile model of development. This model of development was an opt choice for this project as agile model supports new technology/ process implementation well, since very limited planning is required at the beginning of the project unlike other traditional models of development. The team including the stakeholders and product owners will be able to review the products with every new implementation at the end of each sprint and can suggest any changes if needed which will be implemented quickly rather than waiting for the end product, thereby saving time and costs associated with making changes at later stages of development. The detailed structure of the project design is outlined as follows:
The project team consisted of a project manager acting as a scrum master to ensure the team followed agile principles of development, a product owner who represented the
stakeholders and was responsible for providing requirements and taking critical decisions regarding keeping/discarding features based on the demos, an analysis team, a development team and a testing team.
Based on the requirements, the project was load was divided into small manageable chunks dedicated to each sprint (iteration) that lasted from 3 to 8 weeks depending on the work load and complexity of tasks. For a 3 week sprint (15 working days), development team was allotted 9 days and 6 days were allotted for testing, and for a 4 week sprint (20 working days), the development team was allotted 12 days and testing had to be completed in 8 days. Each sprint followed the cycle of gathering and breaking down requirements, developing, testing and product demo.
Requirements: In each iteration requirements were captured in the form of user stories which were simple descriptive pieces of requirements stating clearly what should be accomplished by the requirement and for whom in just few statements. The user story also contained the validation steps to ensure the correctness of the requirement. The user story/stories were broken down into smaller tasks for respective sprints and assigned to the team members for development.
Developing: In each iteration the development team began coding once the tasks were assigned and converted the requirements into actual working application. Unit tests were performed by developers itself to ensure the code written by them provided the expected functionality and forwarded it to the testing team.
Testing: In each iteration the testing team then proceeded to test the code at all levels after the developers forwarded the code after performing unit tests. The code was tested over
functional, non-functional and structural requirements for acceptance to ensure the code was bug free, integrated well with prior software application and delivered the desired
functionality.
User Demo: After the code was tested successfully, the team gave a demo to the product owner at the end of each iteration. The product owner then reviewed the application, and according to the capability of the application either accepted, or requested changes in the application or discarded the application altogether.
Data Collection
Data collection is an important activity that aids in evaluating the success of a project, and validating that the project objectives have been achieved in their entirety. The data collection for this project involved gathering volumes of rows of data from both traditional database and Hadoop eco system to compare the time required by both the data storage systems for processing.
Feedback surveys (see Appendix A) were distributed to the various departments to determine the level of satisfaction of performance of the newly implemented Hadoop framework, as a part of the data collection.
The samples of data volumes collected from the traditional database and the Hadoop eco system are shown in Figure 11 and Figure 12, respectively.
Figure 11. Sample data stored in traditional database in the form of tables.
The traditional database stores data in form of tables that have a strict schema and has many constraints. Hadoop provides the flexibility to store the data without adhering to any strict schema that limits the possibility of storing all types of data. As shown in Figure 12 the data stored in HDFS is stored in JSON format.
Figure 12. Data stored in HDFS in JSON format.
The next step was to validate the possibility of performing ad hoc analysis on the data that was transformed on stored on Hadoop clusters. Figures 13.1, 13.2 and 13.3 demonstrate the data definition configurations that were done to perform simple ad hoc analysis on the Hive platform. These configurations were done to store the results of the ad hoc queries that were run against the data that was stored in any file format on the Hadoop clusters.
Figure 13.3. Data definition–schema definition. Data Analysis
The data that was collected was analyzed by comparing the time taken to process same amount of data on both the platforms when inserting, updating and deleting rows of data from the traditional database and the Hadoop data lake. The time lapse was recorded for inserting, updating and deleting 10, 100, 1000, 10000, 100000, 1000000 and 10000000 records in both the data storage platforms, to gauge the performance of the systems in place.
The next step in data analysis was to perform ad hoc analysis using the JReport reporting tool that provides various capabilities to view ad hoc reports and analyze them easily. This step validated the capability of Hadoop eco system to support ad hoc analysis and real-time insights.
The final step of data analysis was to perform an objective analysis of the assessment surveys results that were obtained to gauge the satisfaction level of the business units that were effected with the implementation of the project, which serves as an important metric for measuring the success of the project.
Budget
Hadoop is an open source platform so there was no cost associated with it on the software front. Also, it works on commodity hardware so the systems that were not in use in the organization were used for the implementation of Hadoop without any extra cost. The only costs associated with this project were the labor costs that were covered by the organization.
Timeline
Table 2
Project Timeline
Task Name Start Finish Duration
Project kick-off 02/03/2016 02/16/2016 10 days
Problem Investigation 02/17/2016 03/02/2016 12 days Technical Documentation 03/03/2016 03/23/2016 15 days
POC and Approval 03/24/2016 04/08/2016 12 days
Requirements gathering and breakdown into sprints
04/11/2016 04/15/2016 5 days Design, Development, Testing
and deployment of
deliverables/features (Sprints)
04/18/2016 09/23/2016 115 days
Data Collection and Analysis 09/26/2016 10/03/2016 6 days Draft Capstone Final Project
Report
10/04/2016 10/25/2016 16 days
Project Defense 11/16/2016 11/16/2016 1 day
Summary
This chapter gave a detailed description of the methodology implemented in this project, and described the data collection and analysis tools employed in the project. This chapter also discussed the details related to the project budget and timeline proposed to complete the project. The next chapter will focus on the analysis of the data collected as part of this project to deduce results to address the project questions that were raised in the beginning of the project.
Chapter IV: DATA PRESENTATION AND ANALYSIS Introduction
This chapter will provide a structured presentation of the data collected throughout the course of the project and analysis of the collected data to provide reasonable answers to the project questions.
Data Presentation
The volumes of data collected from both the platforms, traditional database and HDFS on the completion of the project was processed in order to record the time taken by both the platforms to process the sane volume of data. Table 3 provides the details of processing time for inserting the records, Table 4 provides the details of processing time for updating the records, and Table 5 provides the details of processing time for deleting the records in both the platforms.
Table 3
Time Taken to Insert Records
No. of Records Traditional Database
(Time in milliseconds) HDFS (Time in milliseconds) 10 29 12 100 43 60 1000 1534 39 10000 8902 65 100000 79786 390 1000000 874308 679 10000000 7890876 5689 100000000 87689654 54378
Table 4
Time Taken to Update Records
No. of Records Traditional Database (Time in milliseconds) HDFS (Time in milliseconds) 10 432 1 100 48 1 1000 48 1 10000 82 1 100000 1245 1 1000000 32456 2 10000000 312908 4 100000000 34567899 50 Table 5
Time Taken to Delete Records
No. of Records Traditional Database (Time in milliseconds) HDFS (Time in milliseconds) 10 102 1 100 43 1 1000 54 1 10000 87 1 100000 1435 1 1000000 35678 1 10000000 328908 3 100000000 3890765 10
The next set of data was collected from the newly implemented Hadoop platform and Hive was configured to perform the ad hoc analysis and real-time insights using JReport tool.
Figure 14 demonstrates the ad hoc analysis performed on the data stored in the system. Figure 15 shows the real-time charts created using JReport on the data stored in the system.
Figure 14. Ad hoc analysis.
Figure 16 demonstrates the real-time insights on the JReport dashboard that gets updated live as the data is entered into the system.
Figure 16. Real-time insights.
The feedback survey was circulated post deployment to all the business units that were impacted, and participants had to rate five statements on a 5 point scale ranging from strongly agree to strongly disagree. The statements that were presented in the survey are as follows:
1. “Data processing time has reduced significantly with the implementation of Hadoop eco system.”
2. “Hadoop is a cost effective storage solution for exploding data sets.”
3. “Hadoop is able to handle large data sets safely and has high fault tolerance.” 4. “The changes made with the introduction of Hadoop were easy to adapt.”
5. “Hadoop supports processing real-time insights and ad hoc analysis very efficiently.”
The total number of responses that were received were 12 and the summary of responses is provided in Table 6.
Table 6
Summary of Survey Results
Question 1 Question 2 Question 3 Question 4 Question 5
Strongly Agree Strongly Agree Strongly Agree Agree Disagree Strongly Agree Agree Agree Neutral Neutral Agree Agree Agree Agree Agree Agree Agree Agree Neutral Disagree
Strongly Agree Strongly Agree Agree Neutral Strongly Disagree Neutral Neutral Neutral Neutral Neutral
Strongly Agree Strongly Agree Agree Strongly Agree Neutral Disagree Disagree Disagree Disagree Disagree Agree Agree Agree Agree Neutral Agree Strongly Agree Agree Agree Agree
Neutral Neutral Agree Agree Strongly Agree Disagree Strongly Agree Agree Strongly Agree Neutral
Data Analysis
Comparison of Processing Times: Based on the values of time taken in milliseconds to process the same amount of data on both the platforms the following observations can be made:
1. The processing time taken by the traditional database to insert 100000000 records was close to 24.35 hours whereas the same amount of data was inserted into the new system in 54.37 seconds.
2. The processing time for updating 100000000 records in the traditional database was 9.6 hours whereas for the same data load the new system processing time was recorded to be 50 milliseconds.
3. The processing time to delete 100000000 records from the traditional database was 1 hour, whereas the new system deleted the same data load in 10 milliseconds. Ad hoc analysis: The ad hoc reports were efficiently produced by using the JReport on the new system that supported real-insights.
User Satisfaction Analysis: The following Table 7 provides a summary of the responses received for the feedback survey that was circulated post-deployment.
Table 7
Survey Response Sheet
“Data processing time has reduced significantly with the implementation of Hadoop eco system.” “Hadoop is a cost effective storage solution for exploding data sets.” “Hadoop is able to handle large data sets safely and has high fault tolerance.”
“The changes made with the introduction of Hadoop were easy to adapt.” “Hadoop supports processing real-time insights and ad hoc analysis very efficiently.” Strongly Agree 33.3% 41.7% 8.3% 16.7% 8.3% Agree 33.3% 33.3% 75% 41.7% 16.7% Neutral 16.7% 16.7% 8.3% 33.3% 41.7% Disagree 16.7% 8.3% 8.3% 8.3% 25% Strongly Disagree 0% 0% 0% 0% 8.3%
Based on the results of the survey obtained the following observations can be made: 1. 67% of the respondents either agree or strongly agree that the implementation of
Hadoop eco system has significantly reduced the data processing time. 2. 75% of the respondents either agree or strongly agree that Hadoop is a cost
effective solution for large data sets.
3. 83% of the respondents either agree or strongly agree that Hadoop handles large data sets safely and has possesses high fault tolerance.
4. 59% of the respondents either agree or strongly agree that the changes with the implementation were easy to adapt.
5. 33% of the respondents either disagree or strongly disagree that the Hadoop platform supports ad hoc analysis and real-time insights efficiently.
Summary
This chapter covered details of the data collected as a part of this project and described the data analysis techniques employed to analyze the collected data in detail. The next chapter will discuss further on the outcome of the project and conclusions derived from the results and will also provide recommendations based on the experience of conducting this project for similar projects to be conducted in future.
Chapter V: RESULTS, CONCLUSION, AND RECOMMENDATIONS Introduction
This chapter discusses the results obtained by the analysis of the data collected at the end of this project and concludes the findings of the project by addressing the project
questions raised at the beginning of the project. The report is concluded with
recommendations for future projects on similar subjects based on the lessons learned throughout the project.
Results
This project was conceptualized to implement Hadoop, a framework designed to store, and process large amounts of data in batches, to help facilitate ad hoc analysis and real-time analytics on the data. The overall methodology utilized for execution of this project was based on the agile model of development that follows an incremental and iterative approach to deliver the requirements in short-timed cycles also known as sprints. In this approach of software development, all the phases of development are performed repeatedly in each sprint to deliver a feature of the application at the end of each sprint. For instance in each sprint, the requirements gathering, development, testing and product demo are performed to deliver a working application at the end of each iteration.
The following results were obtained from the study of this project:
1. The comparison of data processing times for same loads on both the traditional database and Hadoop platform show that the processing time for Hadoop is significantly low for huge data loads when compared to the processing time of the traditional database.
2. The ad hoc reports and real-time insights showed the possibility of performing real-time analytics which boosts the decision making process.
3. The responses obtained through the feedback show that the majority of the stakeholders were satisfied with the performance of the new Hadoop data storage and processing platform.
The questions that were raised at the beginning of the project can be answered as follows:
1. What are the features of a Hadoop eco system that might seem appropriate to handle huge data sets?
Hadoop eco system offers many features that are not offered by traditional data bases described below:
Low costs for storing and retrieving data as it utilizes commodity hardware
unlike the expensive relational databases.
It also offers high scalability and enables flexible storage in terms of allowing
many types of data formats for storage unlike relational databases that function with a limited set of data types.
It also provides scalable parallel processing over multiple types of data,
without any limitations of SQL, and caters to all structures or formats of data.
The addition of YARN to Hadoop has improved the performance in terms of
speed and allow real-time analysis and ad hoc analysis.
2. How effective has the Hadoop implementation been in reducing the processing time?
The time for batch processing has reduced significantly with the implementation of Hadoop when compared to a traditional database. The processing time for
inserting records of same load has reduced from taking a few hours in the traditional database to a few seconds in Hadoop.
3. What improvements were brought about to the core competencies of the organization by the implementation of the new platform?
The implementation of a faster data processing platform that supports ad hoc analysis and provides the ability to perform real-time analytics will have a great impact on the core competencies of any organization. The decision making process tends to be quicker and based on the present data, increasing the chances of taking risk free decisions. This is bound to aid in providing excellent service to the consumers and expand the consumer base rapidly by customizing services based on the preference of the customer, which can be directly correlated to the core competencies of the organization.
Conclusion
The importance of data cannot be emphasized enough in this digital world where every second millions of bytes of data is generated all over the world in the form of messages, emails, tweets, audios, videos, images, etc. There is no limit to the possibilities of providing solutions to the inherent problems, if the data is processed properly and quickly. The
data that was generated by events that were created by a single user click on the webpage, and this data kept increasing with time making it expensive to store on the traditional databases, as they require high-end hardware and processors to perform data processing. This project was implemented to provide cost effective solution to store and process data using commodity hardware by implementation of Hadoop eco system.
Agile model of software development was adopted to execute the project and based on the results obtained it can be deduced that the problems associated with the storing and
processing of large data sets were reduced, and a platform to perform ad hoc analysis was provided by the implementation of the new system.
Recommendations
Based on the results obtained from the project, following is a list of recommendations to improve the execution of similar projects in future:
1. Though Hadoop is an open source platform it is recommended to get a licensed version eco system as it offers built-in tools to move the existing data from the database to the Hadoop clusters without the need of manually moving it. It will save a lot of time and resources required to understand all the complexities involved in both the systems which will prove cost-effective in the long run. 2. It is also recommended to opt for cloud computing clusters like AWS EMR or
EC2, or any other cloud computing clusters offered by 3rd party vendors as it is a cheaper alternative to buying new hardware when the cluster size needs to be increased. It is especially recommended for a POC project as it reduces the risks associated in buying new hardware in case of project failure.
References
Ambler, S. W., & Holitza, M. (2012). Agile for dummies (IBM ltd. ed.). Hoboken, NJ: John Wiley & Sons, Inc.
Cockburn, A. (2001). Agile software development. Boston, MA: Addison-Wesley.
Frampton, M. (2014). Big data made easy: A working guide to the complete Hadoop toolset.
New York, NY: Apress.
Gunarathne, T. (2015). Hadoop MapReduce v2 Cookbook (2nd ed.). Birmingham: Packt Publishing.
Horton Works. (n.d.). Apache Hadoop yarn. Retrieved from http://hortonworks. com/apache/yarn/.
Lewallen, R. (2005). Software development life cycle models. (2012, 3). Retrieved
from Codebetter.com: http://codebetter.com/raymondlewallen/2005/07/13/ software-development-life-cycle-models/.
Motgi, N. (2015). Web analytics on Apache Hadoop. [Web log post]. Retrieved from http://blog.cask.co/2015/04/weblog-analytics-on-apache-hadoop/.
Öztürk, V. (2013). Selection of appropriate software development life cycle using fuzzy logic. Journal of Intelligent & Fuzzy Systems, 25(3), 797-810.
Third Nature. (2014). Hadoop and the data warehouse: Competitive or complementary?
[White paper]. Retrieved from http://www.teradata.com/ Resources/White-Papers/Hadoop-and-the-Data-Warehouse-Competitive-or-Complementary/. Vernon, V. (2016). Domain-driven design distilled. Boston, MA: Addison-Wesley
Appendix: Customer Satisfaction Survey Questionnaire User Satisfaction Survey
“Data processing time has reduced significantly with the implementation of Hadoop eco system.” o Strongly Agree o Agree o Neutral o Disagree o Strongly Disagree
“Hadoop is a cost effective storage solution for exploding data sets.”
o Strongly Agree
o Agree
o Neutral
o Disagree
o Strongly Disagree
“Hadoop is able to handle large data sets safely and has high fault tolerance.”
o Strongly Agree
o Agree
o Neutral
o Disagree
“The changes made with the introduction of Hadoop were easy to adapt.” o Strongly Agree o Agree o Neutral o Disagree o Strongly Disagree
“Hadoop supports processing real-time insights and ad hoc analysis very efficiently.”
o Strongly Agree o Agree o Neutral o Disagree o Strongly Disagree SUBMIT Google Forms