1
A multi-view approach to cDNA micro-array analysis
Bachar Zineddin, Zidong Wang*, Yong Shi, Yurong Li, Min Du and Xiaohui Liu *E-mail: [email protected]
Abstract: Microarray has emerged as a powerful technology that enables biologists to study thousands of genes simultaneously, therefore, to obtain a better understanding of the gene interaction and regulation mechanisms. This paper is concerned with improving the processes involved in the analysis of microarray image data. The main focus is to clarify an image’s feature space in an unsupervised manner. In this paper, the Image Transformation Engine (ITE), combined with different filters, is investigated. The proposed methods are applied to a set of real-world cDNA images. The MatCNN toolbox is used during the segmentation process. Quantitative comparisons between different filters are carried out. It is shown that the CLD filter is the best one to be applied with the ITE.
Keywords: micro-array image processing; ITE; image transformation engine; median filter; top-hat filter; linear complex diffusion; adaptive segmentation; computational biology; drug design.
Reference to this paper should be made as follows: Zineddin, B., Wang, Z., Shi, Y., Li, Y., Du, M. and Liu, X. (2010) ‘A multi-view approach to cDNA micro-array analysis’, Int. J. Computational Biology and Drug Design, Vol. 3, No. 2, pp.91–111.
Biographical notes: Bachar Zineddin received his BSc Degree in Computer Engineering in 2000 from Aleppo University, Aleppo, Syria, and the Mres. degree in Information System and Computing in 2006 from Brunel University, West London, UK, he has been pursuing a PhD Degree in Information System Computing at the Centre for Intelligent Data Analysis (CIDA), School of Information Systems, Computing and Mathematics, Brunel University, West London, UK, since October 2006. His research interests include neural networks, intelligent data analysis, and bioinformatics.
Zidong Wang received his BSc Degree in Mathematics in 1986 from Suzhou University, Suzhou, China; his MSc Degree in Applied Mathematics in 1990 and his PhD degree in Electrical and Computer Engineering in 1994, both from Nanjing University of Science and Technology, Nanjing, China. Currently, he is a Professor of Dynamical Systems and Computing at Brunel University in the UK. His research interests include dynamical systems, signal processing, bioinformatics, control theory and applications. He has published more than 120 papers in refereed international journals. He is currently serving as an Associate Editor for 12 international journals. Yong Shi received his PhD Degree in Management Science from the University of Kansas, USA. He is a Professor at the University of Nebraska, USA. He is also an Executive Deputy Director of the Chinese Academy of FEDS Center. His research interests include data mining, intelligence knowledge managements, optimisation theory and method, and multiple criteria linear programming decision systems, etc. Yurong Li received her Master’s Degree in Industry Automation and PhD in Control Theory and Control Engineering from Zhejiang University in 1997 and 2001,
2 respectively. She is an Assistant Professor at Fuzhou University. Since 2007, she has been a member of the Fujian Key Laboratory of Medical Instrumentation and Pharmaceutical Technology. Her research interests include biomedical instruments and intelligent information processing.
Min Du received her PhD in Electrical Engineering from Fuzhou University in 2005. She is a Professor and Doctorial Supervisor at Fuzhou University. Since 2007, she has been the Associate Director of the Fujian Key Laboratory of Medical Instrumentation and Pharmaceutical Technology. Her research interests include smart instruments and photoelectrical systems.
Xiaohui Liu is Professor of Computing at Brunel University in the UK where he directs the Centre for Intelligent Data Analysis, conducting interdisciplinary research concerned with the effective analysis of data. He is a Chartered Engineer, Life Member of the Association for the Advancement of Artificial Intelligence, Fellow of the Royal Statistical Society, and Charted Fellow of the British Computer Society.
1. Introduction
DNA micro-array technology has enabled biologists to study all the genes within an entire organism to obtain a global view of the interaction and regulation of genes. This technology has great potential to obtain a deep understanding of the functional organisation of cells. Yet, it is still early in its developmental stages and needs improvements in all the main stages of the micro-array process. The emergence of this technology allows researchers to tackle difficult problems and reveal promising solutions in many fields, i.e., pharmaceutical industry (Cohen, 2005), because they allow researchers to study the genes’ functions in tissues that are subjected to a medication being tested. Moreover, drug companies are often interested in altering some protein to prevent faulty gene behaviour from causing a disease.
DNA micro-array is a remarkably successful high throughput technology for functional genomics (Schena et al., 1995; Shalon et al., 1996). Micro-arrays allow researchers to analyse the expression level, in different cell types or conditions, of many thousands of genes in a single experiment (Alizadeh et al., 2000; Moore 2001). Basically, a DNA array (Stekel, 2003) can be defined as an orderly arrangement of tens to hundreds of thousands of unique DNA probes of known sequence. The source of the probes takes either of the two cases:
• each probe is individually synthesised on a surface such as glass
• pre-synthesised probes (such as PCR products) are attached to the array platform. The cDNA micro-array aims to detect the abundance of various mRNA molecules of a cell by using hybridisation (bind) of the fluorescent labelled samples to the DNA probes already existing on the array platform (Schena et al., 1995), which can provide information about the related protein (the expressed gene) (Gygi et al., 1999). The end product of a cDNA micro-array experiment is a scanned array image, see Figure 1, (Moore, 2001; Orengo et al., 2003). These images must then be analysed to identify the arrayed spots and to measure the relative fluorescence intensities for each feature. Although micro-array technology has been engineered to fine tolerances, there exists high signal variability through the surface of the micro-array image. Due to system
3 imperfections in the micro-array image generation process, the resulting images, in addition to background fluorescence, are contaminated by various types of noise, biological and systematic (Fraser et al., 2010; Zineddin et al., 2008). Simply using the raw image to identify gene spots could be inefficient. Pre-processing stages, therefore, should be introduced to produce multiple views of the image to get better performance from all the processing steps in terms of reproducibility and validity in computing gene expression levels (Yang et al., 2002; Blekas et al., 2003).
Figure 1 Two-channel cDNA image sample
Through the development of micro-array technology, many methods have been proposed to reduce the noise source; these include the use of clean glass slides and a higher laser power rather than a higher PMT voltage. However, these methods seem inadequate for the required image qualities and an enhanced software procedure embedded within the process is a much better alternative. Recently, Moghadam and Moradi (2007) proposed an algorithm for image sifting to remove objects with definite size from macro-array images. Daskalakis et al. (2007) applied unsupervised discrimination between spot and background pixels to spot image in order to assess the local noise, and then conducted adjustable wiener restoration by using an empirically determine degradation function. Although these studies emphasised superior quality of the enhanced images, there has been little investigation into whether these enhancements could lead to more accurate spot segmentation or further reduce the variability of the extracted gene expression levels.
Feature detection in cDNA micro-array image analysis is the process that categorises the pixels in the image into spots or background pixels by using either manual, semi-automated geometric techniques or complex methods that are computationally expensive (Lukac et al., 2004). It should be pointed out that the large number of spots (usually in thousands) as well as the shape and position irregularities (Lukac et al., 2005; Wang et al., 2003a) can propagate processing errors through subsequent analysis steps (Eisen and Brown, 1999; Lukac et al., 2004; Wang et al., 2003b). Furthermore, the time-consuming manual processing of the micro-arrays has led to the recent interest in using a fully automated procedure to accomplish the task (Bajcsy, 2004; Jain et al., 2002, Katzer et al., 2003). Although recognition of spots in either control or experimental channels seems to be straightforward, the task is indeed complicated and challenging.
In terms of feature detection for cDNA micro-array image processing, Bozinov and Rahnenfuhrer (2002) proposed processing of the full image area in one step, but this might not be computationally feasible with the current processing power. To overcome such a computational issue, an abstraction of the k-means clustering
4 technique was proposed in Bozinov (2003). Other methods such as the applications of wavelets (Wang et al., 2003b) and Markov random fields (Katzer et al., 2003) showed great promise. Lawrence et al. (2003) presented a Bayesian approach to processing images produced by these arrays that seeks posterior distributions over the size and positions of the spots. Blekas et al. proposed a micro-array image analysis framework in Blekas et al. (2003) that provided a method automatically addressing each spot area in the image. More recently, Fraser et al. (2004) presented a Copasetic analysis framework that attempts to improve the full workflow processing of micro-array image analysis employing traditional clustering techniques. Blekas et al. (2005) exploited the Gaussian Mixture Model (GMM) to analyse individual spot images, and Lukac et al. (2004) utilised the multi-channel nature of the cDNA image data. In particular, Arena et al. (2002) showed the promising application of Cellular Neural Networks (CNNs) for analysing cDNA micro-array images, where CNNs’ parallelism characteristic makes them an ideal computational platform for kernel-based algorithms and image processing (Chua, 1997).
Since their introduction in 1988 (Chua and Yang, 1988a, 1988b), CNNs have been applied in numerous applications. In particular, the acceptance of the CNN approach as a computational paradigm (Chua and Roska, 1993), and the design of the hardware architecture, the CNN Universal Machine (CNN-UM) (Chua and Roska 1992), resulted in complex image analysis applications. The CNN-UM is the first parallel, stored program analogic and visual array micro-processor that can be fabricated on a single chip (Cruz and Chua 1998; Dominguez-Castro et al., 1994, 1997; Linan et al., 2003). These devices are programmed by analogic algorithms (Csapodi and Roska 1996; Rekeczky et al., 1995, 1999; Rekeczky and Chua 1999; Zarandy et al., 1996), i.e., using analogue operations in sequence combined with local logic at the cell level. To summarise the discussions made so far, we have the following conclusions:
• Image processing for analysis of micro-array images is an important yet challenging problem since imperfections and fabrication artefacts often spoil our ability to accurately measure the parameters of interest in the images.
• Rather than using the raw micro-array image, it makes much more sense to produce multiple views of the image data so that emphasis can be placed on certain frequencies or regions of interest.
• Although many approaches have been proposed in the literature, there has been little progress on developing efficient and effective algorithms to, automatically, clarify an image’s feature space by using up-to-date techniques such as Image Transformation Engine (ITE) (Zineddin et al., 2008; Fraser et al., 2010), filtering and CNNs.
It is, therefore, the aim of this paper to investigate the multi-view analysis by implementing filtering techniques to micro-array images to reduce the artefacts’ noise and, at the same time, enhance the position of gene spots.
In this paper, the focus is on several efficient and effective algorithms that have been proposed to automatically clarify the micro-array image’s features by using up-to-date techniques such as ITE, filtering and CNN, and the best filter has been found to be applied with the ITE by quantitative comparisons among different filters in terms of the Peak Signal-to-Noise Ratio (PSNR). The ITE, combined with Median, Top-hat and Complex Diffusion (CLD) filters is investigated. The proposed image processing methods are applied to a set of real-world cDNA images. It is shown that the CLD filter is the best one to be applied with the ITE. In particular, a fully automated
5 segmentation algorithm, based on the CNNs (Chua and Yang, 1988a, 1988b), is implemented in this paper as an integrated part of the proposed framework. The proposed algorithms, which can be applied on CNN-UM (Chua and Roska, 1992), offer a view of parallel computation, which remains reasonably efficient even when applied on Graphics Processing Unit (GPU) simulators (Dolan and DeSouza, 2009; Ho et al., 2008; Soos et al., 2008).
2. Background
In this section, a brief introduction of the cDNA micro-array technology is presented. The illustration of basics of the CNN is highlighted, followed by the proposed algorithms and analysis. The results from these algorithms are validated on real-world micro-array images and compared with the commercially available software GenePix®.
2.1. Micro-array
In the cDNA micro-array experiment (DeRisi et al., 1996, 1997; Eisen and Brown, 1999; Jain et al., 2002; Yang et al., 2002), Ribonucleic Acid (RNA) is first isolated from both control and experimental samples of the cells and tissues of interest, and then converted into cDNAs by the so-called reverse transcription process (Whitchurch, 2002). Those two RNA populations are labelled with fluorescent dyes such as Cy3 and Cy5. The two samples to be compared are hybridised simultaneously to a glass slide. The hybridised micro-array is excited by a laser and scanned at wavelengths suitable for the detection of applied fluorescent dyes. The amount of fluorescence emitted upon laser excitation corresponds to the amount of cDNA hybridised to each spot. The end product of a comparative hybridisation experiment (Moore, 2001; Orengo et al., 2003) is a scanned array image, where the measured intensities from the two fluorescent reporters have been coloured red (R) and green (G) and overlaid. This array image is structured with intensity spots located on a grid and must be scanned to determine the amount of probes that bound to the spots when stimulated by a laser. Yellow spots have roughly equal amounts of bound cDNA from each sample and so have equal intensity in the R and G channels (red green yellow). Genes’ expression data derived from arrays measure spots quantitatively and can be used further for several analyses (Alizadeh et al., 2000; Mata et al., 2002).
In a micro-array image, the spots, which constitute the foreground of micro-array images, occupy a small fraction of the image area and contain the essential information for micro-array image analysis and gene expression tasks. Thus, their localisation and isolation from the image background are essential prior to the estimation of its mean intensity. Generally, there are many stages in image analysis. Filtering, as a low-level image cleaning procedure, can be used to remove the very small contribution of artefacts. It is also a term used to describe robust ways of removing the background trend (Wit and McClure 2004). The ’spotting’ stage comes after filtering, which is frequently referred to as gridding. A variety of micro-array gridding methods have been previously suggested in the literature such as the Bayesian approach proposed by Hartelius and Carstensen (2003) and genetic algorithm approach (Morris, 2008) dividing the imagery into manageable areas. Then, segmentation stage (Cheriet et al., 1998) classifies pixels in a region immediately surrounding a gene as belonging to either the foreground or background domains. Finally, each spot is analysed to determine the corresponding gene expression level.
6 There have been many previous techniques proposed for dealing with the problem of segmentation. In ScanAlyse (Eisen, 2010) and GenePix (Anonymous, 1999) softwares, fixed and adaptive circle segmentation methods have been used. In these methods, all spots are assumed to be circular with a fixed or adaptive radius. However, the spots in the micro-array image vary in size and shape and are not printed as precisely as would be ideally desired and, hence, assuming otherwise is the main drawback of these methods. In the ImaGene (Anonymous, 2008) software, the histogram-based segmentation method has been used. This technique utilises the peaks in the histogram in order to specify a threshold for the discrimination between the gene spot and the background regions. But, this assumption could lead to incorrect observations. In particular, in noisy images there could be no peaks (valleys) that can be used to infer a threshold (the range of intensities very small). Therefore, it is almost impossible to find a threshold value or a set of threshold values that will result in a single connected region that will match the set of spot pixels that a biologist would determine to be the spot pixels. In the Spot (Buckley, 2000) software, Seeded Region Growing (SRG) (Adams and Bischof, 1994). SRG methods are perhaps the most powerful with respect to shape identification, but they rely on a seed growing methodology, as well as the selection of the initial seeds (Tran et al., 2004).
Yang et al. (2002) showed that the background correction is an important task for micro-array image analysis, whose aim is to remove the contribution in intensity, which is not due to the hybridisation of the cDNA samples to the spotted DNA. Due to system imperfections and the micro-array image generation process, the resulting images, in addition to background fluorescence, are contaminated by various types of noise, biological and systematic (Fraser, 2006). Biological noise is intrinsic, and includes hybridisation noise and washing noise. Systematic noise includes hardware and random noises as well as artefacts caused by dust on the glass (Lukac et al., 2005). These types of noises affect micro-array images, which are corrupted by irregularities in the shape, size and position of the spots, and are dominated by spatially inhomogeneous noise (Balagurunathan et al., 2004). Therefore, the correction of such artefacts is crucial for making accurate expression measurements because, unlike background fluorescence, their spatial location is unknown and can lead to errors propagated to all subsequent stages of the analysis (Blekas et al., 2003). Also, the large number of spots (usually in thousands) as well as their shape and position irregularities (Lukac and Smolka, 2003; Wang et al., 2003a) can propagate processing errors through subsequent analysis steps (Eisen and Brown, 1999; Lukac et al., 2004; Wang et al., 2003b).
All the issues addressed above, in addition to the large amount of time that has to be spent on manually processing the micro-arrays, have stirred a great deal of research interest in using a fully automated procedure to accomplish the task (Bajcsy, 2004; Jain et al., 2002; Katzer et al., 2003). The main purpose of this paper is to follow the same trend by investigating the multi-view analysis and implement filtering techniques to micro-array images to reduce the artefacts’ noise and, at the same time, enhance the position of gene spots.
2.2. Cellular Neural Networks
A Cellular Neural/Nonlinear Network is defined by two mathematical constructs (Chua and Yang, 1988a, 1988b):
7 • a spatially discrete collection of continuous non-linear dynamical systems called cells, where information can be encrypted into each cell via three independent variables called input, threshold, and initial state
• a coupling law relating one or more relevant variables of each cell to all neighbouring cells located within a prescribed sphere of influence Nr(ij) of radius r centred at ij.
The analogue circuit has played a very important role in the development of modern electronic technology. Even in our digital computer era, analogue circuits still dominate such fields as communications, power, automatic control, audio and video electronics because of their real-time signal processing capabilities.
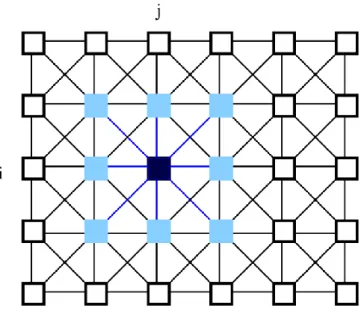
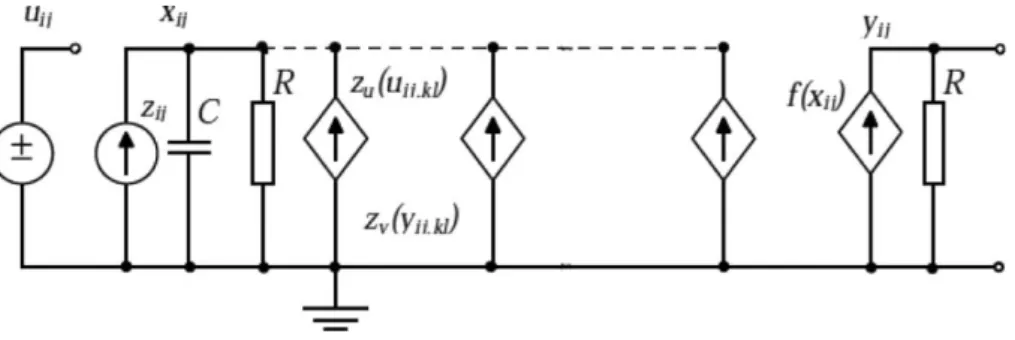
Conventional digital computation methods have run into a serious speed bottleneck due to their serial nature. To overcome this problem, a new computation model called ‘neural networks’ has been proposed, which is based on some aspects of neurobiology and adapted to integrated circuits. The key features of the neural networks are asynchronous parallel processing, continuous-time dynamics, and global interaction of network elements. Some encouraging, if not impressive, applications of neural networks have been proposed for various fields such as optimisation, linear and non-linear programming, associative memory, pattern recognition and computer vision. The basic circuit unit of CNNs is called a cell, see Figures 2 and 3. It contains linear and non-linear circuit elements, which are typically linear capacitors, linear resistors, linear and non-linear controlled sources, and independent sources. The structure of CNNs is similar to that found in cellular automata; namely, any cell in a CNN is connected only to its neighbour cells. The adjacent cells can interact directly with each other. Cells not directly connected together may affect each other indirectly because of the propagation effects of the continuous-time dynamics of CNNs.
Figure 2 A 2-dimensional CNN defined on a squared grid. The ijth cell of the array is coloured by black, cells that falls within the sphere of influence of neighbourhood radius r = 1 (the nearest
8
Figure 3 CNN base cell
As the basic framework, let us consider a two-dimensional M × N CNN array in which the cell dynamics is described by the following non-linear ordinary differential equation with linear and nonlinear terms:
Where
where xij, uij and yij are the state, input and output voltages of the specific CNN cell,
respectively. The state and output vary in time, the input is static (time-independent), ij refers to grid point associated with a cell on a 2D grid, and kl ∈ Nr is a grid point in the neighbourhood within a radius r of the cell ij. Term Aij, kl represents the linear feedback, Bij, kl is the linear control, while zij is the cell current (also referred to as
bias or threshold) which could be space and time variant. The time constant of a CNN cell is determined by the linear capacitor (C) and the linear resistor (R), and it can be expressed as τ = RC. A CNN cloning template, the program of the CNN array, is given with the linear and non-linear terms completed by the cell current.
The bias (also referred to as the bias map) of a CNN layer is a grey-scale image. The bias map can be viewed as the space variant part of the cell current. Using pre-calculated bias maps the linear spatial adaptivity can be added to the templates in CNN algorithms. If the bias map is not specified it is assumed to be zero.
3. The algorithm
As the algorithm to be developed is concerned with rough gridding information, the segmentation method has to be robust. To get the preliminary coordinates of the spots, the robust gridding algorithm proposed by Morris (2008) has been used. When the girdding information is ready, each region of interest is put to the two-stage process. First, the multi-view analysis is carried out by applying the ITE function (Fraser et al., 2010; Zineddin et al., 2008). Ideally, the output of this stage would be the best
9 candidate as input for the segmentation stage. However, analysing the performance of different ITE functions in terms of the combinations of the parameters α and β has led to some conclusion and future recommendations, to be discussed later. The intermediate output is fed into the segmentation stage. A novel CNN algorithm is then proposed and performed using MatCNN MATLAB toolbox from AnaLogic Computers Kft. The algorithm could be applied on CNN-UM or GPU.
3.1. Multi-view analysis of cDNA micro-array
Figure 4 illustrates the multi-view analysis process, which is called the Image Transformation Engine (ITE), and applied to a dual channel micro-array image. After various testing stages are carried out (Fraser et al., 2010; Zineddin et al., 2008) to determine relative performance and speed of execution, a good compromise for the ITE function can be found that gives the elements of the square root and inverse transforms, see equation (2). Ideally, such a hybrid function needs to harness the gene spot intensity ranges as calculated by the square root function while, at the same time, taking a higher percentage of the gene spot with similar background intensities from the inverse function.
where x is the 16-bit intensity value that is converted into 8-bits.
Figure 4 Pipeline of ITE feature response curve generation
Applying a smoothing operator before the actual re-scaling process takes place will be of additional benefit as this smoothing process can remove small region high intensity pixels that are of no value in a gene spot identification context. In the basic ITE process, the two channels of the input image are first smoothed by two different Median filters before the actual ITE filter itself is applied. The first Median filter simply parses the red and green channel surface’s independently with a sampling window of 5 × 5 pixels centred on each pixel in turn. This centre pixel is thus calculated as the median of all the pixels in the 5 × 5 region. The 5 × 5 region of the Median filter process effectively removes any local high-intensity pixels with the minimum amount of disruption passed on to the surrounding regions.
The second Median filter is essentially the same as the first in that the second filter uses a larger window region and sampling ratio. In this case, the window measures 57 × 57 pixels, with the sampling or centred pixel set to every forth pixel in turn. This second filter sampling process results in a simple estimation of the image’s
10 background features (if the median value is subtracted from every pixel in the image). Such smoothing operators have two positive effects on the image data:
• low-level background noise is either reduced substantially or removed altogether from the image
• large-scale artefacts have their internal structure removed from the image data. 3.1.1. Median filter
A typical micro-array image contains several kinds of artefact noises (hair, scratches and fingerprints, for example). If the operator of traditional micro-array image analysis software is to be removed from the analysis process, the input images must be cleaned (have noise artefacts removed). However, this cleaning process should not affect the gene spot intensities themselves as later stages will use such information to help in determining the gene spot locations. Applying a smoothing operator as the initial stage will be of additional benefit as this smoothing process can remove small region high intensity pixels that are of no value in a gene spot identification context. The first Median filter simply parses the red and green channel surface’s independently with a sampling window of 5 × 5 pixels centred on each pixel in turn. This centre pixel is thus calculated as the median of all the pixels in the 5 × 5 region. The 5 × 5 region of the Median filter process effectively removes the small artefacts on the array. Since a hybridised spot is much larger than the smoothing window, the filter will not affect the overall structure of the spot.
3.1.2. Top-hat filter
The Top-hat filter can be used to remove the background trend, as proposed in Yang et al. (2002). The background trend is estimated using the morphological opening, which is obtained by, first, replacing each pixel by the minimum local intensity and then performing a similar operation on the resulting image via the local maximum. For a region, we use a square of size (2m + 1) × (2m + 1) centred on each pixel, where m is a non-negative integer used to specify the size of the Top-hat filter. Mathematically, the pixels oi in the opened image are given by
where pk = minj Ik+j (for | j1|, | j2| ≤ m) with I again denoting the original pixel values.
If m is set to a very large value (i.e., m = ∞), then oi ≡ Ii and the filter has no effect. If the Top-hat filter is applied, then by using a structuring element obtained through hauto-correlation on horizontal and vertical axes mean value vectors, only the pixels in the spots will be substantially changed from Ii to oi. In this case, by subtracting o from I,these spots will be made more distinct.
3.1.3. Complex Diffusion filter
It is generally accepted that images contain structures at different scales. Practically, in many cases, there is no clear idea about the right scale to obtain the desired information. Therefore, it is beneficial to have an image representation at multiple scales (Alvarez et al., 1993). So, a multi-scale representation of an image is an
11 ordered set of derived images intended to represent the original image at various levels of scale (Bovik, 2000). Having these structures eases the image’s processing in later stages. Originally, the Gaussian representation introduced a scale dimension by convolving the original image with a Gaussian function as a standard deviation σ = √2t. This is analogous to solving the linear diffusion equation:
with a constant diffusion coefficient c = 1, I0 is the original image, It are the derived images (at time t) and ∇ is the gradient.
A major breakthrough came from Perona and Malik (1990), who proposed anisotropic diffusion for adaptive smoothing to formulate the problem in terms of the nonlinear heat equation. The main benefit of anisotropic diffusion is ’edge preservation’ through the image processing by introducing diffusion coefficient function c(x) (Weickert, 1998). This function encourages intra-regional smoothing over inter-regional smoothing (Bovik, 2000). Hence, if c(x) is allowed to vary according to the local image gradient, we have anisotropic diffusion. A basic anisotropic diffusion PDE is:
with c(|∇It|) is the diffusion function, I0 = I (Bovik, 2000), I0 is the original image, It
the derived images (at time t), div is the divergence operator and ∇ is the gradient. Recently, Gilboa et al. (2001) generalised the linear and non-linear scale spaces to the Complex Diffusion processes by combining the diffusion and the free Schrödinger equation. In this paper, we incorporate the Complex Diffusion process (‘CLD’: complex valued – ramp preserving (6)) and ITE to enhance the image quality for further processing. The real part can be considered as filtered image and imaginary part can be regarded as a smoothed second derivative, by time, when the Complex Diffusion coefficient approaches the real axes (Gaussian and Laplacian pyramids of the real part).
where K is a threshold parameter, Im is the imaginary part of a complex number, I is the image (at any given time). The phase angle θ should be small (θ << 1).
3.2. Segmentation
In order to qualify the different filtering combinations, we use a modified version of the method proposed by Rekeczky et al. (1998), where Rekeczky used both local threshold estimation and locally adaptive segmentation.
12 3.2.1. Local threshold estimation
In the case of using Median filter or Top-hat filter, Figure 5, the threshold estimation is carried out by scaling the mean and standard deviation in the local neighbourhood window 3 × 3 in our case) and adding up to create the bias map of the adaptive segmentation. The result, therefore, defines a space variant threshold level as a linear combination of the first and second order local statistics (see Sezgin and Sankur, 2004; Venkateswarlu and Boyle 1995).
Figure 5 Locally adaptive segmentation, with Median and Top-hat filters
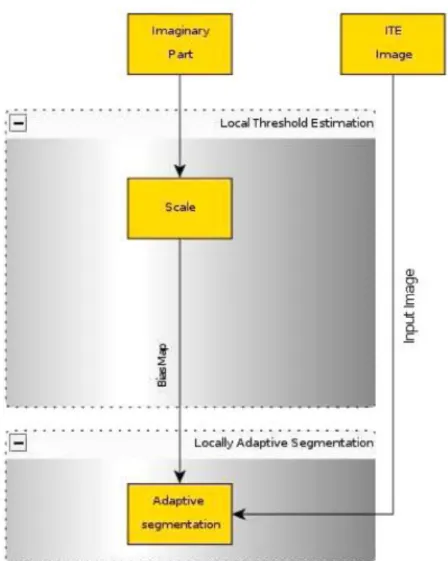
Since the imaginary part of the Complex Diffusion filter’s output is a smoothed second derivative, we use the imaginary part to create the bias map of the adaptive segmentation, see Figure 6.
13
Figure 6 Locally adaptive segmentation, with Complex Diffusion filter
3.2.2. Locally adaptive segmentation
The segmentation process performs the following mapping (7) (grey-scale to binary): Y′ = Sr (Y, Θ) (7)
where Y is the ITE image, Θ is the space-variant threshold level (local threshold estimation) and Y′ is the binary output of the mapping. Sr compares the image to the threshold in the local neighbourhood Nr and specifies the binary output. The Cellular Neural Network (CNN) used to carry out the adaptive segmentation with a single template operation ADTHRES in equation (8) gives the binary segmentation output (Rekeczky, 2002).
14
4. Main results
Although the ITE is proven to be efficient in Fraser et al. (2010) and Zineddin et al. (2008), there is still much room for further improvements. Fraser (2006) showed that the median average operators help to reduce small artefacts. However, there is a negative aspect associated with these operators. For instance, by applying the second level median associated with sampling of the background elements slightly more than the sampling of the foreground, there could be a negative effect of reducing the internal gene spot regions intensities.
In this paper, the second median average operator has been replaced by either the morphological Top-hat filter or Complex Diffusion filter. First, the Top-hat filter is a good tool to estimate the background of the image, and therefore, it is important to test how much it preserves the edge. Remember that enhancing the spot location would have a positive impact when applying hybrid equation (2). Second, Complex Diffusion is suitable for reducing the noise and enhancing the spots’ edge, which would be advantageous in integrating with the ITE process as a whole.
Remark 1: In this paper, a Set of 18 micro-array images have been used. Every image consists of 24 blocks with 32 columns and 12 rows. The first row of each block consists of the same 32 control genes and should be the same across each slide. The remaining 11 rows of each odd numbered block make up the 4224 observed genes which are repeated in each corresponding even numbered block. The data set is in the Database of the Centre of Intelligent Data Analysis (CIDA), Brunel University. The quantitative comparison has been done between the proposed algorithms and GenePix® results, that have been used in Pollara et al. (2005).
To test the methods proposed, the images in the data set are divided into many regions-of-interest and then processed using the selected methods with the whole range of α and β values, see equation (2). Figure 7 shows the percentage of each method getting the best output. Note that the Complex Diffusion filter gives the best performance for most cases (37%).
Figure 7 The percentage of accuracy for different filters
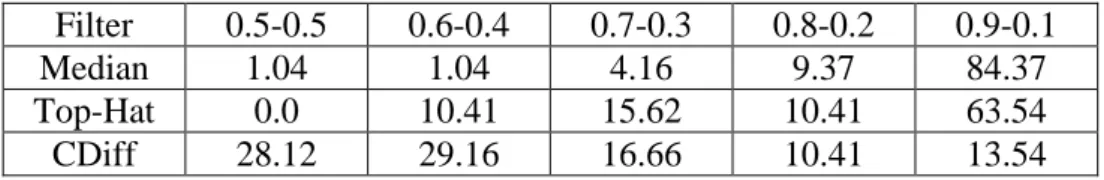
The best values for α and β specified for each method are listed in Table 1. We note that the best outputs for Median and Top-hat filters are with the maximum value of α. Although it gives a good filtering performance, the high value of α means removing a lot of information (e.g., spots’ intensities) which might be important. On the contrary,
15 Complex Diffusion gets the best output on the middle range of α and β, and therefore, keeps much more information, which might be useful in the later processing.
Filter 0.5-0.5 0.6-0.4 0.7-0.3 0.8-0.2 0.9-0.1
Median 1.04 1.04 4.16 9.37 84.37
Top-Hat 0.0 10.41 15.62 10.41 63.54
CDiff 28.12 29.16 16.66 10.41 13.54
Table 1 The best α, β values (percent) (see equation (2)
In order to quantify the performance of different filtering methods, a quality measure is required that allows the judgement of how well the calculated template fits the genes’ spot position. Note that all the methods produce a mask that classifies the pixels as belonging to either signal (the gene spots) or noise (the local background). For this purpose, an image quality measurement, known as the Peak Signal-to-Noise Ratio (PSNR) (Fraser et al., 2004), is used and the rational is justified as follows. The Mean Square Error (MSE) and the PSNR are the two error metrics frequently used to compare image compression quality. The MSE represents the cumulative squared error between the compressed and the original image, whereas PSNR represents a measure of the peak error. The lower the value of MSE, the lower is the error. The PSNR is most commonly used as a measure of quality of reconstruction of lossy compression codecs (e.g., for image compression). The signal in this case is the original data, and the noise is the error introduced by compression. Though a higher PSNR would normally indicate that the reconstruction is of higher quality, in some cases one reconstruction with a lower PSNR may appear to be closer to the original than another.
To compute the PSNR, the block first calculates the mean-squared error using the following equation:
where M and N are the numbers of rows and columns in the input images, respectively. Then we obtain the PSNR using the following equation:
where R is the maximum fluctuation in the input image data type. For example, if the input image has a double-precision floating-point data type, then R is 1. If it has an 8 – bit unsigned integer data type, R is 255, etc. Based on the above discussion, the three methods are applied on a set of raw images to produce masks, which are then scored by using the criterion of PSNR. Figure 8, as an example of the scoring outputs, shows how promising the complex filter performs when combined with the multi-view process. From Figure 8, we directly compare PSNR values determined by the commercial software GenePix® and our algorithm (CLD) for the individual images. CLD has shown a marked 2–12 dB improvement. essentially, the CLD process has
16 consistently outperformed the human expert using GenePix in terms of gene spot identification.
Figure 8 PSNR for the dataset
5. Conclusions
This paper has dealt with the problem of how to improve the processes involved in the analysis of micro-array image data. The main focus is to clarify an image’s feature space in an unsupervised manner. Rather than using the raw micro-array image, it has been suggested that producing multiple views of the image data such that emphasis is placed on certain frequencies or regions of interest would not only be advantageous, but more effective in terms of the overall goal. Different combinations of filtering methods incorporated as a component of multi-view analysis process have been investigated by applying them a set of real-world cDNA micro-array images. Both Median and Top-hat filters have shown good performance over data-set images. Although the best optimisation parameters (α and β) could have negative effects on the segmentation process by reducing gene spot regions intensities, using the Complex Diffusion filter has proven to be the best among the tested filters.
Acknowledgements
This work was supported in part by the Engineering and Physical Sciences Research Council (EPSRC) of the UK under Grant GR/S27658/01, the National Science Foundation of China under Innovative Grant 70621001, Chinese Academy of Sciences under Innovative Group Overseas Partnership Grant, the BHP Billiton Cooperation of Australia Grant, the International Science and Technology Cooperation Project of China under Grant 2009DFA32050 and the Alexander von Humboldt Foundation of Germany.
17
References
Adams, R. and Bischof, L. (1994) ‘Seeded region growing’, IEEE Transactions on Pattern Analysis and Machine Intelligence, Vol. 16, No. 6, pp.641–647.
Alizadeh, A.A., Eisen, M.B., Davis, R.E., Ma, C., Lossos, I.S., Rosenwald, A., Boldrick, J.C., Sabet, H., Tran, T., Yu, X., Powell, J.I., Yang, L., Marti, G.E., Moore, T., Hudson, J., Lu, L., Lewis, D.B., Tibshirani, R., Sherlock, G., Chan, W.C., Greiner, T.C., Weisenburger, D.D., Armitage, J.O., Warnke, R., Levy, R., Wilson, W., Grever, M.R., Byrd, J.C., Botstein, D., Brown, P.O. and Staudt, L.M. (2000) ‘Distinct types of diffuse large B-cell lymphoma identified by gene expression profiling’, Nature, Vol. 403, No. 6769, pp.503–511.
Alvarez, L., Guichard, F., Lions, P.L. and Morel, J.M. (1993) ‘Axioms and fundamental equations of image processing’, Archive for Rational Mechanics and Analysis, Vol. 123, No. 3, pp.199–257.
Anonymous (1999) GenePix 4000 A User’s Guide, [online], Available from: Molecular Devices,
http://www.moleculardevices.com/pages/instruments/gn_genepix4000.html
Anonymous (2008) ImaGene 6.1 User Manual, [online], Available from: BioDescovery. http://www.biodiscovery.com/index/imagene
Arena, P., Bucolo, M., Fortuna, L. and Occhipinti, L. (2002) ‘Cellular neural networks for real-time DNA microarray analysis’, IEEE Engineering in Medicine and Biology Magazine, Vol. 21, No. 2, pp.17–25.
Bajcsy, P. (2004) ‘Gridline: automatic grid alignment DNA microarray scans’, IEEE Transactions on Image Processing, Vol. 13, No. 1, pp.15–25.
Balagurunathan, Y., Wang, N., Dougherty, E.R., Nguyen, D., Chen, Y., Bittner, M.L., Trent, J. and Carroll, R. (2004) ‘Noise factor analysis for cDNA microarrays’, Journal of Biomedical Optics, Vol. 9, No. 4, pp.663–678.
Blekas, K., Galatsanos, N.P. and Georgiou, I. (2003) ‘An unsupervised artifact correction approach for the analysis of DNA microarray images’, in Galatsanos, N.P. (Ed.): IEEE Interna tionalConference on Image Processing (ICIP 2003), Barcelona, Vol. 2, pp.165–168.
Blekas, K., Galatsanos, N.P., Likas, A. and Lagaris, I.E. (2005) ‘Mixture model analysis of DNA microarray images’, IEEE Transactions on Medical Imaging, Vol. 24, No. 7, pp.901–909.
Bovik, A. (2000) Handbook of Image and Video Processing, Electronics and Electrical, Elsevier Academic Press, Burlington, USA.
Bozinov, D. (2003) ‘Autonomous system for web-based microarray image analysis’, IEEE Transactions on Nanobioscience, Vol. 2, No. 4, pp.215–220.
Bozinov, D. and Rahnenfuhrer, J. (2002) ‘Unsupervised technique for robust target separation and analysis of DNA microarray spots through adaptive pixel clustering’, Bioinformatics, Vol. 18, No. 5, pp.747–756.
Buckley, M.J. (2000) The Spot User’s Guide, [online], Available from: CSIRO Mathematical and Information Sciences,
http://www.cmis.csiro.au/IAP/Spot/spotmanual.htm
Cheriet, M., Said, J.N. and Suen, C.Y. (1998) ‘A recursive thresholding technique for image
segmentation’, IEEE Transactions on Image Processing, Vol. 7, No. 6, pp.918–921. Chua, L.O. (1997) ‘CNN: a vision of complexity’, International Journal of Bifurcation and Chaos in Applied Sciences and Engineering, Vol. 7, pp.1425–2219. Chua, L.O. and Roska, T. (1992) ‘The CNN universal machine. I. The architecture’,
18 Second International Workshop on Cellular Neural Networks and their Applications, pp.1–10.
Chua, L.O. and Roska, T. (1993) ‘The CNN paradigm’, IEEE Transactions on Circuits and Systems-I: Fundamental Theory and Applications, Vol. 40, No. 3, pp.147–156.
Chua, L.O. and Yang, L. (1988a) ‘Cellular neural networks: applications’, IEEE Transactions on Circuits and Systems, Vol. 35, No. 10, pp.1273–1290.
Chua, L.O. and Yang, L. (1988b) ‘Cellular neural networks: theory’, IEEE Transactions on Circuits and Systems, Vol. 35, No. 10, pp.1257–1272.
Cohen, J. (2005) ‘Computer science and bioinformatics’, Communications of the ACM, Vol. 48, No. 3, pp.72–78.
Cruz, J.M. and Chua, L.O. (1998) ‘A 16 × 16 cellular neural network universal chip: the first complete single-chip dynamic computer array with distributed memory and with gray-scale input-output’, Analog Integrated Circuits and Signal Processing, Vol. 15, No. 3, pp.227–238.
Csapodi, M. and Roska, T. (1996) ‘Dynamic analogic CNN algorithms for a complex recognition task – a first step towards a bionic eyeglass’, International Journal of Circuit Theory and Applications, Vol. 24, No. 1, pp.127–144.
Daskalakis, A., Cavouras, D., Bougioukos, P., Kostopoulos, S., Glotsos, D., Kalatzis, I., Kagadis, G.C., Argyropoulos, C. and Nikiforidis, G. (2007) ‘Improving gene quantification by adjustable spot-image restoration’, Bioinformatics, Vol. 23, No. 17, pp.2265–2272.
DeRisi, J., Penland, L., Brown, P.O., Bittner, M.L., Meltzer, P.S., Ray, M., Chen, Y., Su, Y.A. and Trent, J.M. (1996) ‘Use of a cDNA microarray to analyse gene expression patterns in human cancer’, Nature Genetics, Vol. 14, No. 4, pp.457–460. DeRisi, J.L., Iyer, V.R. and Brown, P.O. (1997) ‘Exploring the metabolic and genetic control of gene expression on a genomic scale’, Science, Vol. 278, No. 5338, pp.680– 686.
Dolan, R. and DeSouza, G. (2009) ‘GPU-based simulation of cellular neural networks for image processing’, Proc. International Joint Conference on Neural Networks IJCNN 2009, pp.730–735.
Dominguez-Castro, R., Espejo, S., Rodriguez-Vazquez, A. and Carmona, R. (1994) ‘A CNN universal chip in CMOS technology’, The Third IEEE International Workshop on Cellular Neural Networks and their Applications, pp.91–96.
Dominguez-Castro, R., Espejo, S., Rodriguez-Vazquez, A., Carmona, R.A., Foldesy, P., Zarandy, A., Szolgay, P., Sziranyi, T. and Roska, T. (1997) ‘A 0.8 micrometer CMOS two-dimensional programmable mixed-signal focal-plane array processor with on-chip binary imaging and instructions storage’, IEEE Journal of Solid-State Circuits, Vol. 32, No. 7, pp.1013–1026.
Eisen, M.B. (2010) ScanAlayse, Online, URL: http://rana.lbl.gov/eisensoftware.htm Eisen, M.B. and Brown, P.O. (1999) ‘DNA arrays for analysis of gene expression’, Methods in Enzymology, Vol. 303, pp.179–205.
Fraser, K. (2006) cDNA Microarray Image Analysis – A Fully Automatic Framework, PhD Thesis ,Brunel University, London, UK.
Fraser, K., O’Neill, P., Wang, Z. and Liu, X. (2004) ‘Copasetic analysis: a framework for the blind analysis of microarray imagery’, IEE Proceedings Systems Biology, Vol. 1, No. 1, pp.190–196.
Fraser, K., Wang, Z. and Liu, X. (2010) Microarray Image Analysis, Chapman & Hall/CRC Taylor & Francis Group, Florida, USA.
19 Gilboa, G., Zeevi, Y. and Sochen, N. (2001) Complex Difusion Processes for Image Filtering, Scale-Space and Morphology in Computer Vision, Springer, Berlin/Heidelberg, pp.299–307.
Gygi, S.P., Rochon, Y., Franza, B.R. and Aebersold, R. (1999) ‘Correlation between protein and mRNA abundance in yeast’, Molecule Cellular Biology, Vol. 19, No. 3, pp.1720–1730.
Hartelius, K. and Carstensen, J.M. (2003) ‘Bayesian grid matching’, IEEE Transactions on Pattern Analysis and Machine Intelligence, Vol. 25, No. 2, pp.162– 173.
Ho, T.Y., Lam, P.M. and Leung, C.S. (2008) ‘Parallelization of cellular neural networks on GPU’, Pattern Recognition, Vol. 41, No. 8, pp.2684–2692.
Jain, A.N., Tokuyasu, T.A., Snijders, A.M., Segraves, R., Albertson, D.G. and Pinkel, D. (2002). ‘Fully automatic quantification of microarray image data’, Genome Res., Vol. 12, No. 2, pp.325–332.
Katzer, M., Kummert, F. and Sagerer, G. (2003) ‘Methods for automatic microarray image segmentation’, IEEE Transactions on Nanobioscience, Vol. 2, No. 4, pp.202– 214.
Lawrence, N.D., Milo, M., Niranjan, M., Rashbass, P. and Soullier, S. (2003) ‘Bayesian processing of microarray images’, Neural Networks for Signal Processing, pp.71–80.
Linan, G., Rodriguez-Vazquez, A., Espejo, S. and Dominguez-Castro, R. (2003) ‘ACE16k: a 128x128 focal plane analog processor with digital I/O’, International Journal of Neural Systems, Vol. 13, No. 6, pp.427–434.
Lukac, R. and Smolka, B. (2003) ‘Application of the adaptive center-weighted vector median framework for the enhancement of cDNA microarray images’, International Journal of Applied Mathematics and Computer Science, Vol. 13, No. 3, pp.369–383. Lukac, R., Plataniotis, K.N., Smolka, B. and Venetsanopoulos, A.N. (2004) ‘A multichannel order-statistic technique for cDNA microarray image processing’, IEEE Transactions on Nanobioscience, Vol. 3, No. 4, pp.272–285.
Lukac, R., Plataniotis, K.N., Smolka, B. and Venetsanopoulos, A.N. (2005) ‘cDNA microarray image processing using fuzzy vector filtering framework’, Fuzzy Sets and Systems, Vol. 152, No. 1, pp.17–35.
Mata, J., Lyne, R., Burns, G. and Bahler, J. (2002) ‘The transcriptional program of meiosis and sporulation in fission yeast’, Nature Genetics, Vol. 32, No. 1, pp.143– 147.
Moghadam, P.J. and Moradi, M.H. (2007) ‘Image sifting for micro array image enhancement’, in Kropatsch, W.G., Kampel, M. and Hanbury, A. (Eds.): Computer Analysis of Images and Patterns, Springer, Berlin, Germany, pp.871–877.
Moore, S.K. (2001) ‘Making chips to probe genes’, IEEE Spectrum, Vol. 38, No. 3, pp.54–60.
Morris, D. (2008) ‘Blind microarray gridding: a new framework’, IEEE Transactions on Systems, Man, and Cybernetics, Part C (Applications and Reviews), Vol. 38, No. 1, pp.33–41.
Orengo, C.A., Jones, D.T. and Thornton, J.M. (2003) Bioinformatics: Genes, Proteins and Computers, BIOS Scientific Publishers, Oxford, UK.
Perona, P. and Malik, J. (1990) ‘Scale-space and edge detection using anisotropic diffusion’, IEEE Transactions on Pattern Analysis and Machine Intelligence, Vol. 12, No. 7, pp.629–639.
20 Pollara, G., Kwan, A., Newton, P.J., Handley, M.E., Chain, B.M. and Katz, D.R. (2005) ‘Dendritic cells in viral pathogenesis: protective or defective?’, International Journal of Experimental Pathology, Vol. 86, No. 4, pp.187–204.
Rekeczky, C. (2002) ‘CNN architectures for constrained diffusion based locally adaptive image processing’, International Journal of Circuit Theory and Applications, Vol. 30, Nos. 2–3, pp.313–348.
Rekeczky, C. and Chua, L.O. (1999) ‘Computing with front propagation: active contour and skeleton models in continuous-time CNN’, The Journal of VLSI Signal Processing, Vol. 23, No. 2, pp.373–402.
Rekeczky, C., Roska, T. and Ushida, A. (1998) ‘CNN-based difference-controlled adaptive non-linear image filters’, International Journal of Circuit Theory and Applications, Vol. 26, No. 4, pp.375–423.
Rekeczky, C., Tahy, A., Vegh, Z. and Roska, T. (1999) ‘CNN-based spatio-temporal nonlinear filtering and endocardial boundary detection in echocardiography’, International Journal of Circuit Theory and Applications, Vol. 27, No. 1, pp.171– 207.
Rekeczky, C., Ushida, A. and Roska, T. (1995) ‘Rotation invariant detection of moving and standing objects using analogic cellular neural network algorithms based on ring-codes’, IEICE Transactions on Fundamentals and Information Sciences, Vol. 78, pp.1316–1330.
Schena, M., Shalon, D., Davis, R.W. and Brown, P.O. (1995) ‘Quantitative monitoring of gene expression patterns with a complementary DNA microarray’, Science, Vol. 270, No. 5235, pp.467–470.
Sezgin, M. and Sankur, B. (2004) ‘Survey over image thresholding techniques and quantitative performance evaluation’, Journal of Electronic Imaging, Vol. 13, No. 1, pp.146–168.
Shalon, D., Smith, S.J. and Brown, P.O. (1996) ‘A DNA microarray system for analyzing complex DNA samples using two-color fluorescent probe hybridization’, Genome Research, Vol. 6, No. 7, pp.639–645.
Soos, B., Rak, A., Veres, J. and Cserey, G. (2008) ‘GPU powered CNN simulator (SIMCNN) with graphical flow based programmability’, 11th International Workshop on Cellular Neural Networks and Their Applications CNNA2008, pp.163–168.
Stekel, D. (2003) Microarray Bioinformatics, Cambridge University Press, Cambridge, UK. Tran, D., Wagner, M., Lau, Y.W. and Gen, M. (2004) ‘Fuzzy methods for voice-based person authentication’, Transactions of the Institute of Electrical Engineers of Japan, Vol. 124, No. 10, pp.1958–1963.
Venkateswarlu, N.B. and Boyle, R.D. (1995) ‘New segmentation techniques for document image analysis’, Image and Vision Computing, Vol. 13, No. 7, pp.573–583. Wang, X.H., Istepanian, R.S.H. and Hua, S.Y. (2003b) ‘Application of wavelet modulus maxima in microarray spots recognition’, IEEE Transactions on Nanobioscience, Vol. 2, No. 4, pp.190–192.
Wang, X.H., Istepanian, R.S.H. and Song, Y.H. (2003a) ‘Microarray image enhancement by denoising using stationary wavelet transform’, IEEE Transactions on Nanobioscience, Vol. 2, No. 4, pp.184–189.
Weickert, J. (1998) Anisotropic Diffusion in Image Processing, ECMI Series, Teubner, Stuttgart, Germany.
Whitchurch, A.K. (2002) ‘Gene expression microarrays’, IEEE Potentials, Vol. 21, No. 1, pp.30–34.
Wit, E. and McClure, J. (2004) Statistics for Microarrays: Design, Analysis and Inference, Wiley, West Sussex, UK.
21 Yang, Y.H., Buckley, M.J., Dudoit, S. and Speed, T.P. (2002) ‘Comparison of methods for imag eanalysis on cDNA microarray data’, Journal of Computational and Graphical Statistics, Vol. 11, pp.108–136.
Zarandy, A., Werblin, F., Roska, T. and Chua, L.O. (1996) ‘Spatial logic algorithms using basic morphological analogic CNN operations’, International Journal of Circuit Theory and Applications, Vol. 24, No. 3, pp.283–300.
Zineddin, B., Wang, Z., Fraser, K. and Liu, X. (2008) ‘Investigation on filtering cDNA microarray image based multiview analysis’, in Zhang, S. and Li, D. (Eds.): The 14th International Conference on Automation and Computing, Pacilantic International Ltd., London, UK, pp.201–206.