Citation: Nnko, Noe, Yang, Longzhi and Naik, Nitin (2018) Dendritic Cell Algorithm with
Optimised Parameters using Genetic Algorithm. In: 2018 World Congress on Computational
Intelligence. IEEE. ISBN 978-1-5090-6018-4
Published by: IEEE
URL: http://doi.org/10.1109/CEC.2018.8477932 <http://doi.org/10.1109/CEC.2018.8477932>
This version was downloaded from Northumbria Research Link:
http://nrl.northumbria.ac.uk/34572/
Northumbria University has developed Northumbria Research Link (NRL) to enable users to
access the University’s research output. Copyright
©and moral rights for items on NRL are
retained by the individual author(s) and/or other copyright owners. Single copies of full items
can be reproduced, displayed or performed, and given to third parties in any format or
medium for personal research or study, educational, or not-for-profit purposes without prior
permission or charge, provided the authors, title and full bibliographic details are given, as
well as a hyperlink and/or URL to the original metadata page. The content must not be
changed in any way. Full items must not be sold commercially in any format or medium
without formal permission of the copyright holder. The full policy is available online:
http://nrl.northumbria.ac.uk/policies.html
This document may differ from the final, published version of the research and has been
made available online in accordance with publisher policies. To read and/or cite from the
published version of the research, please visit the publisher’s website (a subscription may be
required.)
Dendritic Cell Algorithm with Optimised
Parameters using Genetic Algorithm
Noe Elisa, Longzhi Yang
Department of Computer and Information Sciences Northumbria University
Newcastle upon Tyne, UK
Email:{noe.nnko, longzhi.yang}@northumbria.ac.uk
Nitin Naik
Defence School of
Communications of Information Systems Ministry of Defense, UK Email: [email protected]
Abstract—Intrusion detection systems are developed with the abilities to discriminate between normal and anomalous traffic behaviours. The core challenge in implementing an intrusion detection systems is to determine and stop anomalous traffic behavior precisely before it causes any adverse effects to the network, information systems, or any other hardware and digital assets which forming or in the cyberspace. Inspired by the biological immune system, Dendritic Cell Algorithm (DCA) is a classification algorithm developed for the purpose of anomaly detection based on the danger theory and the functioning of human immune dendritic cells. In its core operation, DCA uses a weighted sum function to derive the output cumulative values from the input signals. The weights used in this function are either derived empirically from the data or defined by users. Due to this, the algorithm opens the doors for users to specify the weights that may not produce optimal result (often accuracy). This paper proposes a weight optimisation approach implemented using the popular stochastic search tool, genetic algorithm. The approach is validated and evaluated using the KDD99 dataset with promising results generated.
Index Terms—Dendritic cell algorithm, genetic algorithm, danger theory, network intrusion detection, KDD99 dataset
I. INTRODUCTION
Advancement in information communication technology has led to rapidly increasing number of devices connected together sharing information at a significant speed and affordable cost. Internet has become among the basic human needs for both social and business communications. Today, almost every nation in the world is providing e-government services to its citizens and businesses to improve the performance of government orgnisations and departments in providing their services. The use of internet comes with challenges and among them intruders from the biggest threat. To make internet communication safe, various intrusion detection systems are employed to monitor traffics for any form of abnormalities. The core challenge to intrusion detection systems is to detect anomalous behavior and take actions before any adverse effects are caused to the network or information system.
For the purpose of intrusion detection, the second generation of artificial immune system algorithm based on biological Danger Theory has been proposed over a decade ago [1]. Bi-ological danger theory articulates that, human immune system
This work has been supported by the Commonwealth Scholarship Com-mission in the United Kingdom (CSC).
relies not only on making a discrimination between self (own cells) and nonself (foreign cells) antigens but rather react to what might cause damage and waht may not [2]. The danger model demonstrates that the key why the immune system is able to distinguish the self and nonself antigens is because nonself makes the body produce immune reactions different from the human biological nature.
Dendritic Cell Algorithm (DCA) was abstracted from the danger theory and the antigens presentation process of human dendritic cells (DCs) [3]. Briefly, DCA is a classification algorithm based on the danger theory and the functioning of human immune dendritic cells. In its core operation, DCA uses a weighted sum function to derive the output cumulative values from the input signals and antigen data. Due to the flexibility of using different weights that can be user-defined or derived empirically from the data, a set of used weights may not be optimal and thus lead to unsatisfied classification results.
This paper proposes an approach for optimizing the DCA weights by employing the popular search optimization tool Genetic Algorithm (GA). GA is inspired by the natural se-lection theory where the fittest individuals are selected for reproduction in order to produce better individuals of the next generation [4]. To produce the fittest individuals, GA usually goes through five stages which are population initialization, fit-ness evaluation, selection, crossover and mutation. Essentially, GA is a heuristic optimization technique which attempts to find out the individuals that produce the best output solutions or results.
In this work, the GA is used as an optimization technique to generate the set of optimal weights for the DCA function in an effort to produce the optimal classification results. Additionally, this work also investigates to what extent the weights generated by the proposed approach improves the abnormal behavior detection accuracy in the field of network intrusion detection, in reference to the pre-defined signal weights. The proposed approach is applied to the KDD99 dataset [5] for system validation and evaluation in the field of intrusion detection.
The rest of this paper is organized as follows: Section II introduces the basic background related to intrusion detection systems, artificial immune systems and the DCA. Section III
describes the proposed approach, an GA-based DCA system. Section IV presents the experiments and analyses the experi-mental results. Section V draws the conclusion and points out the future work directions.
II. BACKGROUND
This section provides a brief background information on intrusion detection systems, artificial immune systems and Dendritic cell algorithm.
A. Intrusion Detection systems
Intrusion detection systems (IDS) are software used to monitor network traffics for suspicious activity, which could be an attack or unauthorized activity such as exploiting vulnerable services in a network, applications layer attacks such as SQL injection, privilege escalation in the system, unauthorized logins, virus attacks, malware etc. IDS are equipped with mechanisms to alert the administrator when an anomaly be-havior from the traffics is sensed.
Over the past few years network attacks have been increased in number and severity, IDS have become a necessary measure in addition to the security infrastructure of most organizations [6]. There are different ways of classifying IDS based on its analysis approach and deployment point on a network. Based on their analysis approach, IDS fall into two classes, misuse and anomaly detections [6]. Based on the deployment, IDS can further be divided into host-based and network-based. In misuse detection, the IDS searches for specific attacks that are already documented in a large database of attack signatures usually using some pattern matching techniques [7]. As only knownn attack signatures are stored, the problem with misuse detection resides on being static that it cannot detect novel attacks, although it has very low false positives.
Anomaly intrusion detection systems use a dynamic ap-proach by setting up a set of rules while considering the abnormal activity on the network. This approach firstly evalu-ates normal traffic’s behavior, and then any traffic different with the normal ones are detected as anomaly. This class can react to new attacks if they have abnormal behaviors compared to the normal traffic although not all abnormal traffic are malicious, so this approach usually leads to a large number false positives [1]. Intelligent and classic anomaly-based IDS can be designed using artificial immune systems, fuzzy interpolation approaches [8]–[10], and other artificial intelligence techniques [11]–[14].
In terms of the deployment approaches, network-Based IDS is used to monitor the incoming and outgoing network traffics in a particular network environment and analyzes the traffics for suspicious activities. To capture all the data passing through the network, IDS need to be positioned at the entry and exit point of data from the private network to the internet. In contrast, Host-Based IDS are installed on a host to monitor traffics that are originating and coming to that particular hosts for suspicious activity [6]. Apart from monitoring incoming traffics to the host, it can also analyze the file system of a host, users’ logon activities and running processes.
B. Artificial Immune Systems
Artificial Immune System (AIS) is the class of computa-tional intelligence systems inspired by human immune system (HIS), which is designed to solve engineering problems related to anomaly detection, classifications and optimisations. When a foreign molecules (e.g virus) is encountered for the first time by the human immune system, the human retains their memory to identify them when encountered again in the later stage [15]. Since 1990s, AIS researches on intrusion detection system have been carried out by different researchers [16].
Negative selection algorithm is an example of the first generation of artificial immune system algorithm [17] derived from the fact that all new born immature T cells in a HIS must undergo a process of negative selection in the thymus where the self-reactive T cells binding with self-proteins are eliminated. Therefore the mature T-cells are released to the blood circle can only bind to nonself antigens. In AIS, negative selection algorithm collects a set of self string that define the normal state of the monitored system and then generated a set of detectors that only recognize nonself strings. This detector set is used to monitor the anomaly changes of the data in the system in order to classify them as being self or non-self. Positive selection algorithm is an alternative to negative selection in which the detectors for self strings are evolved rather than for non-self. The first generation of AIS algorithms have shown some weaknesses in detecting novel attacks which make them unsuitable for intrusion detection systems as network traffics change their behavior over time, despite of the advantages of error tolerance, adaptation and self-monitoring [18].
To overcome the shortcomings of the self-nonself AIS algorithms, the second generation of AIS algorithm, namely DCA [1], [19], was proposed based on HIS danger model [2]. According to [2] in biology, the recognition of a foreign molecule such as virus is based on environmental context (signals) rather than the simple self-non-self discrimination behaviour. It doesn’t matter if a damage is due to pathogens or by a cell defect, the immune response will react against what might cause damage to the cells. More precisely, if a foreign molecule does not cause damage or the cells die based on the normal programmed death process, no immune reaction is initiated [20].
In the danger model, dendritic cells (DCs) found in the immune system are responsible for collecting environmental signals (antigens) and present them for immune response [2]. As antigens represent the mechanism of the DCs, they are known as Antigen Presenting Cells (APCs). DCs are found in tissues that are in contact with the external environment such as the skin, lungs and stomach. DCs express Costimulatory Molecules (CSMs) on their cell surface which is used to limit the number of antigens they can sample and time spent to sample those antigens while in the danger zone. The four signals that DCs collect are pathogenic associated molecular patterns (PAMPs), safe signals (SSs), danger signals (DSs), and inflammatory cytokines (CKs).
PAMPs are proteins produced by pathogenic molecules such as virus and bacteria which can be easily detected by DCs and activate immune response. The presence of PAMP signals expressed by an antigen indicates an anomalous situation. DSs indicate an anomalous situation but with lower confidence than PAMP signals. SSs indicate that, DCs have been collected in their normal conditions. CKs are an indicator that, a great number of DCs have been collected in the tissue under distress. Based on the danger model in biology discussed above, the DCA algorithm was abstracted from the following facts [21]: 1) APCs in danger model can present an appropriate
danger signal.
2) The presence of signal has nothing to do with danger. The context of the signal determine the extent of the danger.
3) Signal may be present (positive signal) or may not be present (negative signal).
4) In biology, danger zone is spatial which is usually not the case for AIS. Instead, in AIS some other measure of proximity, often temporal information, may be used. 5) Danger signals rely on concentration (not binary
matching) to cause the migration of a cell.
The second generation of AIS, that is DCA, based on the danger module overcomes the self-nonself discrimination lim-itations associated with the first generation. It has been demon-strated that the AIS based on danger model, that is DCA, does not rely on alert correlation to detect intrusion; and therefore intrusions with no strong similarities can also be detected. C. Dendritic Cell Algorithm
DCA is a binary classification algorithm that is developed for the purpose of anomaly detection in computer network do-main; and can be used as an unsupervised or semi-supervised learning method [22]. When it is used as an unsupervised approach, DCA acquires the knowledge to assign a label of normal or anomalous to data instances by categorizing signals into PAMP, DS and SS. In addition, DCA is not cursed by the potential high dimensionality of data sets, so it can be applied to very large datasets with very high dimensionality without sacrificing the timeliness of data processing [22].
DCA is a population based intrusion detection system [3] where a population of DCs is created to form a development pool from which a number of DCs are randomly selected to perform antigens (data instance) sampling, and thus the number of data instances associated with a DC is not fixed. DCs in the development pool are exposed to all the data instances. Another DC pool only hosts the migrated DCs which are used to determine the labels of data items associated with the pool. The DCS takes three inputs from each data instance:
• PAMP: An attribute indicates clearly the presence of anomalous behaviour associated with a given data in-stance (antigen). For inin-stance an attribute reflecting the number of error messages generated per second by a failed network connection.
• DS: An attribute indicates the presence of abnormal
bahaviour but with lower confidence than PAMP. For instance, an attribute reflecting an increase in the number of transmitted network packets per second.
• SS: Presence of SS associated with an attribute is an indicator of normal behavior associated with a given antigen. For instance, an attribute reflecting a decrease in the number of network packets per second.
The DCA generates three interim outputs for each migrated DC, which are the concentrations of: [19]:
• Immature DCs (iDC) - Are responsible for multiple
antigens collection and are exposed to signals in the data source;
• Semi-mature DCs (smDC)- Is a result of iDC exposure
to more safe than danger signals. Presentation of antigens with smDC indicates normal situation; and
• Mature DCs (mDC) - Is a result of iDCs exposure to more danger than safe signals. The presentation of antigen with mDC indicates anomalous situation. From this, the context of the each DC is determined, and then the labels of data instances are finally predicted.
The DCA algorithm is outlined in Algorithm 1, which mainly include four phases.
1) Preprocessing and Initialization: In this phase, after feature reduction, each selected feature is assigned to a signal category of either PAMP, DS or SS; and two DC pools are created, including one development DC pool and a migrated DC pool. The size of the development DC pool is specified by the user and the size of the migrated DC pool is not limited. Note that redundant and noisy features may be included in the dataset and thus feature selection approaches may be used. For instance, rough fuzzy set approaches have been used for feature selection and signal categorization in a number DCAs [23], [24]. In particular, The rough fuzzy set approach firstly removes the unnecessary attributes. Then, the attribute with the smallest total uncertainty degree is selected to form the SSs as it is considered as the most informative feature. The next least uncertain attribute is selected to form PAMP whilst the rest of the selected attributes are aggregated to form the DSs.
2) Detection: Each data instance in the dataset represents an antigen. DCA processes the input signals, PAMP, DS and SS, of each data instance to obtain the interim output representing the concentrations of CSM, smDC, mDC by: C= (WP AM P ∗CP AM P) + (WSS∗CSS) + (WDS∗CDS)
WP AM P +WSS+WDS
∗1 +I 2 ,
(1) whereCP M AP, CSS andCDS are the input signal values for PAMP, SS and DS respectively,WP M AP, WSS andWDS are the signal weights used for PAMP, SS and DS, respectively,I represents the CK with no sufficient effect to cause maturation but can amplify the other three input signals (i.e., PAMP, DS and SS). Equation 1 is used three times to calculate the interim
output of the concentrations of CSMs, mDC and smDC, but using different sets of weights. The weights WP M AP, WSS andWDSare usually pre-defined or derived from experimental observation performed on natural DCs according to [3], which is summarized in Table I. Nevertheless, these weights may also be derived empirically from data [19], [25].
Table I
DCAPRE-DEFINED WEIGHTS
Weight PAMP DS SS
CSM 2 2 1
smDC 0 0 3
smDC 2 1 -3
Based on a given sampling ratio s, each data instance is associated with s randomly selected DCs from the develop-ment DC pool. A migration threshold is pre-defined by the user, which is used to limit the time spent on sampling the data by a DC. The concentration of CSM for each selected DC is computed and compared with the pre-defined migration threshold θm. If the CSM concentration of a DC is greater than the migration threshold, the DC is moved from the development pool to the migrated DC pool, and the removed DC is replaced by a newly initialized one such that the population in the development DC pool is fixed.
3) Context Assessment: In this phase, the contexts of the DCs in the migrated pool are determined. The DCA processes its three input signals to get two cumulative output signal values of smDC and mDC using the signal processing as stated in Equation 1. If a data instance collected by a DC has a greater mDC value than the smDC value, then the data instance is assigned a binary value of 1; otherwise, 0 is assigned.
4) Classification: All the data instances (or antigen) asso-ciated with the migrated DCs are analysed and the Mature Context Antigen Value (MCAV) for each data instance (i.e., antigen) is derived. The MCAV is used to assess the degree of anomaly of a given data instance. For a given data instance, its MCAV value is calculated by dividing the number of times the data instance found in the mature context to the total number of associations with migrated DCs. A pre-specified MCAV threshold is derived from the testing dataset, which is the division of the total number of data instance labelled with abnormal by the total data items in the dataset. Data instances with greater MCAVs than the anomaly threshold are classified as anomalous while the others are classified as normal.
Upon migration, Every DC evaluates the total data items it has sampled in either smDC or mDC context. Greater data items with mDC results into DC-context of 1, otherwise 0.
III. DCAWITHOPTIMISEDPARAMETERS
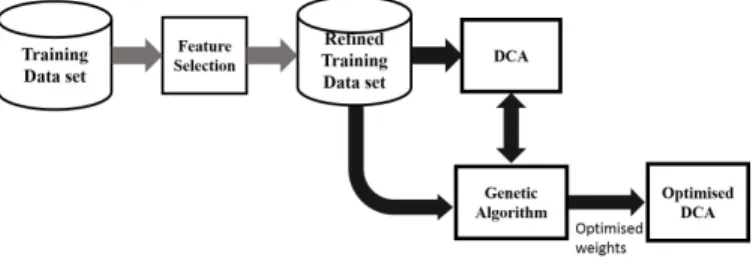
The parameters as shown in Table I used in Equation 1 by the DCA are usually specified by users, which might not lead to the optimal performance. In this work, GA is used to search for an optimal set of parameters based on the testing dataset which is used by the DCA in learning the thresholds. The framework of the proposed system is illustrated in Figure
Algorithm 1 DCA
input: datasetD, DC pool sizen, sampling ratios, migra-tion thresholdθm, anomaly-thresholdθc
output: benign or malignant for data items /** Pre-processing & Initialization phase**/ Create development DC poolPd withn DC cells Create migrated DC poolPmwith unlimited size signal categorization;
/** Detection phase**/ foreachdinD do
calculate the concentrations of CSM, mDC and smDC for1 tos do
randomly select aDC fromPd associatedwithDC ifcumulative CSM> θm then migrate DC create new DC end if end for end for
/*Context Assessment phase */ foreachDC inPmdo
ifcumulative smDC ≤cumulative mDCthen DC-context=1; else DC-context=0; end if end for /* Classification phase */ foreachdinD do calculate MCAV ifMCAV> θc then assign malignant else assign benign end if end for
1. For a given training dataset, the approach firstly performs feature selection, and only the most significant feature values are retained in the training data set. The selected features are categorised into three input signals namely PAMP, DS and SS, as introduced in the last section. Each data instance, which is modeled by an antigen in biology, is assigned an ID for identification by DCs. The training dataset in which each data instance associated with an ID is taken by the DCA and GA. Then, the GA searches for the optimal set of parameters, which is sent to the DCA for performing classification tasks. The comprising components of the proposed approach is detailed in the following subsections.
A. Feature Selection
When a given training dataset has a large number of features, it is necessary to select the most significant features to achieve the computational efficiency. The use of irrelevant
Figure 1. The proposed permater optimisation approach
or redundant features may cause two problems in the learning process [26]. The first one is an induction of greater compu-tational cost which slows down the performance of the DCA. Secondly, there is a higher chance of overfiting introduced by the irrelevant features. This work therefore applies feature selection first.
There are a number of methods available in the literature for performing feature selection tasks using statistics and machine learning approaches. In particular, this study adopts an entropy-based approach for feature selection. In this ap-proach, the information gain of each attribute is calculated first, which estimates the amount of information with respect to the classification that a particular attribute provides when the value of the attribute is known [27]. Given a sample dataset D, the information gain of an attributexcan be calculated as [28]:
G(D, x) =E(D)− X v∈V alues(x)
|Dv|
|D| ∗E(Dv), (2) whereV alues(x)represents the set of all the possible values that attributexmay take,Dvis a subset ofDthat the attribute xof each element takes valuev,Grepresents the information gain, and E is the Entropy.
Suppose there are two classification classes, the entropy E(D)in Equation 2 is defined as follows:
E(D) =
2 X
i=1
−pi∗log2pi, (3) where pi is the probability of D belonging to classi. After evaluating the information gain of each attribute, a number of significant attributes can be selected. A refined training data set is then formed by taking only the selected features, which is then utilized by the DCA and the GA as detailed below. B. Parameter Optimization by GA
The GA uses operations inspired by biological evolution, such as selection, mutation, crossover, and reproduction, for search and optimization problems. A GA algorithm starts with a population of individuals which are often randomly generated, and the population evolves from one generation to another through evolution operations. In this work, the GA is employed to produce an optimal set of weights for the weighted sum equation as expressed in Equation 1, such that
the DCA can have the best classification accuracy. The pre-defined weights as shown in Table I include nine entries. The nine entries are used to calculate the interim cumulative output values for the concentrations of CSM, smDC and mDC from the three input signals PAMP, DS and SS from the pool of the migrated DCs.
The proposed parameter optimization system is outlined in Algorithm 2. The algorithm firstly randomly generate a num-ber of individuals to form the population, and each individual is 9 number which suppose to represent the 9 weights in Table I. Then the fitness of each individual is evaluated using a fitness function. The fitness function in a GA algorithm drives the search process towards the location of the best solution based on the current solution and the training data set. In this work the fitness function is defined as the accuracy of the DCA based on the training datasetD.
Suppose that individual i is formed by 9 weights (w0, w1, ..., w8), which are fed into the DCA in calculating the interim outputs using Equation 1. The nine weights are divided into three groups to support CSM, smDC and mDC respectively, wherew0,w3andw6are used for the calculation for the PAMP signal,w1,w4andw7 are for DS signals, and w2,w5andw8are for SS signals. In this work, the migration threshold for the DCA is set to 10, and each data items are allowed to be sampled by 10 DCs. The accuracy computed by DCA, which is the fitness of individual i is then forwarded back to the GA.
Algorithm 2 DCA parameter optimization input: the dataset D
output: the optimized weights Population initializationP;
foreach individualiin the population do
fitness evaluation which is the accuracy led by the DCA using the weights represented byi;
end for
whiletermination condition is not metdo selection
crossover mutation
foreach modified individualsdo
fitness evaluation which is the accuracy led by the DCA using the weights represented byi;
end for
next generation formation end while
return the best individual
Based on their fitness values, a number of individuals are selected for reproduction, which is implemented in this work by the fitness proporionate selection approach, or the roulette mechanism [29]. The higher the accuracy of an individual is, the higher the probability of it being selected for reproduction. Once a number of parents are selected, they then breed some individuals for the next generation using the genetic opera-tors corssover and mutation. In particular, crossover swaps
contiguous parts of genes of two individuals to produce two new individuals that are added to the population poll. More precisely, for each pair of the selected individuals, a crossover point is chosen randomly and the tails of its parents’ weights are swapped to get two new individuals to be added to the new generation. Note that there are a number of crossover operators available for use, but the simplest single point crossover approach is adopted in this work.
In order to ensure genetic diversity within the population, the second genetic operator mutation is applied. Mutation alters one gene value in a chromosome from its initial state. A pre-defined mutation rate is used to control the percentage of occurrence of mutations. In this work, the mutation rate is set to 5%. Mutation rate is set to a low value in order to make sure that, individuals do not converging to the local minima while it speeds up identification of individual which can generate the optimal accuracy. The fittest individuals with best weights of each generation are allowed to pass automatically to the next generation to ensure that the better combination of weights will be preserved.
The selection and reproduction processes are iterated until a pre-specified a termination is satisfied. The termination condition can be in one of the two situations: 1) the optimal fitness accuracy has not been reached for the population but the GA does not produce any further better classification accuracy for a number of generations, and 2) an optimal accuracy level is realized when the generated weights produce greater classification accuracy than the target accuracy. Subsequently, the final combination of the fittest individual, i.e., the optimal set of weights, is sent to the optimized DCA for performing classification tasks.
IV. EXPERIMENTATION
The KDD99 data set was used in the experimentation for system validation and evaluation.
A. The Dataset and Performance Measurement
KDD99 is an intrusion detection dataset [5], the goal of which was to build a network intrusion detector as a predictive model with an ability of distinguishing between bad (intrusion or attack) and good (normal) network connections. There are four attacks categories in the KDD99 dataset which affect a large number of networked devices globally daily, which are: 1) DOS: Denial of service attacks which attempt to shut down the system to make it inaccessible to its intended users, such as SYN flooding, teardrop and smurf attack. 2) Probes: An attempt of gaining access to a computer and its files by exploiting the weak points available through surveillance and other probing techniques, e.g. port scanning.
3) U2R: Unauthorized attempt to gain super user priv-ileges by exploiting vulnerabilities that allow normal user to gain a root privileges, e.g. buffer overflow and rootkit attacks.
4) R2L: Unauthorized access of a computer resources from a remote machine, e.g. password guessing and ftp write attacks.
For computational efficiency, this study was carried out based on the 10% of the KDD99 training data set, which was a common practice in a number of studies, such as [22], [30]. This data set consist of 494,021 records among which 97,277 (19.69%) are normal, 391,458 (79.24%) DOS, 4,107 (0.83%) Probe, 1,126 (0.23%) R2L and 52 (0.01%) U2R connections. Each connection has 41 attributes describing different features of the connection and labeled as either normal or an anomaly (attack). The 41 features can be classified into four groups [27]:
1) Basic features: This class consists of all features that can be extracted from a TCP/IP connection.
2) Time-based Traffic Features: These features are used to capture properties that mature over a 2 seconds temporal window, such as the number of connections to the same host over the 2 second interval.
3) Host-based Traffic Features: These features use a his-torical window estimated over a number of connections instead of time for example 100. The attacks which span intervals longer than 2 seconds are analysed using these features.
4) Content features: The payload of the original TCP packets is analysed based on the domain knowledge. Example of these features include the number of failed login attempts.
For any IDS, the network traffic classification results may fall in one of the following classes:
• True Positive (TP): The IDS system is able to identify an intrusion that is being performed and it is actually an attack.
• True Negative (TN): The IDS system classifies an activity as acceptable and it is real acceptable behavior.
• False Positive (FP): The IDS identifies an activity as an attack but the activity is acceptable behavior.
• False Negative (FN): The IDS notifies an activity as acceptable while it is actually an attack. This is the most dreadful one.
To evaluate the performance of the proposed approach, for each experiment, the rates of True Positive (TPR), False Negative (FNR), False Positive (FPR) and True Negative (TNR) are calculated in addition to the total accuracy. These parameters can be determined as follows: TPR=TP/(TP+FN), TNR=TN/(TN+FP), FPR=FP/(TP+FN), FNR=FN/(TN+FP), and the Total Accuracy(TA)=((Number of correctly classified data items)/(Total number of items))*100.
B. Experiment Setup
All experiments are performed on a laptop with Intel Core i5 6200U 2.4GHz - 8GB RAM-HP running windows 8. Both DCA and GA algorithms are implemented in Java using NetBeans IDE.
After evaluating the information gain of each attribute from KDD99 dataset, twelve attributes are selected to form the three input signals categorised as follows:
• PAMP: serror rate, srv serror rate, same srv rate, dst host serror rate, dst host rerror rate, rerror rate and srv rerror rate.
• DS: count and srv count.
• SS: logged in, srv different host rate and dst host count.
Data instance (i.e., antigen in biology terminology) IDs are created by combining three nominal attributes, which are protocol, service and flag as used by [22]. This helps to trace a particular data item in the system since one antigen is processed by multiple DCs at the same time, in both the development and migration pools, and antigen ID also helps during the MCAV evaluation process.
To determine the value of each signal category, all selected attributes are normalized into the range of 0 to 1 using max-min normalization. Then the values of each signal category is equal to the average of all attributes that form this signal. Sub-sequently these values are combined with the corresponding antigens and become the inputs to the DCA.
The development pool has a population of 100 DCs, and each data instance can be sampled by 10 DCs. The DC migration threshold is set to 10. To perform classification of data instances, a threshold (anomaly threshold) is applied to the MCAVs. The anomaly threshold is calculated by dividing the number of anomaly data items (396743) present in the 10% of KDD99 dataset by number of the total data items (494021). The anomaly threshold is set to 0.8. The MCAV value is used to assess the degree of anomaly of a given data instance. Hence, if the MCAV value is greater than the anomaly threshold (0.8), the data instance is classified as anomalous, otherwise classified as normal. For each data instance, the MCAV value is computed by dividing the total number presented as an anomalous by the total number of presentations in DCs.
Three experiments were conducted. The first experiment (Basic DCA) used 10% of the KDD99 dataset and the basic DCA with the pre-defined weights as specified in Table I. The experimental results are shown in table III on the Basic DCA row. The second experiment (GA-DCA optimization) employed the proposed approach for perimeter optimization based on 1% of the KDD99 dataset. As the DCA requires a considerable amount of time to process 10% of KDD99 dataset (about 3 minutes), only 1% of the KDD99 dataset was used for the GA optimization process. Subsequently, 10% of KDD99 dataset and the basic DCA were used to compute the total accuracy of the final fittest individual’s weights.
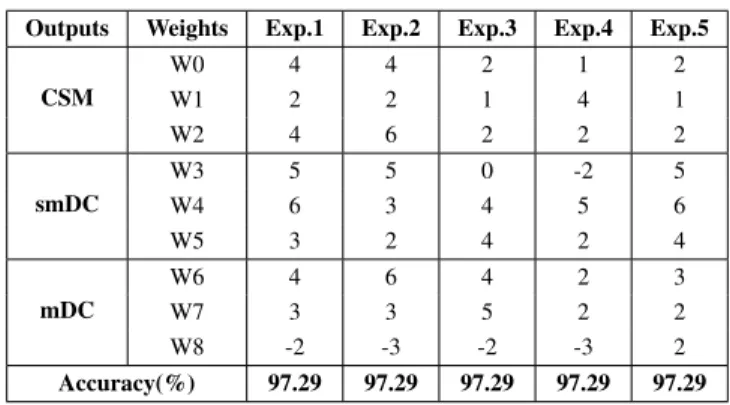
The resulted optimal parameters are shown in Table II. The experiment was repeated five times. Although different optimal parameters are produced every time, but the same training accuracy was always generated for the five times (97.29%) as listed Table II. Interestingly, these weights also led the same TPR, FPR, TNR and FNR.
Table II
THE ACCURACY FOR THE FIVE REPEATED TRAINING
Outputs Weights Exp.1 Exp.2 Exp.3 Exp.4 Exp.5
CSM W0 4 4 2 1 2 W1 2 2 1 4 1 W2 4 6 2 2 2 smDC W3 5 5 0 -2 5 W4 6 3 4 5 6 W5 3 2 4 2 4 mDC W6 4 6 4 2 3 W7 3 3 5 2 2 W8 -2 -3 -2 -3 2 Accuracy(%) 97.29 97.29 97.29 97.29 97.29
The third experiment (Validation) was performed using the optimal parameters generated by the GA on a different 10% of the KDD99 dataset, to validate the proposed system. This experiment was performed to make sure that the best optimal set of weights depend neither on the GA nor on the training dataset when using the DCA alone after the training phase. The experimental results are shown in Table III on the Validation row.
Table III
CLASSIFICATION ACCURACY ON TESTING DATASET
TPR FPR TNR FNR TA
Accuracy (%) Basic DCA 92.71 7.27 93.07 6.93 92.78 Validation 98.52 1.48 92.29 7.71 97.29
C. Results Analysis and Comparison
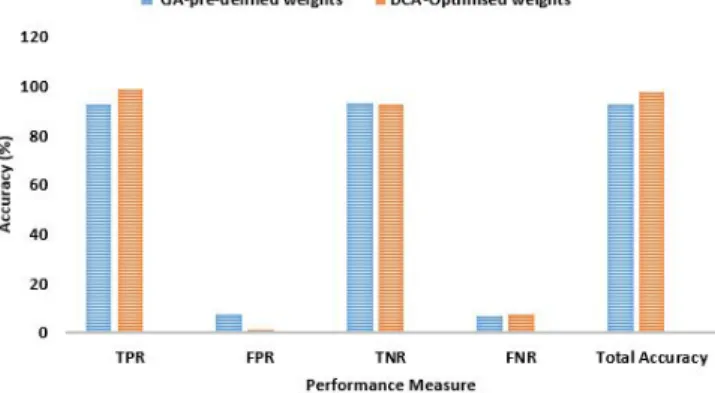
The experiments evaluated the proposed system and com-pared it with the traditional one using the pre-defined weights. The power of the proposed system is confirmed by the experi-ments with the results presented in Table III and Figure 2. The weights generated using the GA optimization generally led to higher total classification accuracy (97.29%) compared to the pre-defined weights (92.78%). This indicates an improved percentage of successful classified data items by 4.51%. Also the true positive rate is increased from 92.71% to 98.52%, indicating a positive improvement of 5.81%. Comparing with the results by other studies attempted to use DCA and 10% of KDD99 dataset, the results led by the proposed approach are also better. For instance,, the total classification accuracy reported in [22] is 86.88%. The work of [30]uses the GA to optimize the probabilities of SS and DS (i.e., p safe and p danger), the total accuracy recorded is 95.23%.
Unfortunately, for True Negative and False Negative rates, the proposed approach has shown less positive results. True negative rate is decreased by 0.78% whilst false negative rate is increased by the same magnitude. This needs to be further investigated in determining how to configure the GA in such a way that it can search for the best weights without negatively affecting the rest of other classification parameters.
Figure 2. Classification Accuracy
Note that after determining the optimal weights, the basic DCA is used without altering its basic implementation, run-ning time or computational required. More importantly, the GA is only utilised during the model optimisation process, so the fast online performance of classical DCA, as one of its most important advantages, is not affected or influenced by the GA in its implementation.
V. CONCLUSIONS
This paper proposes an approach for parameter optimisation for the DCA algorithm by employing the popular AI tool GA. As the GA is only used during the training stage to generate the optimal set of weights and therefore no large computational effort is imposed against the benefits of DCA (i.e., fast online in-time performance). Additionally, this approach does not have any dependency on the training dataset after getting the best weights as demonstrated in the third experiment, so the quality of the original DCA is not compromised. The experimental results shown that the proposed approach is very efficient in terms of true positive, false positive and the overall classification accuracy, although further investigation is required for the improvement on true negative and false negative rates. This initial work can be furthered developed to adaptively derive weights from data stream in real time. Moreover, the proposed approach needs to be further validated using larger scale data sets.
REFERENCES
[1] Uwe Aickelin, Peter Bentley, Steve Cayzer, Jungwon Kim, and Julie McLeod. Danger theory: The link between ais and ids?Artificial immune systems, pages 147–155, 2003.
[2] Polly Matzinger. The danger model: a renewed sense of self. Science, 296(5566):301–305, 2002.
[3] Julie Greensmith, Uwe Aickelin, and Jamie Twycross. Articulation and clarification of the dendritic cell algorithm. Artificial immune systems, pages 404–417, 2006.
[4] John H Holland. Genetic algorithms.Scientific american, 267(1):66–73, 1992.
[5] KDD Cup 1999 Data. ”http://kdd.ics.uci.edu/databases/kddcup99/ kddcup99.html/. Accessed: 2017-12-13.
[6] Rebecca Bace and Peter Mell. Nist special publication on intrusion detection systems. Technical report, BOOZ-ALLEN AND HAMILTON INC MCLEAN VA, 2001.
[7] Stuart Staniford, James A Hoagland, and Joseph M McAlerney. Practical automated detection of stealthy portscans.Journal of Computer Security, 10(1-2):105–136, 2002.
[8] Longzhi Yang, Fei Chao, and Qiang Shen. Generalized adaptive fuzzy rule interpolation.IEEE Transactions on Fuzzy Systems, 25(4):839–853, 2017.
[9] Longzhi Yang and Qiang Shen. Closed form fuzzy interpolation.Fuzzy Sets and Systems, 225:1–22, 2013.
[10] Nitin Naik, Ren Diao, and Qiang Shen. Dynamic fuzzy rule interpolation and its application to intrusion detection. IEEE Transactions on Fuzzy Systems, 2017.
[11] Anna L Buczak and Erhan Guven. A survey of data mining and machine learning methods for cyber security intrusion detection. IEEE Communications Surveys & Tutorials, 18(2):1153–1176, 2016. [12] Jungwon Kim, Peter J Bentley, Uwe Aickelin, Julie Greensmith, Gianni
Tedesco, and Jamie Twycross. Immune system approaches to intrusion detection–a review. Natural computing, 6(4):413–466, 2007.
[13] Longzhi Yang, Jie Li, Gerhard Fehringer, Phoebe Barraclough, Graham Sexton, and Yi Cao. Intrusion detection system by fuzzy interpolation. InFuzzy Systems (FUZZ-IEEE), 2017 IEEE International Conference on, pages 1–6. IEEE, 2017.
[14] Jie Li, Longzhi Yang, Yanpeng Qu, and Graham Sexton. An extended takagi–sugeno–kang inference system (tsk+) with fuzzy interpolation and its rule base generation.Soft Computing, pages 1–16, 2017. [15] Ian R. Tizard. Immunology: An Introduction. Saunders College Pub.,
1995.
[16] Dipankar DasGupta. An overview of artificial immune systems and their applications. InArtificial immune systems and their applications, pages 3–21. Springer, 1993.
[17] Stephanie Forrest, Alan S Perelson, Lawrence Allen, and Rajesh Cherukuri. Self-nonself discrimination in a computer. InResearch in Security and Privacy, 1994. Proceedings., 1994 IEEE Computer Society Symposium on, pages 202–212. Ieee, 1994.
[18] Jungwon Kim and Peter J Bentley. An evaluation of negative selection in an artificial immune system for network intrusion detection. In
Proceedings of the 3rd Annual Conference on Genetic and Evolutionary Computation, pages 1330–1337. Morgan Kaufmann Publishers Inc., 2001.
[19] Julie Greensmith, Uwe Aickelin, and Steve Cayzer. Introducing dendritic cells as a novel immune-inspired algorithm for anomaly detection. In
ICARIS, volume 3627, pages 153–167. Springer, 2005.
[20] Polly Matzinger. An innate sense of danger. InSeminars in immunology, volume 10, pages 399–415. Elsevier, 1998.
[21] Uwe Aickelin and Steve Cayzer. The danger theory and its application to artificial immune systems. arXiv preprint arXiv:0801.3549, 2008. [22] Feng Gu, Julie Greensmith, and Uwe Aickelin. Further exploration of the
dendritic cell algorithm: Antigen multiplier and time windows.Artificial immune systems, pages 142–153, 2008.
[23] Zeineb Chelly and Zied Elouedi. Fdcm: A fuzzy dendritic cell method. InICARIS, volume 2010, pages 102–115. Springer, 2010.
[24] Zeineb Chelly and Zied Elouedi. Hybridization schemes of the fuzzy dendritic cell immune binary classifier based on different fuzzy cluster-ing techniques.New Generation Computing, 33(1):1–31, 2015. [25] Zeineb Chelly and Zied Elouedi. A survey of the dendritic cell algorithm.
Knowledge and Information Systems, 48(3):505–535, 2016.
[26] Alan Jovi´c, Karla Brki´c, and Nikola Bogunovi´c. A review of feature selection methods with applications. InInformation and Communica-tion Technology, Electronics and Microelectronics (MIPRO), 2015 38th International Convention on, pages 1200–1205. IEEE, 2015.
[27] H G¨unes Kayacik, A Nur Zincir-Heywood, and Malcolm I Heywood. Selecting features for intrusion detection: A feature relevance analysis on kdd 99 intrusion detection datasets. InProceedings of the third annual conference on privacy, security and trust, 2005.
[28] Ryszard S Michalski, Jaime G Carbonell, and Tom M Mitchell.Machine learning: An artificial intelligence approach. Springer Science & Business Media, 2013.
[29] Noraini Mohd Razali, John Geraghty, et al. Genetic algorithm perfor-mance with different selection strategies in solving tsp. InProceedings of the world congress on engineering, volume 2, pages 1134–1139. International Association of Engineers Hong Kong, 2011.
[30] Jo˜ao Lima Santanelli and Fernando Buarque de Lima Neto. Network intrusion detection using danger theory and genetic algorithms. In In-ternational Conference on Intelligent Systems Design and Applications, pages 394–405. Springer, 2016.