CUSTOMIZED RANKING BY USER PREFERENCE USING LRR MODEL
BY
BO-YU CHIANG
THESIS
Submitted in partial fulfillment of the requirements for the degree of Master of Science in Computer Science
in the Graduate College of the
University of Illinois at Urbana-Champaign, 2015
Urbana, Illinois Adviser:
ABSTRACT
In this thesis, we proposed a customized ranking system that can rank all the entities given a specific user preference. Rank entities by user’s preference is an inevitable strategy of saving user’s time browsing and extracting useful information from Internet. Modern websites always rank these entities by a single numeric value computed by averaging overall rating, but this ranking scheme is of limited use to users.
With di↵erent aspect preference, it is obvious that the restaurants ranking should be di↵erent based on their famous features, e.g., service, environment, price. We used the LRR (Latent Rating Regression) model to aggregate restaurants aspect score and proposed two ranking approaches. The experi-ment results show that the two ranking approaches are both better than the baseline ranking approach.
TABLE OF CONTENTS
CHAPTER 1 INTRODUCTION . . . 1
CHAPTER 2 METHODOLOGY . . . 3
2.1 LARA . . . 3
2.2 Latent Rating Regression Model Inference and Estimation . . 4
2.3 Ranking Strategies . . . 8 CHAPTER 3 EXPERIMENTS . . . 11 3.1 Data Set . . . 11 3.2 Experiment Setting . . . 12 3.3 Experiment Result . . . 13 CHAPTER 4 CONCLUSION . . . 16 REFERENCES . . . 17
CHAPTER 1
INTRODUCTION
With the rapid growing Internet, people are willing to express their opinions and emotions on the web. The reviews of a product are an important refer-ence for new coming customers to make their decisions. Although there are so many websites collecting the reviews of a specific entity, like restaurant or hotel, the searching criteria do not always exactly express what users want because of two reasons. First, these websites such as Yelp1 only provide ob-jective features, such as can we order online or can we take out, as filters. Second, they rank the rest of the entities simply based on the average rat-ings and number of reviews. This approach is not very practical for some groups of users, for example, students and office workers may be interested in di↵erent aspects, including, price, atmosphere, and location. Users have to read reviews after the ranking result to make a decision, but it is would be time-consuming and would have bias in mind while reading the detailed reviews content.
In this thesis, we extend Hongning Wang’s work [1] of solving Latent As-pect Rating Analysis problem. We compute restaurants asAs-pect rating by aggregating aspect rating of reviews with respect to the specific restaurant. After that, we can rank all the restaurants given any user preference by two di↵erent approaches. The first approach ranks all of the restaurants by the inner-product of user’s aspect preference vector and restaurant’s aspect
ing vector. The second approach ranks by collecting the opinion of other users with similar preference. The experiment results show that the two ranking approaches are both better than the baseline ranking approach.
Several research work studied opinion summarization[2, 3, 4, 5, 6, 7]. Hu and Liu [8] proposed a comprehensive paper for mining products on web and sentiment analysis reviews to provide an aspect-level summary. Lu et al. [9] proposed decomposing an overall rating to several aspect rating, but this work is mainly focusing on short comments like eBay seller’s feedback, which is less than 10 words. Decomposing an overall rating into several aspects weighting are also implemented in [10]. This work used Good Grief algorithm [11] and focusing on common adjectives
This thesis is organized as follows. In Chapter 2 we first introduced LARA problem and LRR model. After that, I will illustrate our two ranking ap-proaches. In Chapter 3 we compare our proposed approaches to baseline approach. In Chapter 4 concludes the limitations and possible future works.
CHAPTER 2
METHODOLOGY
For the completeness of this paper, We will introduce the definition of LARA problem and then discuss LRR model[1], which can solve LARA efficiently. At the end of this chapter, we will illustrate how to extend this approach to customize restaurant recommendation.
2.1 LARA
As a review-mining problem, the input of LARA is a set of reviews of a specific entity with the overall rating of each review. First, we want to know the latent aspect of this specific entity. Second, we want to analyze: 1) reviewer’s degree of emphasis in each aspect. 2) reviewer’s degree of satisfactory in each aspect.
Formally, the input reviews can be represented as D = d1, d2,· · · , d|D| , wherediis the i-th review text to describe the specific entity. Each review has its own overall rating r1, r2,· · · , r|D| , where ri is the rating of text di, and its corresponding entity label l1, l2,· · ·, l|D| , whereli is the entity index of di. The expected output of LARA are the following three information:
Latent aspect: Aspects of the entity A = {A1, A2,· · · , Ak}, which is commonly mentioned from input reviews. For example, if the entity is a restaurant, the aspects might be ”price”, ”service”, ”environment”. However, if the entity is a hotel, the aspects might be ”price”, ”room”, ”cleanliness”,
and ”location”.
Aspect rating: For all the reviews in input D, the aspect rating sd is a k-dimemtional vector. The i-th value of sd is a numeric value, which is the degree of satisfaction of aspect Ai specified by the reviewers.
Aspect weight: For all the reviews in input D, the aspect weight ↵d is a k-dimensional vector. The i-th value of↵dis a numeric value, which indicates the degree of emphasis the reviewer focused on this review of aspect Ai.
Briefly, the goal of LARA is to know the latent aspect weight and latent aspect rating of each review based on the content and overall rating. We can make full use of the result of LARA to provide customized ranking of specific entity.
2.2 Latent Rating Regression Model Inference and
Estimation
2.2.1 Inference
LRR first runs a boot-strapping algorithm to obtain a word-frequency matrix Wd for each review, where Wd
i,j is the normalized frequency of word wj in review d assigned to aspect Ai.
To infer the value of ↵d and sd, we made some assumptions. First, The aspect rating si is obtained by linear combination of Wd
i and i si = n X j=1 ijWijd (2.1)
where i,j is the sentiment polarities of word wj on aspect Ai.
distribution.
↵d ⇠N(µ,⌃) (2.2)
where µand ⌃ are the mean and variance.
Finally, we can roughly compute the overall rating by weighted sum of ↵d and sd ↵Tdsd = k X i=1 ↵disi (2.3)
We make another assumption that the overall rating is drawn from a Gaussian distribution with mean ↵T
dsd and variance 2. rd ⇠N( k X i=1 ↵di n X j=1 ijWdij, 2) (2.4)
The graphical representation of LRR is shown in Figure 2.1
Figure 2.1: Graphic representation of LRR Therefore, the probability of rating of a review is given by:
P(r|d) =P(rd|µ,⌃, 2, , Wd) = Z p(↵d|µ,⌃)p(rd| k X i=1 ↵di n X j=1 ijWdij, 2)d↵d (2.5)
In order to compute the value ↵d in each review, we use the maximum a posteriori(MAP) estimation to compute the most probable ↵d for each given review. The objective function of MAP estimation is:
L(d) =log(p(↵d|µ,⌃)p(rd| k X i=1 ↵di n X j=1 ijWdij, 2)) (2.6)
Equation 2.6 is equivalent to maximize the following function with respect to ↵d ↵d= arg max ↵ L(↵d) = arg max↵ ⇢ (r ↵T dsd)2 2 2 1 2(↵d µ) T⌃ 1(↵ d µ) (2.7) We can solve it by setting the derivatives with respect to ↵d to zero.
(r ↵T dsd) 2 sd ⌃ 1(↵ d µ) = 0
2.2.2 Model estimation
We already know how to infer sd by equation (2.1) and infer ↵d by equation (2.7) given model parameter ⇥ = (µ,⌃, , 2). Now we need to find the optimal ˆ⇥that maximizes the probability of observing all the overall rating of all reviews. We will use EM algorithm to iteratively updates the inferred valuable and model parameters until converged. The log-likelihood function of the whole set of reviews is:
L(D) =X d2D L(d) =X d2D logp(rd|µ,⌃, 2, , Wd) (2.8)
and the Maximum Likelihood Estimation is: ˆ ⇥= arg max ⇥ X d2D logp(rd|µ,⌃, 2, , Wd) (2.9)
First, we randomly initialize model parameters ⇥0 = (µ0,⌃0, 0, 02)
E-Step: For each review, computesdby equation (2.1) and↵dby equation (2.7)
M-Step: Compute ⇥t+1 by maximizing the probability of observing ↵d and sd
From equation (2.9), we know:
µ(t+1) = arg max µ L(µ) = arg maxµ ( 1 2(↵d µ) T⌃ 1(↵ d µ)) (2.10) dL(µ) dµ = X d2D 2⌃ 1(↵d µ) = 0 µ(t+1) = 1 |D| X d2D ↵d (2.11)
We can then derive ⌃(t+1) by definition of covariance matrix:
⌃(t+1) = 1 |D| X d2D (↵d µ(t+1))T⌃ 1(↵d µ(t+1))) (2.12)
To update 2 from equation (2.9), we know: 2 (t+1) = arg max2 L( 2) = arg max 2 |D|log 2 P d2D(rd ↵Tdsd)2 2 2 (2.13)
dL( 2) d 2 = |D| 2 + P d2D(rd ↵Tdsd)2 2( 2)2 = 0 2 (t+1) = 1 2|D| X d2D (rd ↵Tdsd)2 (2.14)
To update from equation (2.9), we know:
(t+1) = arg maxL( ) = arg maxX d2D (rd Pki=1↵di iTWdi)2 2 2 (t+1) (2.15)
In order to solve (t+1), we need to compute the inversion of |V|⇤ |V| matrix which is too inefficient. In Hongning’s paper, he applied a gradient-based method: dL( ) d i =X d2D ( k X i=1 ↵di iTWdi rd)↵diWdi
Therefore, we can update all the model parameters in M-step. We can train our model by repeating E-step and M-step until equation (2.8) converges.
2.3 Ranking Strategies
As we have showed in section 2.2, we can compute aspect rating and aspect weight of a given data set. We aggregate our reviews by restaurants so we can compute aspect rating for every single restaurant, denoted as sr, which is a k-dimension vector and r is the restaurant index.
2.3.1 Ranking by weighted sum score
Our first approach is to rank by inner product of restaurant aspect rating vector and given user aspect weight. Given a k-dimensional vector ↵, where Pk
i=1↵i = 1, which means the degree of emphasis of each aspect. We can compute the score of restaurant r.
vr = k X
i=1
sri↵i (2.16)
We can sort restaurant score in decreasing order to retrieve our ranking result.
2.3.2 Ranking by preference of similar user
Another approach is to retrieve the reviews of users with similar preferences first and we rank based on the opinions of these users. Given the aspect preference ↵. The steps are:
1. Select top 20% reviewers with the closest preference similarity
2. Rank the preferred restaurants by the rating given in their review. If rating are the same, we would rank by the number of votes of the review.
3. For closest user, we append the ranking of all restaurants which has highest rating(5 star)
4. Repeat step 3 for all the top 20% reviewers.
5. For closest user, we append the ranking of all restaurants which has highest rating(4 star)
6. Repeat step 5 for all the top 20% reviewers.
We append restaurants to ranking list until all restaurants appeared in reviews of top 20% user that rating is higher than or equal to 4 stars. If the restaurant is already in ranking list before we append, we discard it.
You can think the second approach is a collaborative filtering technique which predicts the interest of current user by collecting opinions of other users with similar preference.
CHAPTER 3
EXPERIMENTS
In this chapter, we first describe the data set and pre-processing we used. We, then, compute some measurement metrics of a single user of these three approaches. After that, we compute the mean average precision of several users. Finally, we will discuss the experiment results.
3.1 Data Set
We crawled reviews of 6451 restaurants from Yelp academic dataset1. Yelp provided more than two hundred types of businesses around 30 schools. A potential bias from Yelp academic dataset is that all the business entities are near universities or schools. It is very likely that most of reviews are written by students. We filter businesses other than restaurant and the details of our dataset are shown in Table 3.1
We define the aspects of restaurants are: environment, taste, price. We initialize our aspect seed words in Table 3.2. We also perform the pre-process, including removing stop word, converting words to lowercase and stemming
Table 3.1: Dataset Statistics Number of restaurants 6451
Number of reviews 263196
Number of users written reviews 107445 Number of vocabulary 31186
Table 3.2: Aspect seed words table Aspect seed words
Environment waiter waitress manager service manner Taste taste food drink appetizer meal entry dessert
flavor flavour delicious nasty Price money price value
words to its root words, proposed by Hongning’s work [1] .
An unavoidable difficulty in practical implementation is the data sparsity, which means not all the reviews have all the aspects we pre-defined. To overcome this issue, we aggregate our reviews by restaurants and review writers respectively depending on the approach we choose.
3.2 Experiment Setting
In order to evaluate the two ranking approaches proposed in 2.3, we need the following variables to rank.
Aspect rating of each restaurant: We can aggregate our reviews by restaurants so we can compute aspect rating for every single restaurants denoted as sr, which is a k-dimension vector and r is the restaurant index.
Aspect weight of each user: We can aggregate our reviews by users so we can compute aspect weight of every users denoted as ↵u, which is a k-dimension vector and u is the user index.
For all the reviewers who have more than 20 reviews, we take 75% as training set for our LRR model and 25% as our testing set. We use all the training dataset to train our model and compute the sr for all restaurants and ↵u for all users. The 25% testing set is the ground truth of relevant document. Compare the two approached with baseline algorithm, which rank all the restaurants by the average stars and number of reviews in academic
dataset.
3.3 Experiment Result
3.3.1 Ranking performance for single user
We first show some common evaluation metrics (Precision, Recall, F1 score, Average Precision) of users with most restaurant reviews in Table 3.3. The user with most restaurant reviews is John2, who has 187 reviews. The second user is A T.3, who has 146 reviews and the third user is Danan4, who has 122 reviews.
In general, both proposed approaches are better than the baseline ap-proach. Note that we compare these metrics at 1000 documents, which may seem to be too much to compare. That is because we got very few ground truth relevant restaurants comparing to the possible restaurants in our dataset. Even for the user with most reviews, we have only 46 ground truth restaurants. Therefore, we believe that 1000 is a reasonable number Table 3.3: Comparison between three approaches of users with top three review numbers
User id Method P@1000 R@1000 F1@1000 AP@1000
Baseline 0.003 0.064 0.006 0.0002
John Closest Preference 0.006 0.128 0.011 0.0019 Inner Product 0.005 0.106 0.009 0.0007
Baseline 0.003 0.081 0.006 0.0002
A T. Closest Preference 0.007 0.189 0.014 0.0079 Inner Product 0.006 0.162 0.012 0.0008
Baseline 0.003 0.097 0.006 0.0005
Danan Closest Preference 0.006 0.194 0.012 0.0026 Inner Product 0.009 0.290 0.017 0.0028
2http://www.yelp.com/user_details?userid=HUmClClluKP5Ur6X7e306Q 3http://www.yelp.com/user_details?userid=-iLH3Q2Wg4AMrNUXcgvliA 4http://www.yelp.com/user_details?userid=ouODopBKF3AqfCkuQEnrDg
for evaluation purpose.
3.3.2 Ranking performance for multiple user
To see the e↵ectiveness of our proposed approaches, we compute the MAP(Mean Average Precision), which has been shown to have good discrimination and stability in information retrieval area. The formula of MAP is:
M AP@n = 1 |Q| |Q| X j=1 1 m n X k=1 P re(k)⇤rel(k) (3.1)
where m is the number of relevant documents, |Q| is the number of queries and rel(k) is a indicator function equaling 1 if k-th ranked document is rele-vant and 0 otherwise.
Since more than 60% of Yelp users only write one review in our dataset, not so many user has more than 10 reviews. We measure users with more than 50 reviews, 75 reviews and 100 reviews. The number of users with corresponding number of reviews is listed in Table 3.4
Table 3.4: Number of users with number of reviews range number of reviews number of users
[100, 187] 11
[75, 100) 19
[50, 75) 74
[25, 50) 600
[1, 25) 106741
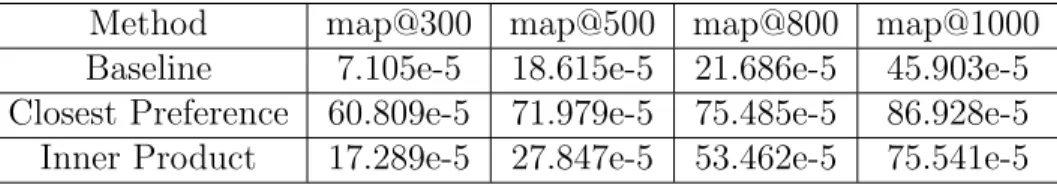
Because of the data sparsity we have mentioned in section 3.1, users with number of reviews less than 50 are hard to estimate the user aspect prefer-ence. The experiment results are shown in Table 3.5, 3.6 and 3.7. The closest preference approach is significantly better than the other two. Note that in the case which users with more than 50 reviews, the inner product approach
is worse than the baseline approach. That is because the overall rating is of considerable referential for the experiment of a large number for users. Table 3.5: Comparison between three approaches(users with more than 50 reviews)
Method map@300 map@500 map@800 map@1000
Baseline 49.011e-5 61.984e-5 65.803e-5 85.492e-5 Closest Preference 205.825e-5 220.468e-5 225.134e-5 237.394e-5
Inner Product 24.235e-5 35.652e-5 52.254e-5 64.936e-5
Table 3.6: Comparison between three approaches(users with more than 75 reviews)
Method map@300 map@500 map@800 map@1000 Baseline 9.416e-5 18.288e-5 20.474e-5 36.554e-5 Closest Preference 82.521e-5 90.709e-5 93.247e-5 101.192e-5
Inner Product 15.029e-5 27.069e-5 50.030e-5 68.215e-5
Table 3.7: Comparison between three approaches(users with more than 100 reviews)
Method map@300 map@500 map@800 map@1000 Baseline 7.105e-5 18.615e-5 21.686e-5 45.903e-5 Closest Preference 60.809e-5 71.979e-5 75.485e-5 86.928e-5 Inner Product 17.289e-5 27.847e-5 53.462e-5 75.541e-5
CHAPTER 4
CONCLUSION
In this thesis, we learned aspect rating vector for all the restaurants by Latent Rating Regression (LRR) model and proposed two approaches to rank. To prove the e↵ectiveness of our approaches, we learned the aspect weights of users in Yelp academic dataset and take one-fourth of user’s review as ground truth relevant document.
The experiments shows the two proposed approaches rank better than the baseline algorithm commonly used in the search engine market. Furthermore, the collaborative approach is significantly better than the other two. The advantage of my approaches for ranking is that we can compute restaurant aspect rating o✏ine, which is efficient for real-world application.
REFERENCES
[1] H. Wang, Y. Lu, and C. Zhai, “Latent aspect rating analysis on review text data: a rating regression approach,” in Proceedings of the 16th ACM SIGKDD international conference on Knowledge discovery and data mining. ACM, 2010, pp. 783–792.
[2] S. Morinaga, K. Yamanishi, K. Tateishi, and T. Fukushima, “Mining product reputations on the web,” in Proceedings of the eighth ACM SIGKDD international conference on Knowledge discovery and data mining. ACM, 2002, pp. 341–349.
[3] A.-M. Popescu and O. Etzioni, “Extracting product features and opin-ions from reviews,” in Natural language processing and text mining. Springer, 2007, pp. 9–28.
[4] B. Pang and L. Lee, “Opinion mining and sentiment analysis,” Foun-dations and trends in information retrieval, vol. 2, no. 1-2, pp. 1–135, 2008.
[5] H. D. Kim, K. Ganesan, P. Sondhi, and C. Zhai, “Comprehensive review of opinion summarization,” 2011.
[6] L.-W. Ku, Y.-T. Liang, and H.-H. Chen, “Opinion extraction, summa-rization and tracking in news and blog corpora.” in AAAI spring sym-posium: Computational approaches to analyzing weblogs, vol. 100107, 2006.
[7] X. Ding, B. Liu, and L. Zhang, “Entity discovery and assignment for opinion mining applications,” in Proceedings of the 15th ACM SIGKDD international conference on Knowledge discovery and data mining. ACM, 2009, pp. 1125–1134.
[8] M. Hu and B. Liu, “Mining and summarizing customer reviews,” in Pro-ceedings of the tenth ACM SIGKDD international conference on Knowl-edge discovery and data mining. ACM, 2004, pp. 168–177.
[9] Y. Lu, C. Zhai, and N. Sundaresan, “Rated aspect summarization of short comments,” in Proceedings of the 18th international conference on World wide web. ACM, 2009, pp. 131–140.
[10] A. Shen, “Aspect-specific ranking of product reviews using topic mod-eling.”
[11] B. Snyder and R. Barzilay, “Multiple aspect ranking using the good grief algorithm.” in HLT-NAACL, 2007, pp. 300–307.