Eye Tracking as an Automatic MT Evaluation Technique
Stephen Doherty* Sharon O’Brien* Michael Carl†
*
Centre for Next Generation Localisation School ofApplied Language and Intercultural Studies Dublin City University
†
Centre for Research and Innovation in Translation and Translation Technology Copenhagen Business SchoolAbstract
Eye tracking has been used successfully as a technique for measuring cognitive load in reading, psycholinguistics, writing, language acquisition etc for some time now. Its application as a technique for automatically measuring the reading ease of MT output has not yet, to our knowledge, been tested. We report here on a preliminary study testing the use and validity of an eye tracking methodology as a means of semi- and/or automatically evaluating machine translation output. 50 French machine translated sentences, 25 rated as excellent and 25 rated as poor in an earlier human evaluation, were selected. 10 native speakers of French were instructed to read the MT sentences for comprehensibility. Their eye gaze data were recorded non-invasively using a Tobii 1750 eye tracker. The average gaze time and fixation count were found to be higher for the “bad” sentences, while average fixation duration and pupil dilations were not found to be
substantially different between output rated as good or bad. Comparisons between BLEU scores and eye gaze data were also made and found to correlate well with gaze time and fixation count, and to a lesser extent with pupil dilation and fixation duration. We conclude that the eye tracking data, in particular gaze time and fixation count, correlate reasonably well with human evaluation of MT output but fixation duration and pupil dilation may be less reliable indicators of reading difficulty for MT output. We also conclude that eye tracking has promise as an automatic MT Evaluation technique.
Key words: MT evaluation, eye tracking, gaze time, fixation count, fixation duration, pupil dilation, BLEU scores
Introduction
In this paper we report on a preliminary study of the suitability of eye tracking methodologies for semi and/or automatically measuring the ease with which machine translation output can be read by humans. Eye tracking is a method which records a person’s eye movements across a screen as s/he is interacting with images or text on that screen. It has been used for many years to investigate different aspects of cognitive processing (e.g. reading, comprehension, bi-lingualism, cf. Rayner, 1998), of cognitive load (e.g. in route planning and document editing tasks, cf. Iqbal et al 2005), and for usability (e.g. in investigating the readability of online news as in the Stanford Poynter project). More recently, it has been used as a supplementary method along with keyboard logging and think-aloud protocols to investigate human translation processes in general, and, more specifically, cognitive processing load when working with Translation Memory tools
or interacting with sub-titled media (cf. O’Brien 2006, 2009, Caffrey 2009, Göpferich et al 2009). To the best of our knowledge, it has not yet been used in the evaluation of Machine Translation output.
The main assumption behind eye tracking is the so-called “eye-mind hypothesis” (Ball et al 2006), which assumes that when the eye focuses on an object, for example a sentence, the brain is engaged in some kind of cognitive processing of that sentence
In his extensive review of eye tracking research, Rayner (1998) summarises research findings that convincingly demonstrate that in complex information processing tasks, such as reading, there is a tight link between gaze and attention.
In eye tracking investigations of reading (e.g. Kaakinen & Hyönä, 2005, Hyönä and Nurminen, 2006) researchers typically measure the reading time, the number of “fixations” and the duration of these fixations to gauge how difficult the reading process is. “Fixations” are defined as “eye movements which stabilize the retina over a stationary object of interest” (Duchowski, 2003: 43). Fixations are usually measured in milliseconds and the more there are and the longer they are, the more difficulty the reader is assumed to be experiencing.
In addition to fixation measurements, cognitive load research typically also uses pupillometrics, i.e. measuring changes in the pupil diameter during task processing. Many studies have demonstrated reliable links between cognitive processing and changes in pupil dilation (e.g. Hess and Polt 1964, Nakayama et al 2002, Iqbal et al 2005). However, it is also the case that many other factors can influence pupil dilation (e.g. lighting, sounds, caffeine, colour of eyes etc.) and pupil dilation has sometimes been found not to correlate well with other eye tracking measurements of cognitive processing (Schultheis and Jameson 2004, O’Brien 2009, Caffrey 2009).
Our primary research questions were: To what extent does eye tracking data reflect the quality of MT output as rated by human evaluators? And, related to this question, could eye tracking potentially be used as an automatic measure of MT quality? While this research cannot be said to involve fully automatic evaluation of MT, it paves the way for the automatic and unobtrusive recording of MT reading effort, which could supplement or confirm other automatic evaluation metrics. Section 2 explains our methodology and Section 3 presents and discusses the results. Section 4 summarises our conclusions and outlines further possible research.
Methodology
A human evaluation was conducted on rule-based MT output from English to French for a previous study on Controlled Language and the acceptability of MT output (Roturier, 2006). In this evaluation, four human evaluators were asked to rate output on a scale of 1-4 where 4 signified “Excellent MT Output”, 3 signified “Good”, 2 “Medium” and 1 “Poor”. A full description of the evaluation criteria for that study is available in Roturier (2006). 25 of the lowest rated (denoted as ‘bad’ here) and 25 of the best rated sentences (denoted as ‘good’ here), according to four human evaluators, were selected from that corpus.
Since we had access to “gold” standards for the source text sentences, we calculated HTER scores with a view to testing correlations between HTER scores and
the eye tracking measures. It should be pointed out that the “gold” standards were not human translated, but post-edited versions of the raw MT output.
The number of sentences was deliberately small since our main goal was to test eye tracking as an MT evaluation methodology and not to rate the MT output. We assumed that the highest rated sentences would be easier to read than the lowest rated ones. Likewise, we assumed that the ease with which sentences could be read and understood influenced the scores given previously by the human evaluators, even though they were not asked to pay attention specifically to “reading ease”.
10 native speakers of French were recruited to read the machine translated sentences (12 were recruited and two were dropped out due to poor quality data). The sentences came from the domain of documentation describing virus checking software. The participants were not experts in this domain and this was a deliberate choice on our part since prior knowledge of a domain has been shown to ease the reading experience (Kaakinen et al 2003). By not having deep prior knowledge of the domain, we assumed that participants would have to make an effort to construct an internal representation of the meaning of each sentence and that the effort to do so would be higher for the ‘bad’ sentences and this would, in turn, be reflected in our measurements.
1
All participants were enrolled at the time of the study as full-time or exchange students at Dublin City University, some on translation programmes and others on business programmes.
.
The participants were first given a warm-up task. They were presented with 5 high quality sentences to read one by one. They were then presented with the test sentences in a random order (i.e. ‘bad’ and ‘good’ sentences were mixed, but presented in the same order for all participants) and participants were not aware that sentences had already been rated in a prior human evaluation task. They were asked to read the sentences for comprehension and, since motivation is an important factor in reading (Kaakinen et al. 2003), were informed that they would be asked some questions at the end to see if they had understood the text. The sentences were presented in a tool called Translog. Translog was originally developed for researching human translation processes (Jakobsen 1999), but has recently been altered to interface with an eye-tracker and other tools
developed within the EU-funded Eye-to-IT project (http://cogs.nbu.bg/eye-to-it/). The Translog
tool allows text to be displayed in a window in a similar fashion to other text editors. The participants pressed the “Return” key when they wanted to move to the next sentence and no time pressure was applied. The sentences were read in isolation to reflect psycholinguist experiments. As the focus here was on fluency, only the MT output was presented and not the reference translation, therefore, adequacy is not considered; this could perhaps allow for monolingual evaluation (see Conclusion).
We used the Tobii 1750 eye tracker to monitor and record the participants’ eye movements while reading. This eye tracker has inbuilt infra-read diodes which bounce light off the eyes. It records the position of the right and left eyes according to the X, Y coordinates of the monitor, as well as the length and number of fixations, gaze paths, and pupil dilations. During this study a fixation was defined as lasting at least 100 milliseconds. The Tobii 1750 is a non-invasive eye tracker (i.e. participants do not have to wear head mounted equipment or use head rests or bite bars) and it
compensates for head movement. While the non-invasive nature increases the validity of the online reading experience and, presumably, allows participants to behave more normally, the lack of control leads to some level of inaccuracy in the data. We attempted to compensate for this by using the retrospective think-aloud protocol method, as mentioned above. Experimental conditions such as distance from monitor, temperature, noise, lighting, and intake of caffeine were kept constant for all participants.
The analysis software we used to analyse the eye tracking data was ClearView (version 2.6.3). ClearView also produces an AVI (video file) of the reading session, which displays the eye movements and fixations for each participant overlayed on the text. This was played back to the participants immediately after the session in Camtasia Studio (screen recording software) and they were asked to comment on their reading behaviour. This commentary was recorded.
To conclude this section, the measures we were interested in included average gaze time, fixation count and duration per sentence and per character for the two sets of sentences, changes in pupil dilation for both sentence types and BLEU scores and their correlations with the eye tracking data. Our results are presented in Section 3.
Results
3.1 Gaze Time:
Gaze time is the period of time a participant spends gazing within an Area of Interest (henceforth AOI). For this study, the AOIs were defined around each sentence in order to allow for all possible data relating to the sentence to be captured (a minimum of 5cm radius around each letter/word) and to exclude unwanted data,
e.g. looking at the toolbar or clock. The total gaze time per participant, given in minutes, is presented in Figure 1; the average total was 5.23 minutes (median = 5.06):
P1 P2 P3 P5 P6 P7 P8 P9 P10 P11
Figure 1: Total Gaze Time for All Participants (in minutes)
It is interesting to note the highest values (P1, P10, and P6 respectively) correspond to the three participants who had a strong language/translation background and who appear to have paid more attention to the text in terms of grammar, spelling, agreements etc.
Figure 2 shows the average gaze time per segment across all participants in milliseconds. As hypothesised, the ‘bad’ segments had longer gaze times than the ‘good’ segments.
GT_Bad GT_Good 14,000 12,000 10,000 8,000 6,000 4,000 2,000
Figure 2: Average Gaze Time for Good & Bad Segments for All Participants (in milliseconds)
The average gaze time for good segments was 5124.7ms while that of the bad segments was higher at 7426.6ms. In other words, participants spent, on average, 45% more time looking at bad segments than good segments. Spearman’s rho suggests a medium strength negative correlation between gaze time and sentence quality (p= -.46, p<0.01).
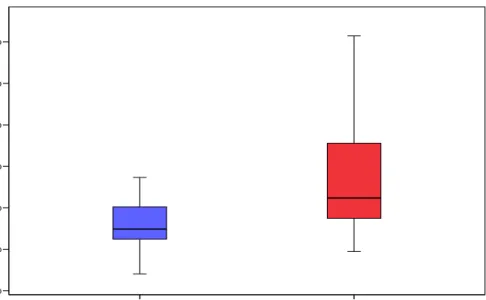
Obviously, some segments are longer than others. It therefore makes sense to examine the data according to the number of characters per segment. We first look at gaze time per character. As Figure 3 illustrates, a similar trend is evident in that the bad segments still had higher gaze time per character than the good segments. Additionally, when the average gaze time per character of all segments is taken into account (65.89 ms), we see that a majority of segments above this value were rated as bad (65% or 15 of 23).
GTPC_Bad GTPC_Good 150 125 100 75 50
Figure 3: Average Gaze Time for Good & Bad Segments per Character (in milliseconds across all segments)
3.2 Fixation Count:
Fixations occur when the eye focuses on a particular area of the screen. Fixations are defined according to the pixel radius and the minimum duration in milliseconds and the settings will vary depending on the object of study. In eye tracking studies of reading, in general, the pixel radius and minimum duration is lower than, for example, in usability studies. However, there is no general agreement on how fixations should be defined. For our study, we used a fixation filter of 40 pixels x 100 milliseconds, which is the filter used in the Eye-to-IT project.
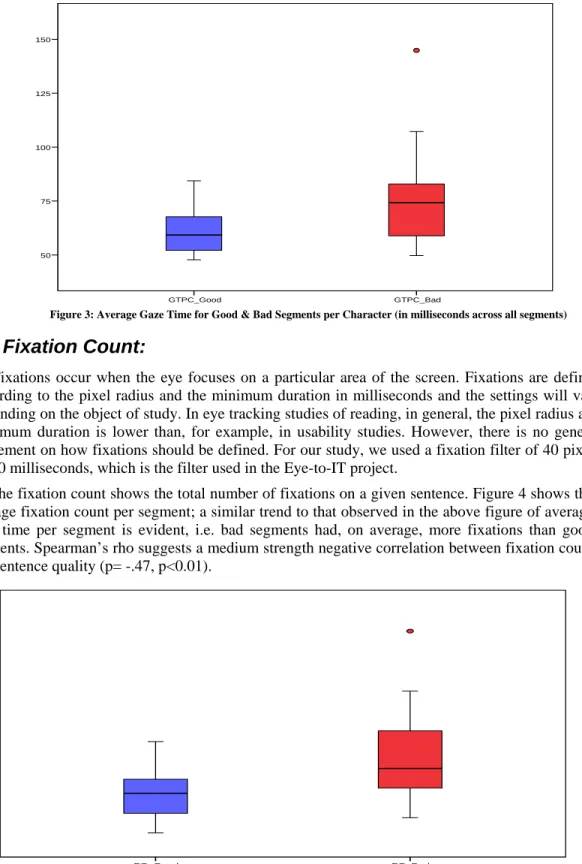
The fixation count shows the total number of fixations on a given sentence. Figure 4 shows the average fixation count per segment; a similar trend to that observed in the above figure of average gaze time per segment is evident, i.e. bad segments had, on average, more fixations than good segments. Spearman’s rho suggests a medium strength negative correlation between fixation count and sentence quality (p= -.47, p<0.01).
FC_Bad FC_Good 70 60 50 40 30 20 10
Figure 4: Average Fixation Count per Segment
When looking at the median (25.5) of the above average fixation count per segment we see that, out of the segments above the median, 8 segments were ‘good’, while 17 were ‘bad’.
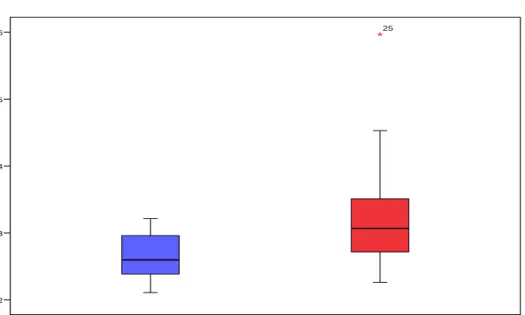
Moving on to fixation count per character, a similar and logical relationship to gaze time is observed. We see that, once again, the majority of the segments that had higher-than-average values were rated as bad (68% or 17 of 25). These results are shown in Figure 5:
FCPC_Bad FCPC_Good 0.6 0.5 0.4 0.3 0.2 25
Figure 5: Average Fixation Count for Good & Bad Segments per Character (in milliseconds across all segments)
3.3 Average Fixation Duration:
Average fixation duration has been used as an indicator of cognitive effort in many disciplines. When observing the average fixation duration across all segments and participants, it appears that the average fixation duration is quite similar in both good and bad segments, as Figure 6 illustrates:
FD_Bad FD_Good 280 260 240 220 200 180
Figure 6: Average Fixation Duration (milliseconds) for Good/Bad Segments for All Participants
The presence of several good segments among the bad segments in the highest range of values for average fixation duration is surprising. An “acclimatisation effect” has been noted before in eye tracking studies (O’Brien 2006), where the initial cognitive effort is higher than for the rest of the task. In light of this, we omit the first five segments to see what effect it has on our Fixation Duration data. Figure 7 demonstrates the effect:
FD2_Bad FD2_Good 260 240 220 200
Figure 7: Average Fixation Duration (ms) for All Participants from S6 to S50
As we can see, the elimination of the first five segments has some effect on differentiating the good and bad segments, though the difference overall is still limited. Overall, it appears that the above measures correlate, for the most part, with the segment ratings. While fixation duration per segment seems to be a reasonable indicator of good and bad MT output, when this measure is viewed per character, the trend is for bad segments to have shorter fixation durations than good ones and the differences were found to be non-significant. The suitability of this measurement for predicting good and bad MT output therefore requires further investigation. This lack of differentiation in fixation duration reflects other studies. For example, O’Brien (forthcoming) found no significant difference in fixation duration for texts that had been edited using controlled language rules and versions that were uncontrolled. Jakobsen and Jensen (2009) also found insignificant differences in fixation duration across groups in translation process research. Additionally, Van Gog et al (2009: 328) suggest that while fixation duration is a useful measure of cognitive processing, it may reflect “different aspects of cognitive load”.
3.4 Pupil Dilations
A further measure used to establish a relationship between textual difficulties and cognitive effort is average pupil dilation. On examining the initial results for all segments across all participants, a slight difference in average dilation between bad and good segments is observed – see Figure 8. Furthermore, an initial series of raised values is once again apparent, thus supporting the acclimatisation theory described earlier.
PD_Bad PD_Good 4.2 4.0 3.8 3.6
Figure 8: Average Pupil Dilation for Good and Bad Segments
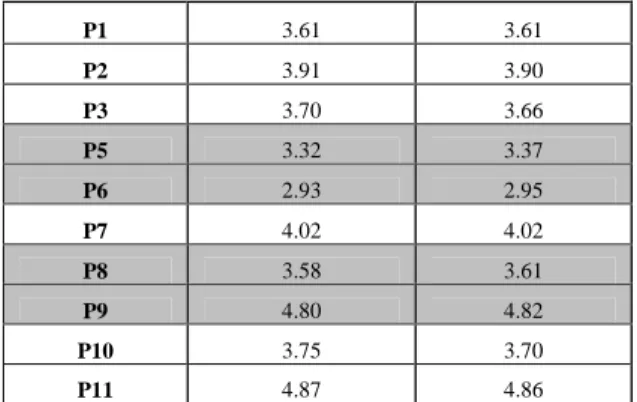
Given the difficulty in establishing a clear trend in pupil dilation across all participants, we move to examine pupil dilation on an intra-subject level motivated by the fact that pupil dilation can vary considerably from person to person (Table I).
Participant Good Segments Bad Segments
3.61 3.61 P1 3.91 3.90 P2 3.70 3.66 P3
Table I: Average Pupil Dilation for Each Participant for Good and Bad Segments
Table I illustrates that 4 of the participants had slightly higher dilation values for bad segments than good (grey shading) while 6 of them either had the same average dilation or had a higher dilation value for good segments when compared with bad segments.
P5 3.32 3.37 P6 2.93 2.95 4.02 4.02 P7 P8 3.58 3.61 P9 4.80 4.82 3.75 3.70 P10 4.87 4.86 P11
Our first conclusion could be that the pupil dilation measurement does not adequately reflect the higher level of cognitive processing we anticipate for bad segments. However, there are other plausible explanations. Perhaps the sentences were not differentiated enough on a “good/bad” axis for significant changes in pupil dilation to register for each sentence type? The results could also be explained by a latency effect in pupil dilation carrying over from bad to good segments for example. Or, indeed, it could be that the data set is too small to display significant differences between the two sentence types. However, given that others have repeatedly demonstrated an effect on pupil dilation by increased cognitive load (Rayner 1998), we suggest that further study of pupil dilation as a machine translation evaluation metric is required before coming to any concrete conclusions.
3.5 Correlations with HTER Scores
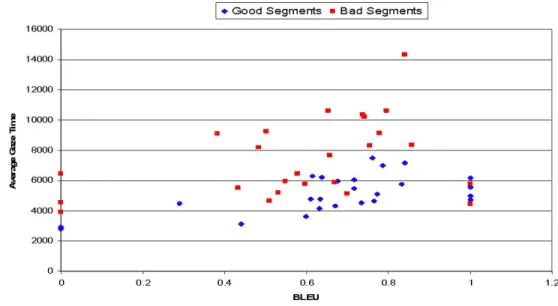
Firstly, it should be noted that for some of our sentences BLEU scores do not correlate well with the original human evaluation scores. Take S48 for example, “Pour désactiver et réactiver la Corbeille.”, although given a good rating by all human evaluators, was given a score of 0 by BLEU due to its variation from the reference “Pour désactiver la Corbeille et la réactiver.” We first look at gaze time per segment for good and bad segments across all participants and find a trend where bad segments had, on average, a lower BLEU score and resulted in longer gaze times, whereas good segments had higher scores and shorter gaze times (Figure 9). There are some anomalies, however, where some of the sentences with the highest gaze times also have relatively high BLEU scores, indicating that there can also be a mismatch between cognitive processing effort, measured via gaze data, and BLEU scores.
The trend is echoed in average fixation count and supports our earlier findings of a correlation between gaze time, fixation count and textual difficulties. Figure 10 shows that bad segments had higher fixation counts and lower BLEU scores, on average, compared to good segments, which had fewer fixations and higher BLEU scores (although anomalies still appear).
On examining the relationship of BLEU scores to average fixation duration and average pupil dilation we confirm our earlier findings in that fixation duration does not provide a clear enough difference between good and bad segments and that pupil dilation demonstrates a similar trend.
Conclusions
One of our initial questions for this study were: Can eye tracking be used in MT evaluation and would the eye tracking data reflect the quality of MT output as rated by human evaluators? We have shown that the gaze time and fixation count have correlated well with the previous evaluators’ judgments for the segments used here. The differences in fixation duration results for both sentence types were smaller, although this increases if we assume an acclimatisation effect and remove the initial segments in the reading task. When combined across subjects, the pupil dilation data do not show significant differences between good and bad segments, although this is not altogether surprising given other reports of confounding results using pupil dilation, as mentioned above. When viewed as a measure within subjects, average pupil dilation increases when reading bad segments for some subjects, stays the same for others, and actually decreases when reading bad segments for yet others. We conclude that further testing of this particular metric is required. The test for correlations with BLEU scores suggest that gaze time and
fixation count appear to have convincing correlations, in general, but pupil dilation and fixation duration do not.
Our second question in this study was: could eye tracking potentially be used as an automatic measure of MT quality? Although the sample is small when number of sentences and participants are taken into account, we are reassured that the use of eye tracking for automatically evaluating the readability and comprehensibility of MT data is worthy of further investigation. In particular, gaze time and fixation count show positive correlations with human evaluation. On the other hand, pupil dilation and fixation duration seem not to be good differentiators of good and bad quality.
Using eye tracking requires human readers of text which, if they are employed in formal evaluation studies, is expensive. However, eye tracking could remove much of the subjectivity involved in human evaluation of machine translation quality as the processes it measures are largely unconscious. Eye tracking also opens up the possibility of involving end users in the automatic evaluation of MT output, a development that would be welcomed by many: By recording
the reading activity of real end users and how they interact with the MT output, MT developers
could accumulate data automatically on what the actual end user has difficulty with. This would expand the activity of MT evaluation into the field of user reception of MT output.
Although the sample here is small when number of sentences and participants is
taken into account, we feel reassured that eye tracking methods for evaluating the
readability and comprehensibility of MT data is worthy of further investigation.
It is our intention in the future to build on this research by increasing sample sizes, target languages, MTengine types and domains.
As mentioned in the Introduction, the aim here is on testing
methodology. While we do not propose this as a replacement for traditional or
automated human evaluation, nor as a faster, cheaper method, it nonetheless offers a
new dimension in evaluating translations generated by MT, which gives insight into
the cognitive effort involved on the part of genuine end users.
Acknowledgements
The authors wish to thank Dr. Johann Roturier, Principal Research Engineer at Symantec, Ireland, who gave permission to re-use human evaluated MT output. This research is supported by the Science Foundation Ireland (Grant 07/CE/I1142) as part of the Centre for Next Generation Localisation (www.cngl.ie) at Dublin City University.
References
Ball Linden J., Eger N, Stevens R & Dodd J (2006) Applying the post-experience eye-tracked protocol (PEEP) method in usability testing. Interfaces 67:15-19 Caffrey C (2008) Using pupillometric, fixation-based and subjective measures to measure the
processing effort experienced when viewing subtitled TV anime with pop-up gloss. In: Göpferich S, Jakobsen A and Mees I (eds). Looking at eyes – Eye tracking studies of reading and translation processing. Copenhagen Studies in Language 36, Copenhagen: Samfundslitteratur: 125-144 Carl M (2008) Framework of a probabilistic gaze mapping model for reading In: Göpferich S,
Jakobsen A and Mees I (eds). Looking at eyes – Eye tracking studies of reading and translation processing. Copenhagen Studies in Language 36, Copenhagen: Samfundslitteratur: 193-202 Duchowski A (2003) Eye-tracking methodology – theory and practice. London: Springer-Verlag Göpferich S, Jakobsen A and Mees I (eds). Looking at eyes – Eye tracking studies of reading and
Hess E & Polt J (1964) Pupil size in relation to mental activity in simple problem solving. Science 143:1190-1192
Hyönä J and Nurminen AM (2006) Do adult readers know how they read? Evidence from eye movement patterns and verbal reports. British Journal of Psychology 97: 31-50
Iqbal S, Adamzyck P, Zheng X & Bailey P (2005) Towards an index of opportunity: understanding changes in mental workload during task execution. In: Human Factors in Computing Systems: Proceedings of CHI’05. New York: ACM Press: 311-320
Jakobsen A L & Jensen K (2009) Eye movement behaviour across four different types of reading task. In: Göpferich S, Jakobsen A and Mees I (eds). Looking at eyes – Eye tracking studies of reading and translation processing. Copenhagen Studies in Language 36. Copenhagen: Samfundslitteratur: 103-124
Jakobsen A L (1999) Logging target text production with Translog. In: Hansen G (ed) Probing the process in translation: methods and results. Copenhagen Studies in Language 24. Copenhagen: Samfundslitteratur: 9-20 Kaakinen J & Hyönä J (2003) Perspective effects on expository text comprehension: Evidence from think-aloud protocols, eyetracking, and recalls. Discourse Processes 40: 239-257
Kaakinen J, Hyönä J & Keenan J (2003) How prior knowledge, WMC, and relevance of information affect eye fixations in expository text. Journal of Experimental Psychology: Learning, Memory, and Cognition 29(3): 447-457
Kintsch W (1998) Comprehension: A paradigm for cognition, Cambridge, England: Cambridge University Press
Nakayama M, Koji T & Yasutaka S (2002) The act of task difficulty and eye-movement frequency for the oculo-motor indices. In: Proceedings of the Symposium on Eye Tracking Research and Application, New Orleans, Louisiana, 37-42
O'Brien S (forthcoming) Controlled language and readability. In: Shreve G & Angelone E (eds). Translation and cognition. American Translators Association Scholarly Monograph Series, John Benjamins
O’Brien S (2008) Processing fuzzy matches in translation memory tools – an eye-tracking analysis. In: Göpferich S, Jakobsen A and Mees I (eds). Looking at eyes – Eye tracking studies of reading and translation processing. Copenhagen Studies in Language 36. Copenhagen: Samfundslitteratur: 79102
O’Brien S (2006) Eye-tracking and translation memory matches. Perspectives: Studies in Translatology 14(3): 185-205
Rayner K (1998) Eye movements in reading and information processing: 20 years of research. Psychological Bulletin 124: 372-422
Roturier J (2006) An investigation into the impact of controlled English rules on the comprehensibility, usefulness, and acceptability of machine-translated technical documentation for French and German users. PhD Dissertation, Dublin City University
Schultheis H & Jameson A (2004) Assessing cognitive load in adaptive hypermedia systems: Physiological and behavioural methods. In: Neijdl W & de Bra P (eds) Adaptive hypermedia and adaptive web-based systems. Eindhoven: Springer Verlag: 18-24
Stanford Poynter Project: http://www.poynterextra.org/et/i.htm [Last accessed: 29/04/2009]
We draw here on Kintsch’s (1998) Construction Integration (CI) theory which posits that the reader’s background knowledge plays a crucial role in-text comprehension.