Chi, Seokho& Han, Sangwon (2012) Analyses of systems theory for con-struction accident prevention with specific reference to OSHA accident re-ports. International Journal of Project Management. (In Press)
This file was downloaded from: http://eprints.qut.edu.au/55799/
c
Copyright 2012 Elsevier
Notice: Changes introduced as a result of publishing processes such as copy-editing and formatting may not be reflected in this document. For a definitive version of this work, please refer to the published source:
1
Analyses of Systems Theory for Construction Accident Prevention
with Specific Reference to OSHA Accident Reports
Abstract
To enhance workplace safety in the construction industry it is important to understand interrelationships among safety risk factors associated with construction accidents. This study incorporates the systems theory into Heinrich’s domino theory to explore the interrelationships of risks and break the chain of accident causation. Through both empirical and statistical analyses of 9,358 accidents which occurred in the U.S. construction industry between 2002 and 2011, the study investigates relationships between accidents and injury elements (e.g., injury type, part of body, injury severity) and the nature of construction injuries by accident type. The study then discusses relationships between accidents and risks, including worker behavior, injury source, and environmental condition, and identifies key risk factors and risk combinations causing accidents. The research outcomes will assist safety managers to prioritize risks according to the likelihood of accident occurrence and injury characteristics, and pay more attention to balancing significant risk relationships to prevent accidents and achieve safer working environments.
Keywords: Construction safety, Accident prevention, Construction injury, Systems theory, Domino theory
2 1. Introduction
Accidents occur every day on a construction site. In 2010, there were a total of four recorded injuries per 100 full-time construction workers in the United States’ (U.S.) construction industry (Bureau of Labor Statistics, 2012). Considering that the industry employed 5.5 million workers during this time period, this injury rate indicated 0.22 million workers experienced accidents during their work. This figure includes 802 fatalities, which accounted for approximately 17% of the total number of fatal injuries across all industries. In other words, every working day, more than three workers failed to return home due to fatalities on a construction site.
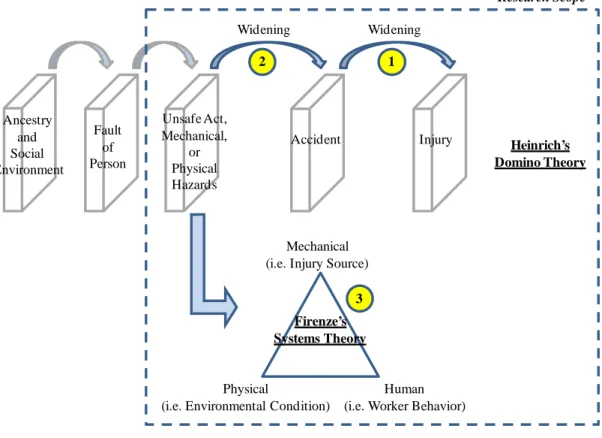
To prevent accidents and improve workplace safety it is important to understand how these accidents and injuries are generated. In one of the earliest accident causation studies, Heinrich (1936) introduced the domino theory after investigating 75,000 industry accident reports. According to Heinrich, there are five sequential dominos contributing to a construction accident injury: (1) ancestry and social environment, (2) fault of a person, (3) unsafe act and mechanical or physical hazards, (4) accident, and (5) injury. These dominos fall over one another and create a chain of events leading up to an accident causing worker injuries. More specifically, he explained that accidents lead to injuries, and that these accidents are caused when a worker commits unsafe acts or there are direct mechanical or physical hazards related to the work. He suggested that the unsafe acts and conditions can be managed by social and organizational supports such as safety training, and the number of accidents can be reduced by understanding and eliminating unsafe acts (i.e., human-related factors) and unsafe conditions (i.e., environment-human-related factors).
3
Based on this recognition, there have been considerable research studies exploring the contributing human, environmental, and mechanical factors in construction accidents. Hinze et al. (1998) emphasized that the first step for accident prevention was the understanding of risk factors contributing to accidents, analyzing the distribution of four major fatalities including falls, struck-by, electrical shock and caught in/or between accidents and their risk sources. Choudhry and Fang (2008) investigated why construction workers engaged in unsafe behavior in the construction industry and identified various reasons for unsafe worker behavior through a series of industry interviews. The determined factors included ignorance and lack of safety knowledge, failure to follow safety procedures, and attitudes towards safety that included not wearing personal protective equipment (PPE), unsafe work conditions, a lack of skill or safety training, and workers’ failure to identify unsafe conditions during work. Garrett and Teizer (2009) similarly investigated organizational and supervisory human factors and workers’ mental and physical conditions which eventually led to human errors on a job site, proposing a framework of human error awareness training and discussing the potential for site safety control. Suraji et al. (2001) highlighted the complex interaction of factors in accident causation and proposed an empirical accident causation model. They identified different groups of proximal factors and event characteristics in accident causation, including inappropriate construction planning, inappropriate construction operation or control, inappropriate site conditions, inappropriate ground conditions, an unacceptably noisy or crowded environment, and inappropriate operative action. The importance of PPE and safety devices, proper site inspections, a safe working environment, safety
4
culture, safety training, and supervision have also been emphasized by many researchers including Sawacha et al. (1999), Tam et al. (2004), Haslam et al. (2005), Aksorn and Hadikusumo (2008), Cheng et al. (2010), Ismail et al. (2012), and Leung et al. (2012). Table 1 grouped existing risk assessment studies and accident risk factors into three categories: unsafe workers’ behaviors, unsafe working conditions, and exposure to hazardous injury sources.
< Insert Table 1 here >
Despite these achievements, there is a distinct lack of studies that investigate specific inter-relationships among different risk elements including unsafe acts, mechanical hazards, and environmental conditions that were identified as key accident causes by Heinrich (Heinrich, 1936); few studies explored the combination effects among different risk factors on accident generation and injury severity. Firenze’s systems theory (1978) responds well to this need. Firenze considered accident causation as a system that is a group of interacting and interrelated risk components and emphasized a harmony between human, machine, and environment for accident prevention. Instead of considering the environment as being full of risks and the people as being error prone, he assumed the chance of an accident is low under normal, harmonized circumstances. Changes in interrelationships can increase or reduce the likelihood of an accident (Goetsch, 2011). Systems theory has been applied to risk analyses of a range of engineering processes. McIntyre (2002) developed system-based techniques for aircraft systems’ safety risk assessments and
5
management and Leveson (2003) provided a theoretical framework for safer engineering process design and efficient risk identification using systems theory.
The study presented in this paper incorporates systems theory into Heinrich (1936)’s model to better understand interrelationships between construction safety risks and to break the chain of accident causation (Figure 1). To achieve the research aim, the study reviewed 9,358 accident cases which occurred in the U.S. construction industry between 2002 and 2011. The large case number supported practical, empirical, and statistical analyses. Specific research objectives and their contributions are discussed below:
1) To understand the relationships between accidents and injury elements (e.g., injury types, part of body injured, degree of injury) and the nature of construction injuries by different accident types (#1 in Figure 1). This would motivate construction workers to improve accident prevention, support post-accident rehabilitation and management, and assist safety managers to better understand the severity of each accident type and prioritize managerial effort for accident prevention.
2) To understand the relationships between accidents and human (e.g.,
worker behavior), mechanical (e.g., injury sources such as tools or equipment), and physical (e.g., environmental conditions) risk factors (#2 in Figure 1) and identify key relationships among risk factors (#3 in Figure 1). Since every accident has its root causes, it is believed that an accident can be prevented by eliminating these causes. Thus, the likelihood of an accident may be reduced by identifying combinations of
6
key causes of each accident type and keeping the balance among them. It would also help safety managers to develop a strategic risk mitigation plan and prevent accident causation.
< Insert Figure 1 here >
The accident examples investigated in this study included accidents in the building and infrastructure construction sectors. As shown in Figure 1, the scope of this study was limited to accident risk relationships and their impact analyses during accident and injury causation. Heinrich (1936) pointed out that injuries are caused by preceding factors, and the action of these preceding factors can be negated by understanding and removing the unsafe behaviors and conditions. Although it is ideal to eliminate such unsafe acts and conditions in advance by controlling social, organizational, and workers’ psychological risk factors (first two dominos), the unsafe acts and conditions tend to still exist on construction sites due to the dynamic, unpredictable, and complex nature of construction projects and operations. Thus, this research scope widens a gap between dominos and breaks the chain of events by managing the relationships among risk factors and making strategic risk management and injury prevention plans.
This paper is organized into four sections. After this introduction, Section 2 describes the U.S. Occupational Safety and Health Administration’s (OSHA’s) accident investigation reports and data analysis processes. Section 3 then discusses research findings on perceptions of construction injuries and the identification of key
7
risk relationships and Section 4 concludes the article with contributions and recommendations for future research.
2. Analysis of OSHA Accident Reports 2.1 Data description
This study reviewed 9,358 accidents which occurred in the U.S. construction industry over the past 10 years, between 2002 and 2011. The accident data was obtained from OSHA. OSHA reports seven data categories during accident investigation: (1) environmental risk factors, (2) human risk factors, (3) source of injury, (4) accident type, (5) injury type, (6) part of body injured, and (7) degree of injury. The dataset used in this study comprised 3,124 fatalities (33.4%), 5,210 hospitalized injuries (55.7%), and 1,024 non-hospitalized injuries (10.9%), which is the degree of injury. The accidents included: 4,110 falls from an elevation or at the same level (43.9%); 2,409 struck by/or against (25.7%); 934 caught in/or between (10.0%); 567 electrical shocks (6.1%); 247 inhalation, ingestion or absorption (2.6%); 179 cardiothoracic, vascular or respiratory failure (1.9%); and 912 ‘other’ (9.7%) which encompasses a range of miscellaneous accident types. The original dataset included several low-frequency accident types having 100 or less observations but they were combined with the ‘other’ category for more reliable statistical analysis. Table 2 summarizes specific data elements of other data categories.
8
In the reviewed OSHA accident reports, the victims included construction inspectors, architects, surveyors, supervisors, masons, tile setters, carpet installers, carpenters, drywall installers, electricians, painters, plasterers, plumbers, concrete finishers, glaziers, insulation workers, roofers, duct installers, structural metal workers, earth drillers, construction trade workers, welders and cutters, crane and tower crane operators, heavy machinery operators, and other general construction workers.
2.2 Data analysis
Figure 2 illustrates the data analysis methodology used to achieve the research objectives. Before conducting detailed analysis for each objective, the authors verified relationships identified by Heinrich (1936) and Firenze (1978) with OSHA’s accident data to understand their applicability to recent accident causation and build a foundation for further analysis. For instance, the analysis to understand the nature of injury by different accident types can be more meaningful once their correlation is identified. The authors employed the Chi-square analysis developed by Karl Pearson (1900) and Fisher’s exact test (Fisher, 1954; Agresti, 1992) to explain three relationships between (1) accidents and injuries, (2) risk factors and accidents, and (3) different risk factors. For the accident and injury relationship analysis, three detailed relationships were also investigated: accidents and injury types, accidents and parts of body injured, and accidents and degree of injury. The risk and accident relationship analysis explored the following relationships: (1) accidents and worker behaviors, (2) accidents and environmental conditions, and (3) accidents and sources of injury. The
9
relationships among those three risk factors were then investigated to verify Firenze’s systems theory (1978). The conditional probability, p-value, was calculated for each relationship through the use of SPSS statistical analysis software and a p-value of 0.01 (1%) or less was chosen as an acceptable significance level for more reliable analysis considering the large number of sample sizes obtained from the accident data. When the p-value was less than the acceptable level, the null hypothesis “there is no relationship between two variables being examined” was rejected, which means that there was a significant correlation between the two variables. Detailed description of the Chi-square analysis and Fisher’s exact test can be found in Pearson (1900), Fisher (1954) and Agresti (1992).
< Insert Figure 2 here >
Once the correlations between accidents and injuries were statistically confirmed, the authors first investigated the nature of injury by different accident types explaining what types of injury and parts of the body were associated with each accident type and what their severity was. The authors then identified significant injury elements including types, parts, and severity of accidents by analyzing their frequency. An injury element having higher frequency was determined to be more significantly related to the accident. For instance, fracture (58%) was a major type of injury due to falls from an elevation, and head (25%) and back (9%) were significant parts of body injured. Hospitalized injuries (64%) dominated non-hospitalized injuries (8%) for the falling accidents. For the second research objective, the
10
statistical analysis first investigated the risk and accident relationship as well as the triangular systematic relationship among three risk factors. Further analyses were performed on top of the correlations found in order to identify key risk factors contributing to each accident type and significant risk combinations among risk factors causing the accident. The frequency analysis prioritized risk factors and their relationships. For example, a working surface condition (an environmental condition), misjudgment (worker behavior) and a ladder (an injury source) were determined as one of the key relationships for falls from an elevation, explaining 60 accidents, which accounted for 5% of the total falling accidents. Such relationships identified were then summarized by a risk and accident analysis diagram.
3. Analysis Results and Discussion
3.1 Perception of construction injuries
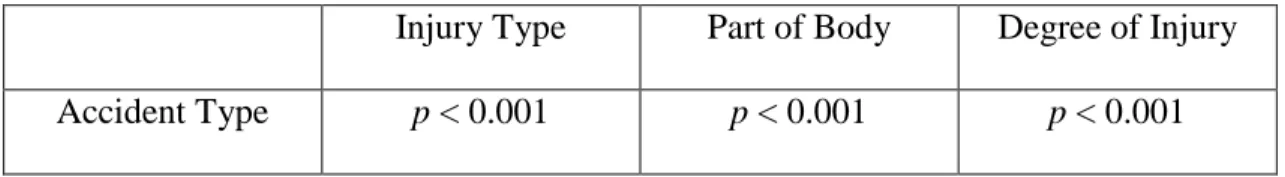
The authors first determined correlations between accident types and injury elements. As shown in Table 3, the p-values between (1) accidents and injury types, (2) accidents and parts of body injured, and (3) accidents and injury severity were less than 1%, which explained significant correlations between the investigated variables. The results verified Heinrich (1936)’s accident and injury relationship with recent accident data and indicated that different accident types may show different impacts on injury severity, types, and parts, and could result in different injury characteristics. The authors then performed frequency analysis to seek detailed information.
11
< Insert Table 3 here >
Table 4 summarizes observation frequency of: each injury severity, either fatality, hospitalized or non-hospitalized (Table 4(a)); each injury type from amputation to cancer (Table 4(b)); and each part of body injured such as abdomen and reproductive system (Table 4(c)), against different accident types. The analysis showed that the fatality rate for electrical shock accidents (65%) and respiratory failure (96%) was higher than the rate for other accident types due to high voltage and toxic gases leading to death. About 30% of fatality rates were identified as resulting from most of the other accident types and their likelihood of having hospitalized injuries was much higher than the likelihood of having non-hospitalized injuries. The low frequency of non-hospitalized injuries indicates that most construction accidents are severe and require lost working days due to the injury. This is critical considering both the direct and indirect costs of injury compensation. Falls from an elevation (42%), struck-by (23%), and caught in/or between (10%) accidents were the top three accident types that accounted for 75% of the total workplace injuries in the construction industry.
< Insert Table 4 here >
The analysis also considered common injury types associated with each accident type. Based on the observed frequency, the authors identified key injury types for each accident type if their frequency accounted for more than 5% of the
12
total accidents. Falls from an elevation resulted in 330 bruise/contusion/abrasion (8%), 415 concussion (11%), and 2,275 fracture (58%) injuries among the total of 3,944 falls from an elevation. The injured body parts primarily included back (9%), body system (9%), foot and ankle (7%), head (25%), legs (7%) and multiple body parts (18%). Head injuries are highly related to concussions and other body parts are linked with fractures and bruise/contusion/abrasions. Falls at the same level determined similar injury types including 12 bruise/contusion/abrasions (7%), 9 concussions (5%), 72 fractures (43%), 9 cut/lacerations (5%), and 17 burn/scalds by heat (10%) among the total of 166 falls at the same level. The parts of injured body comprised arm (5%), body system (6%), foot and ankle (8%), hands (9%), head (15%), hip (5%), and legs (13%). Only falls from an elevation, not falls at the same level, resulted in multiple body parts injured indicating that falls from an elevation could generate more severe injuries in general, leading to more fatalities. Interestingly, falls at the same level caused 17 burn/scald injuries by heat because, for instance, workers carrying a bucket of hot water or hot materials like asphalt splashed them onto their hands when they lost balance and fell. That may be why falls at the same level included hands as major parts of body injured. Both accident types showed a high frequency of critical head injuries.
Struck-by, caught in/or between, and struck-against accidents resulted in similar injury types on similar parts of the body. Struck-by/or against accidents generally caused bruise/contusion/abrasion (8-10%), concussion (5%), and fracture (23-31%) injuries since workers can be hit by or fall against materials or surrounding objects. Caught in/or between accidents also caused 62 bruise/contusion/abrasion
13
(7%) and 195 fracture (21%) injuries. The injured body parts comprised body system (9-10%), head (6-16%), and multiple body parts (8-15%) according to these injury types. In contrast to falling accidents, these accidents included machinery-related injuries such as amputation, asphyxia, puncture, and cut/laceration since they could commonly occur during tool, equipment, or construction machinery operation. That may be why fingers, hands, and chest injuries made up a high portion of the total injuries. One interesting observation was that 37 electrical shocks (15%) were caused by struck-against accidents. This was due to OSHA classifying some of electrical shock accidents as struck-against when workers were hit against energized materials or equipment parts during their work.
Electrical shock accidents resulted in 90% of the electric shock injuries, damaging body parts such as arm (7%) or hands (22%) that contacted a powerline or an energized material. High voltage caused critical injuries to body systems (35%) or multiple body parts (11%) resulting in a high likelihood of fatality. Most inhalation accidents were related to asphyxia (40%) and poisoning (23%) causing damage to body systems (29%), blood (20%) or lungs (35%) since they were heavily related to toxic gases. Lastly, respiratory failure resulted in asphyxia (10%), electric shock (17%) or heat exhaustion (8%) on body systems (32%) or chest (11%). A confined space was one of the major sources of asphyxia and some electrical contacts (e.g. to the chest) were able to cause respiratory failure due to heart attack.
These results can be used to support post-accident rehabilitation and management by providing information about which part of the body can generally be injured due to accidents and assist safety managers to understand the type of injury
14
related to the accident, the severity of each accident type and prioritize managerial effort for accident prevention. The injury information can also be used to motivate construction workers for safety enhancement purposes.
3.2 Identification of key risk factors associated with accidents
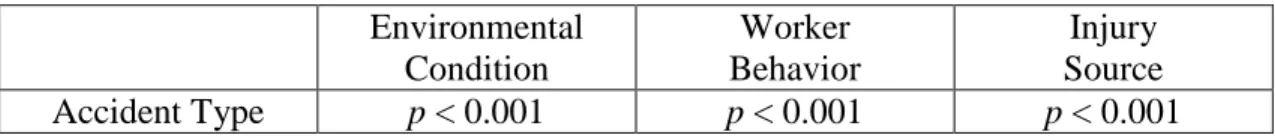
Once the nature of construction injuries was examined by different accident types, the authors determined correlations between accident types and risk factors. As shown in Table 5, the p-values between (1) accidents and environmental conditions, (2) accidents and worker behaviors, and (3) accidents and sources of injury were less than 1%, which identified significant correlations between them. The results showed that Heinrich (1936)’s risk and accident relationship was applicable to OSHA’s recent accident data between 2002 and 2011, and different combinations of risk factors on a construction site may cause different types of accidents.
< Insert Table 5 here >
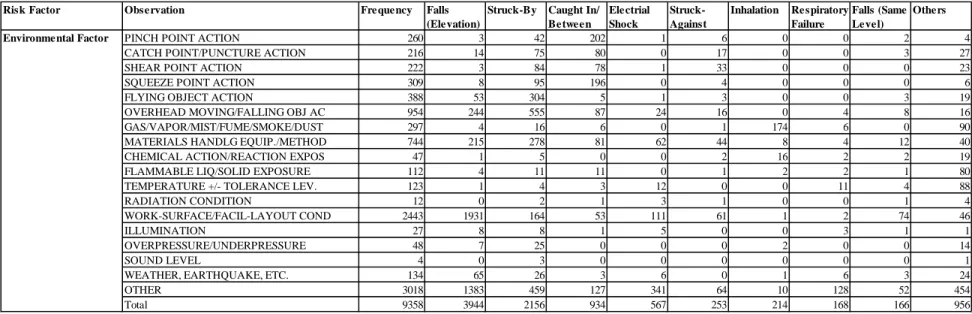
The authors then performed frequency analysis to identify key risk factors associated with each accident type. As shown in Table 6, the frequency of environmental risks, human risks, and sources of injury occurrence were observed by different accident types. Again, based on the observed frequency, the authors identified key risk factors if their frequency accounted for more than 5% of the total accidents. Approximately 50% of falls from an elevation occurred due to poor working surfaces or layout conditions since they could allow workers to lose their
15
balance, slip, and fall while working. Overhead moving or falling object action and materials handling equipment or method resulted in about 11% of falls from an elevation; for instance, by pushing workers at the edge of a working platform. Misjudgment of hazardous situations such as surrounding moving objects or structures (30%), safety devices removed or inoperative (12%), inappropriate equipment operation (8%), malfunction in securing or warning operation (6%), inappropriate working position (6%), and lack of PPE (6%) were the major human errors that resulted from falls from an elevation. Working surfaces (29%), surrounding buildings or structures (18%), ladders (17%) and bodily motion during work (13%) were the major sources of injury occurrence.
Similarly, 45% of falls at the same level occurred due to poor working surface or layout conditions and 7% resulted from materials handling equipment. This was related to the fact that 5% of falls at the same level were caused by inappropriate materials handling procedure and another 5% occurred as a result of insufficient housekeeping programs. Worker misjudgment caused 30% of same level falling accidents, which was the highest rate of worker-related risk factors. The major sources of these accident injuries included working surfaces (31%), bodily motion during work (16%), and surrounding buildings and structures (5%).
< Insert Table 6 here >
Approximately 52% of struck-by accidents were caused by flying object action, overhead moving or falling object action and materials handling equipment or
16
method. Workers could be exposed to being hit by objects or equipment during their work. Another 8% were related to working surfaces or layout conditions. Surface failure resulted in workers being struck by surrounding structures or buildings. The major human errors included misjudgment of hazardous situation (32%), malfunction in securing or warning operation (9%), inappropriate materials handling procedure (8%), inappropriate working position (7%), and safety devices removed or inoperative (6%). Workers were mainly struck by highway or industrial motor vehicles (16%), buildings or structures (13%), powered hand tools (13%), materials handling equipment (11%), construction machinery (5%), hoisting apparatus (6%), and metal products (5%).
Caught in/or between and struck-against accidents were more related to machinery operation. During repeated operation of construction machinery, such as electrical saws or cutters, workers tended to be exposed to the risks of having caught in/or between or struck-against accidents as a result of pinch, catch, shear, or squeeze point actions. About 60% of caught in/or between accidents were the result of these actions and 20% of struck-against accidents occurred due to catch or shear point actions. Similarly to struck-by accidents, materials handling equipment or methods were responsible for 17% of struck-against accidents and poor surface or layout conditions resulted in 24% of the accidents. Another 6% of struck-against accidents were caused by overhead moving or falling object action. These three environmental risk factors were also major sources of caught in/or between accidents generating 9%, 6%, and 9% of them respectively. Misjudgment, malfunction in securing or warning operation, inappropriate equipment operation, safety devices removed or inoperative,
17
inappropriate working position, and inappropriate materials handling procedure were the major human-related risks attributing to both caught in/or between and struck-against accidents. Machine (22%), materials handling equipment (13%), dirt/sand/stone (11%), industrial motor vehicle (9%), powered hand tool (7%), hoisting apparatus (6%) and buildings/structures (5%) were the common sources of caught in/or between injuries. They were generally operation or equipment inspection-related injury sources. Struck-against accidents were the result of similar sources, with the exception of electrical apparatus or wiring which caused 17% of the accidents. Again, that was because OSHA classified some electrical shock accidents as struck-against accidents when workers were hit against energized materials or equipment parts during their work.
Characteristics of electrical shocks were more straightforward: 86% of electrical shocks were the result of electrical apparatus or wiring (source of injury occurrence); 20% occurred due to poor working surface or layout conditions since they could allow workers to lose their balance and touch an energized material, equipment or a powerline; and another 11% occurred due to contact with energized materials handling equipment. Misjudgment of hazardous situations (41%), lock-out/tag-out procedure malfunction (12%), inappropriate working position (7%) and lack of PPE (7%), were the major human-related risk factors.
Eighty one percent of inhalation accidents occurred due to gases, vapor, mist, fume, smoke, or dust and another 7% were caused by exposure to chemical action or reaction. The common risk factors of inhalation included misjudgment (32%), lack of engineering control (18%), inappropriate equipment operation (8%), lack of
18
respiratory protection (8%), and inappropriate materials handling procedure (6%). Inappropriate operation caused equipment failure or structural damage, such as pipeline cuts, resulting in fire or gas exposure leading to inhalation accidents. The major sources of injury were gases (36%), chemical liquid or vapors (35%), fumes (6%), and fire/smoke (5%).
Lastly, there was no dominant environmental factor causing respiratory failure since this accident primarily occurred as a result of a heart attack or a worker’s other physical health problems and thus it was difficult to determine the direct source. Temperature above or below tolerance level had the highest frequency rate of 7% because electrical shocks sometimes led to a heart attack or respiratory problems. The common human errors related to this accident included misjudgment (10%) and malfunction in securing or warning operation (6%). There were two main sources of injury: electrical apparatus and wiring (17%); and heat (8%), for example causing sunstroke.
By combining the results of the frequency analyses discussed above, the authors identified 11 key environmental conditions (pinch point action, catch point/puncture action, shear point action, squeeze point action, flying object action, overhead moving and/or falling object action, gas/vapor/mist/fume/smoke/dust condition, materials handling equipment/method, chemical action/reaction exposure, temperature above or below tolerance level, and working surface/facility layout condition), 11 key worker behaviors (misjudgment of hazardous situation, malfunction of procedure for securing operation or warning of hazardous situation, equipment in use not appropriate for operation or process, safety devices removed or
19
inoperative, operational position not appropriate for task, procedure for handling materials not appropriate for task, malfunction of procedure for lock-out or tag-out, insufficient or lack of housekeeping program, insufficient or lack of engineering controls, insufficient or lack of respiratory protection, and insufficient or lack of protection work clothing and equipment), and 18 significant sources of injury occurrence (bodily motion, buildings/structures, chemical liquid/vapors, dirt/sand/stone, electrical apparatus/wiring, fire/smoke, gases, powered hand tool, heat, hoisting apparatus, ladder, machine, materials handling equipment, metal products, highway motor vehicle, industrial motor vehicle, working surface, and fume) that were highly related to construction accidents.
3.3 Identification of key risk relationships contributing to accidents
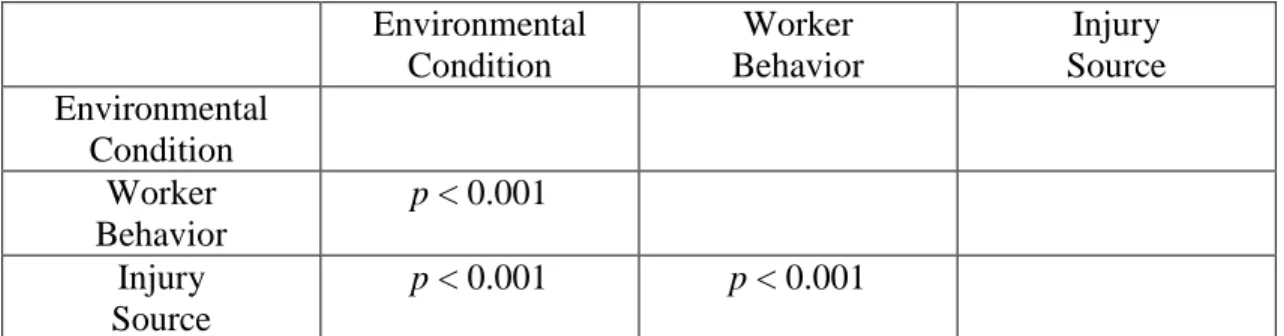
Next, the authors investigated the correlations among three risk factors (environmental condition, worker behavior, and source of injury occurrence) to test the applicability of Firenze (1978)’s systems theory. As shown in Table 7, all of the
p-values between (1) environmental conditions and injury sources, (2) injury sources and worker behaviors, and (3) worker behaviors and environmental conditions were less than 1%, which indicated significant correlations among different risk factors; this is the concept of systems theory. In a normal working condition, when human, mechanical, and physical conditions are well balanced, the chance of accidents occurring becomes low. However, if one side of the triangle loses the balance—for instance, with poor worker behavior such as inappropriate use of PPE—the likelihood of accidents will increase.
20
< Insert Table 7 here >
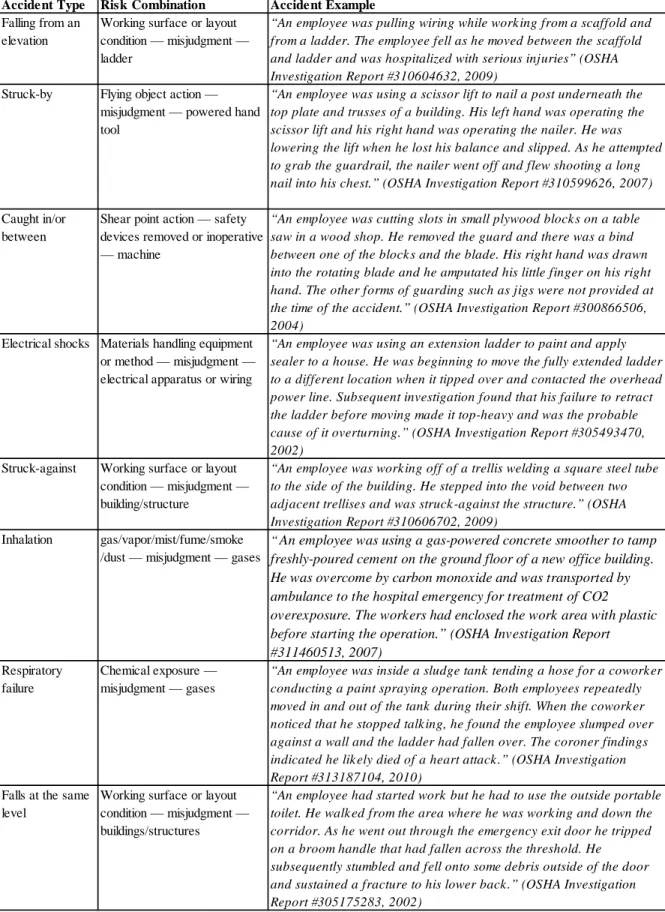
The authors then investigated detailed risk relationships among three risk factors which contributed to accident causation by using previously identified key risk factors. From the 9,358 accident reports, the authors explored all the possible relationships of three risk factors (e.g., ‘working surface’ as an environmental condition, ‘lack of PPE’ as worker behavior, and ‘buildings or structures’ as a source of injury occurrence) and counted the frequency of each combination associated with each accident type. The authors identified key risk combinations if their frequency accounted for more than 1% of the total accidents in order to explain as many possible accident cases as practical. Table 8 summarizes the identified key combinations by different accident types. An example of a key combination and its contribution to accident occurrence was reviewed from the original accident reports to confirm the identified relationship.
< Insert Table 8 here >
Falling from an elevation occurred as a result of 10 key combinations among three risk factors. The major environmental conditions were poor working surface or layout conditions, while misjudgment, safety devices removed or inoperative, lack of PPE, malfunction in securing or warning operation, and inappropriate equipment
21
operation were the major human errors. Sources of injury occurrence included working surface, buildings or structures, bodily motion, and ladder.
There were four key relationships attributing to struck-by accidents. Misjudgment was the main human error, while overhead moving or falling object action, materials handling equipment, and flying object action were the major environmental conditions. The sources of injury included buildings or structure, materials handling equipment, and powered hand tool.
Eight key relationships were determined for caught in/or between accidents, and most of the environmental conditions were related to machinery actions. Misjudgment was the major human error, and the common injury sources included machines, materials handling equipment, dirt/sand/stone, and industrial motor vehicles.
Electrical shocks were caused by seven key risk combinations, and their injury sources were primarily electrical apparatus or wiring. Working surface condition, materials handling equipment or method, and overhead moving or falling object action were the main environmental risk factors associated with this accident type, while misjudgment, inappropriate task position, lockout/tagout procedure malfunction, lack of PPE, and safety devices removed or inoperative were the common unsafe acts of workers.
Analysis identified 12 key relationships attributing to struck-against accidents. Materials handling equipment or method, working surface or layout condition, and shear or catch point actions were the primary environmental factors, and misjudgment, safety devices removed or inoperative, and lack of PPE were the major
22
human errors. Struck-against accidents occurred as a result of various sources such as powered hand tools and buildings/structures.
Inhalation was caused by 12 key risk relationships. Most of the significant environmental conditions and injury sources were gases and chemicals. Misjudgment, lack of engineering control, inappropriate equipment operation or materials handling procedure, and lockout/tagout procedure malfunction were the major human errors.
Respiratory failure was associated with three risk relationships. Similarly to inhalation, the common environmental conditions were gases, temperature above or below tolerance level, and chemical exposure. The injury sources included gases and heat, and the major human errors were misjudgment and malfunction in securing/warning operation.
Lastly, six relationships were identified for falls at the same level. Working surface condition, pinch point action, and overhead moving or falling object action were the main environmental risks, and misjudgment, inappropriate materials handling, and electrical apparatus or wiring were the common human errors. Bodily motion, working surface, buildings/structures, and chemical liquid or vapor were the major sources of fall occurrence at the same level.
Table 9 provides examples of accident information provided in the original accident reports along with the corresponding risk combinations.
23
The identified key risk relationships summarized in Table 8 will assist safety managers to understand possible risk combinations that contribute to each accident type and enable them to balance those risk factors and develop a strategic risk mitigation plan to prevent accident causation and maintain site safety. For instance, if safety managers want to reduce falling from an elevation during roof construction they can enforce securing and warning operations to reduce workers’ misjudgment, train operators to prevent them from inappropriate equipment/tool operation, inspect safety devices if they are removed or inoperative, and provide proper PPE for injury protection. These efforts will reduce the likelihood of human errors that can lead to construction accidents. They can be also linked with relevant environmental risks such as working surface or layout condition and materials handling equipment or method to prevent workers from being negatively affected by unexpected working conditions leading to falling accidents. Conversely, if safety managers identify risky conditions and the defects of injury sources such as equipment, machinery, or structure during safety inspections, the findings of this study will help them understand which type of accident can be associated with the given risks and what impacts (e.g., injury severity) they would have as a result of the accident.
4. Conclusions and Recommendations
This study analyzed 9,358 accidents that occurred in the U.S. construction industry and incorporated systems theory into Heinrich (1936)’s domino theory to better understand interrelationships between construction risks and accident causation. Fundamental correlations between accidents and injuries and those
24
between risks and accidents were tested by the Chi-square analysis and Fisher’s exact test, which verified the applicability of Heinrich’s theory to the given data set and reliability of the accident data reviewed. Correlations among different risk factors including environmental condition, worker behavior, and injury source were also statistically identified, which satisfied Firenze (1978)’s systems theory. The authors then discussed the nature of injury including injury types, parts of body injured, and injury severity by different accident types, identified key risk factors associated with each accident, and finally determined key risk combinations contributing to the accident. The outcomes of the study will assist safety managers to better understand risk factors related to different accidents and control specific risk factors (e.g., human errors) by eliminating the associated risk factors (e.g., environmental conditions or injury sources) to break the chain of accident causation. Safety managers can also prioritize risk factors according to the likelihood of accident occurrence and injury characteristics and pay more attention to controlling significant risks to achieve a safer working environment. Additionally, the injury-related information can support post-accident rehabilitation and management by providing information about which part of the body can be generally injured due to the accident and assist safety managers to understand injury types and injury severity related to the accident.
The scope of this study was limited to accident risk relationships and their impact analyses during accident and injury causation. In future research they can be linked with social, organizational, and workers’ psychological safety issues for more thorough risk management and accident prevention since safety management is a more integrated process throughout the construction life cycle. Also, the study
25
outcomes will benefit strategic safety information retrieval for safety inspection by explaining which information is important to be considered and by providing accident- or condition-specific step-by-step inspection guidelines. Risk assessment and safety performance measurement techniques can be incorporated to evaluate the practicality and the usefulness of the research findings.
26 References
Agresti, A., 1992. A survey of exact inference for contingency tables. Statistical Science 7 (1), 131-153.
Aksorn, T., Hadikusumo, B.H.W., 2008. Critical success factors influencing safety program performance in Thai construction projects. Safety Science 46, 709-727.
Bureau of Labor Statistics, 2012. Industries at a Glance, Construction: NAICS 23. U.S. Bureau of Labor Statistics, Department of Labor, Washington, DC. Accessed on 2 July 2012, http://www.bls.gov/iag/tgs/iag23.htm
Cheng, C.W., Leu, S.S., Lin, C.C., Fan, C., 2010. Characteristic analysis of
occupational accidents at small construction enterprises. Safety Science 48, 698-707.
Chi, C.F., Yang, C.C., Chen, Z.L., 2009. In-depth accident analysis of electrical fatalities in the construction industry. International Journal of Industry Ergonomics 39, 635-644.
Chi, C.F., Chang, T.C., Ting, H.I., 2005. Accident patterns and prevention measures for fatal occupational falls in the construction industry. Applied Ergonomics 36, 391-400.
27
Choudhry, R.M., Fang, D., 2008. Why operatives engage in unsafe work behavior: investigating factors on construction sites. Safety Science 46, 566-584.
Firenze, R.J., 1978. The Process of Hazard Control. Kendall/Hunt, NY.
Fisher, R.A., 1954. Statistical Methods for Research Workers. Oliver and Boyd, Edinburgh, UK.
Garrett, J.W., Teizer, J., 2009. Human factors analysis classification system relating to human error awareness taxonomy in construction safety. Journal of Construction Engineering and Management 135 (8), 754-763.
Glazner, J., Bondy, J., Lezotte, D.C., Lipscomb, H., Guarini, K., 2005. Factors contributing to construction injury at Denver international airport. American Journal of Industrial Medicine 47, 27-36.
Goetsch, D.L., 2011. Occupational Safety and Health for Technologists, Engineers, and Managers, seventh ed. Prentice Hall, NJ.
Haslam, R.A., Hide, S.A., Gibb, A.G.F., Gyi, D.E., Pavitt, T., Atkinson, S., Duff, A.R., 2005. Contributing factors in construction accidents. Applied Ergonomics 36, 401-415.
28
Heinrich, H.W., 1936. Industrial Accident Prevention. McGraw-Hill, NY.
Hinze, J., Huang, X., Terry, L., 2005. The nature of struck-by accidents. Journal of Construction Engineering and Management 131(2), 262-268.
Hinze, J., Pedersen, C., Fredley, J., 1998. Identifying root causes of construction injuries. Journal of Construction Engineering and Management 124 (1), 67-71.
Hsiao, H., Simeonov, P., 2001. Preventing falls from roofs: a critical review. Ergonomics 44, 537-561.
Huang, X., Hinze, J., 2003. Analysis of construction worker fall accidents. Journal of Construction Engineering and Management 129(3), 262-271.
Ismail, Z., Doostdar, S., Harun, Z., 2012. Factors influencing the implementation of a safety management system for construction sites. Safety Science 50, 418-423.
Kines, P., 2002. Construction workers’ falls through roofs: fatal versus serious injuries. Journal of Safety Research 33, 195-208.
Leung, M., Chan, I.Y.S., Yu, J., 2012. Preventing construction worker injury incidents through the management of personal stress and organizational stressors. Accident Analysis and Prevention 48, 156-166.
29
Leveson, N., 2003. A new accident model for engineering safer system. ESD Internal Symposium, Massachusetts Institute of Technology, Cambridge, MA.
Mattila, M., Hyttinen, M., Rantanen, E., 1994. Effective supervisory behavior and safety at the building site. International Journal of Industrial Ergonomics 13, 85-93.
McIntyre, G.R., 2002. The application of system safety engineering and management techniques at the US Federal Aviation Administration (FAA). Safety Science 40, 325-335.
Mitropoulos, P., Cupido, G., Namboodiri, M., 2009. Cognitive approach to construction safety: task demand-capability model. Journal of Construction Engineering and Management 135(9), 881-889.
Pearson, K., 1900. On the criterion that a given system of deviations from the probable in the case of a correlated system of variables is such that it can be
reasonably supposed to have arisen from random sampling. Philosophical Magazine, Series 5 50 (302), 157-175.
Saurin, T.A., Guimaraes, L.B.M., 2008. Ergonomic assessment of suspended scaffolds. International Journal of Industrial Ergonomics 38, 238-246.
30
Sawacha, E., Naoum, S., Fong, D., 1999. Factors affecting safety performance on construction sites. International Journal of Project Management 17 (5), 309-315.
Suraji, A., Duff, A.R., Peckitt, S.J., 2001. Development of causal model of construction accident causation. Journal of Construction Engineering and Management 127 (4), 337-344.
Tam, C.M., Zeng, S.X., Deng, Z.M., 2004. Identifying elements of poor construction safety management in China. Safety Science 42, 569-586.
Teo, E.A.L., Ling, F.Y.Y., Chong, A.F.W., 2005. Framework for project managers to manage construction safety. International Journal of Project Management 23, 329-341.
31
Figure 1 Aim and scope of the research (Heinrich, 1936; Firenze, 1978) Ancestry and Social Environment Fault of Person Unsafe Act, Mechanical, or Physical Hazards
Accident Injury Heinrich’s
Domino Theory
Mechanical (i.e. Injury Source)
Physical
(i.e. Environmental Condition)
Human (i.e. Worker Behavior)
Firenze’s Systems Theory Research Scope 1 2 3 Widening Widening
32 Figure 2 Data analysis methodology
Verify Heinrich’s accident/injury
relationship
Objective 1.1 Understand correlations b/w accidents and injury elements •Accident type & Injury type
•Accident type & Part of body injured
•Accident type & Degree of injury
Objective 1.2 Understand the nature of injury by different accident types •Each accident type & Significant injury type
•Each accident type & Significant part of body
•Each accident type & Injury severity
Objective 2.1 Understand correlations b/w risk factors and accidents •Environmental condition & Accident type
•Worker behavior & Accident type
•Source of injury & Accident type
Objective 2.2 Understand correlations among risk elements •Environmental condition & Worker behavior
•Worker behavior & Source of injury
•Source of injury & Environmental condition
Objective 2.3 Identify key risk relationships contributing to accidents •Determine key risk factors contributing to each accident type
•Determine key risk relationships among source of injury, worker behavior and environmental condition contributing to each accident type
•Develop risk and accident analysis diagram
Chi-Square Analysis and Fisher’s Exact Test PURPOSE METHOD Strategic Accident Management and Prevention Accident Frequency Analysis Verify Heinrich’s risk/accident relationship Chi-Square Analysis and Fisher’s Exact Test Verify Firenze’s triangular system relationship Chi-Square Analysis and Fisher’s Exact Test Strategic Risk Mitigation and Accident Prevention Accident Frequency Analysis
33 Table 1 Literature review summary
Category Accident Risks
M at ti la e t al . ( 1994) H inz e e t al . ( 1998) Saw ac ha e t al . ( 1999) H si ao and Si m e onov ( 2001) Sur aj i e t al . ( 2001) K ine s ( 2002) H uang and H inz e ( 2003) T am e t al . ( 2004) C hi e t al . ( 2005) G laz ne r e t al . ( 2005) H as lam e t al . ( 2005) H inz e e t al . ( 2005) T e o e t al . ( 2005) A k sor n and H adi k us um o ( 2008) C houdhr y and F ang ( 2008) Saur in and G ui m ar ae s ( 2008) C hi e t al . ( 2009) G ar re tt and T e iz e r ( 2009) M it ropoul os e t al . ( 2009) C he ng e t al . ( 2010) Is m ai l e t al . ( 2012) L e ung e t al . ( 2012)
Failure to recognize safety hazards * * * * * * *
Attitudes towards not wearing personal protective equipment (PPE) * * * * * * * * * * * * * * *
Failure to follow safety procedures during operation * * * * * * * * * * * *
Improper site safety inspection * * * * * * * * * * * * * * *
Improper supervision and safety control * * * * * * * * * * * *
Lack of safety knowledge and training * * * * * * * * * * * * * * * * *
Dangerous required working actions during machine operation * * * * * *
Irregularly assigned tasks * * * *
Cluttered working environment with surrounding objects or structures * * * * * * *
Poor working surface conditions * * * * * * * * * * *
Tools and equipment malfunction * * * * * * * * * *
Exposure to gas or chemical hazards * * * * *
Extream temperature, pressure, or noise level * * * * * *
Poor weather conditions or illumination * * * * * * *
Unsafe Workers' Behaviors Unsafe Working (Environmental) Conditions Exposure to Hazardous Injury Sources
34 Table 2 OSHA data description
No Data Category
• malfunction of procedure for securing operation or warning of hazardous situation
• malfunction of perception system with respect to task environment
• insufficient or lack of exposure or biological monitoring
• no PPE used • safety devices removed or inoperative • insufficient or lack of engineering controls • equipment in use not appropriate for operation or
process
• procedure for handling materials not appropriate for task
• insufficient or lack of written work practices program
• misjudgment of hazardous situations • operational position not appropriate for task • insufficient or lack of respiratory protection • distracting actions by others • defective equipment knowingly used • insufficient or lack of protection work clothing and
equipment • no appropriate protective clothing • malfunction of lock-out or tag-out procedure • ‘other’ • malfunction of neuro-muscular system • insufficient or lack of housekeeping program
• pinch point action • gas/vapor/mist/fume/smoke/dust condition • working surface/facility layout condition • catch point/puncture action • materials handling equipment/method • illumination
• shear point action • chemical action/reaction exposure • overpressure/underpressure condition • squeeze point action • flammable liquid/solid exposure • sound level
• flying object action • temperature above or below tolerance level • weather/earthquake, etc. • overhead moving and/or falling object action • radiation condition • ‘other’
3 Source of Injury
4 Injury Type 5 Part of Body
Injured
amputation, asphyxia, bruise/contuse/abrasion, chemical burn, heat burn/scald, concussion, cut/laceration, dermatitis, dislocation, electric shock, foreign body in eye, fracture, freezing/frost bite, hearing loss, heat exhaustion, hernia, systemic poisoning, puncture, radiation effects, strain/sprain, cancer, and ‘other’
abdomen, multiple arm, back, body system, chest, ear(s), elbow(s), eye(s), face, finger(s), foot/ankle, hand(s), head, hip(s), knee(s), legs, lower arm, lower leg, multiple body, neck, shoulder, upper arm, upper leg, wrist(s), blood, kidney, liver, lung, nerve system, reproductive system, and ‘other body system’
Specific Data Elements
1 Environmental Risk Factors
2 Human Risk Factors
aircraft, air pressure, animal/insects, boat, bodily motion, boiler or pressure vessel, boxes/barrels, chemical liquid/vapors, cleaning compound, cold, dirt/sand/stone, drugs/alcohol, dust/particles/chips, electrical apparatus/wiring, fire/smoke, food, furniture, gases, glass, powered hand tool, manual hand tool, heat, hoisting apparatus, ladder, machine, materials handling equipment, metal products, highway motor vehicle, industry motor vehicle, motorcycle, wind/lightning, firearm, person, petroleum products, pump/prime mover, radiation, train/railroad equipment, vegetation, waste products, water, working surface, fume, mists, vibration, noise, biological agent, and ‘other’. The 9,358 construction accidents reviewed in this paper were mainly caused by construction-related injury sources such as bodily motion, buildings/structures, dirt/sand/stone, electrical apparatus/wiring, hand tools, machines, materials handling equipment, vehicles, and working surface.
35
Table 3 Correlation (p-value) between accidents and injury elements
Injury Type Part of Body Degree of Injury
36
Table 4 Injury elements, observations and frequency by accident types: (a) degree of injury, (b) injury type, (c) part of body injured (a)
(b)
Injury Element Observation Frequency Falls (Elevation)
Struck-By Caught In/ Between Electrial Shock Struck-Against Inhalation Respiratory Failure Falls (Same Level) Others Fatality 3124 1114 746 326 368 68 67 162 27 246 Hospitalized 5210 2509 1130 458 161 142 98 6 123 583 Non-hospitalized 1024 321 280 150 38 43 49 0 16 127 Total 9358 3944 2156 934 567 253 214 168 166 956 Degree of Injury
Injury Element Observation Frequency Falls (Elevation)
Struck-By Caught In/ Between Electrial Shock Struck-Against Inhalation Respiratory Failure Falls (Same Level) Others AMPUTATION 590 9 161 302 3 51 0 0 0 64 ASPHYXIA 259 7 37 95 1 2 85 17 0 15 BRUISE/CONTUS/ABRAS 657 330 209 62 0 20 0 0 12 24 BURN(CHEMICAL) 41 2 2 0 3 0 4 0 6 24 BURN/SCALD(HEAT) 560 3 61 24 31 10 13 5 17 396 CONCUSSION 578 415 118 16 0 9 0 0 9 11 CUT/LACERATION 468 107 204 58 1 36 0 0 9 53 DERMATITIS 1 0 0 0 0 0 0 0 0 1 DISLOCATION 70 46 14 3 0 1 0 0 4 2 ELECTRIC SHOCK 644 6 6 1 511 37 0 29 0 54 FOREIGN BODY INEYE 26 1 20 0 0 1 0 0 1 3 FRACTURE 3306 2275 661 195 6 57 0 0 72 40 FREEZING/FROST BITE 7 6 1 0 0 0 0 0 0 0 HEARING LOSS 4 1 1 0 0 0 0 0 0 2 HEAT EXHAUSTION 71 0 0 0 1 0 0 13 2 55 HERNIA 2 1 0 0 0 0 0 0 0 1 POISONING(SYSTEMIC) 54 0 0 0 0 0 50 2 0 2 PUNCTURE 196 31 109 7 1 11 0 0 10 27 RADIATION EFFECTS 0 0 0 0 0 0 0 0 0 0 STRAIN/SPRAIN 118 60 37 3 0 2 0 0 2 14 CANCER 4 1 1 0 0 0 2 0 0 0 OTHER 1702 643 514 168 9 16 60 102 22 168 Total 9358 3944 2156 934 567 253 214 168 166 956 Injury Type
37 Table 4 continued
(c)
Injury Element Observation Frequency Falls (Elevation)
Struck-By Caught In/ Between Electrial Shock Struck-Against Inhalation Respiratory Failure Falls (Same Level) Others ABDOMEN 152 36 50 31 7 6 0 1 2 19 ARM-MULT 393 169 57 29 41 11 0 2 9 75 BACK 522 356 105 17 6 6 1 0 7 24 BODYSYSTEM 1119 345 200 96 197 23 62 53 10 133 CHEST 433 100 133 109 26 17 3 18 5 22 EAR(S) 6 1 2 0 0 0 0 0 0 3 ELBOW(S) 47 34 6 1 0 0 0 0 5 1 EYE(S) 61 6 41 0 0 1 2 0 3 8 FACE 189 46 69 3 14 4 4 2 3 44 FINGER(S) 629 8 152 306 18 56 1 1 0 87 FOOT/ANKLE 495 270 118 49 9 7 0 0 14 28 HAND(S) 359 35 47 34 125 20 0 5 15 78 HEAD 1528 976 364 58 14 41 0 2 25 48 HIP(S) 197 116 42 17 1 3 0 0 9 9 KNEE(S) 102 39 36 3 0 5 0 0 7 12 LEGS 564 274 177 38 6 13 0 1 21 34 LOWER ARM 48 23 12 2 3 2 0 0 2 4 LOWER LEG 151 54 67 13 0 3 0 0 5 9 MULTIPLE 1471 728 334 87 64 20 9 5 7 217 NECK 148 79 46 12 0 7 0 0 0 4 SHOULDER 94 45 27 3 5 2 0 0 8 4 UPPER ARM 26 7 7 0 8 1 0 0 0 3 UPPER LEG 38 14 18 3 0 2 0 0 0 1 WRIST(S) 142 105 19 5 2 2 0 1 3 5 BLOOD 45 0 0 0 0 0 43 1 0 1 KIDNEY 9 5 2 1 0 0 0 0 1 0 LIVER 6 2 1 1 0 1 0 0 0 1 LUNG 108 11 4 4 1 0 75 5 1 7 NERVE SYST 16 4 3 0 3 0 3 1 0 2 REPROD-SYS 5 3 0 0 0 0 0 0 0 2 OTHBODYSYS 255 53 17 12 17 0 11 70 4 71 Total 9358 3944 2156 934 567 253 214 168 166 956 Part of Body
38
Table 5 Correlation (p-value) between risk factors and accidents Environmental Condition Worker Behavior Injury Source Accident Type p < 0.001 p < 0.001 p < 0.001
39
Table 6 Key risk factors associated with accident types: (a) environmental condition, (b) worker behavior, (c) source of injury (a)
Risk Factor Observation Frequency Falls (Elevation)
Struck-By Caught In/ Between Electrial Shock Struck-Against Inhalation Respiratory Failure Falls (Same Level) Others
PINCH POINT ACTION 260 3 42 202 1 6 0 0 2 4 CATCH POINT/PUNCTURE ACTION 216 14 75 80 0 17 0 0 3 27 SHEAR POINT ACTION 222 3 84 78 1 33 0 0 0 23 SQUEEZE POINT ACTION 309 8 95 196 0 4 0 0 0 6 FLYING OBJECT ACTION 388 53 304 5 1 3 0 0 3 19 OVERHEAD MOVING/FALLING OBJ AC 954 244 555 87 24 16 0 4 8 16 GAS/VAPOR/MIST/FUME/SMOKE/DUST 297 4 16 6 0 1 174 6 0 90 MATERIALS HANDLG EQUIP./METHOD 744 215 278 81 62 44 8 4 12 40 CHEMICAL ACTION/REACTION EXPOS 47 1 5 0 0 2 16 2 2 19 FLAMMABLE LIQ/SOLID EXPOSURE 112 4 11 11 0 1 2 2 1 80 TEMPERATURE +/- TOLERANCE LEV. 123 1 4 3 12 0 0 11 4 88 RADIATION CONDITION 12 0 2 1 3 1 0 0 1 4 WORK-SURFACE/FACIL-LAYOUT COND 2443 1931 164 53 111 61 1 2 74 46 ILLUMINATION 27 8 8 1 5 0 0 3 1 1
OVERPRESSURE/UNDERPRESSURE 48 7 25 0 0 0 2 0 0 14 SOUND LEVEL 4 0 3 0 0 0 0 0 0 1
WEATHER, EARTHQUAKE, ETC. 134 65 26 3 6 0 1 6 3 24
OTHER 3018 1383 459 127 341 64 10 128 52 454
Total 9358 3944 2156 934 567 253 214 168 166 956
40 Table 6 continued
(b)
Risk Factor Observation Frequency Falls (Elevation)
Struck-By Caught In/ Between Electrial Shock Struck-Against Inhalation Respiratory Failure Falls (Same Level) Others
MISJUDGMENT, HAZ. SITUATION 2960 1178 684 386 231 86 68 17 49 261 NO PERSONAL PROTECTIVE EQ USED 12 6 2 0 1 0 0 1 1 1 NO APPROPR PROTECTIVE CLOTHING 1 0 0 0 0 0 0 0 0 1 MALFUNC IN SECURING/WARNING OP 554 224 185 54 27 17 6 10 5 26 DISTRACTING ACTIONS BY OTHERS 48 12 20 10 0 0 2 0 4 0 EQUIP. INAPPROPR FOR OPERATION 517 302 86 35 17 13 18 6 5 35 MALFUNC, NEUROMUSCULAR SYSTEM 46 23 7 0 0 2 0 4 6 4 PERCEPTION MALFUNC,TASK-ENVIR. 158 64 40 12 7 5 6 3 4 17 SAFETY DEVICES REMOVED/INOPER. 784 465 127 84 18 33 9 1 4 43 POSITION INAPROPRIATE FOR TASK 593 247 158 86 40 20 1 1 8 32 MATER-HANDLG PROCED. INAPPROPR 456 122 178 50 16 8 13 2 9 58 DEFECTIVE EQUIPMENT IN USE 73 32 23 9 3 0 0 1 2 3 LOCKOUT/TAGOUT PROCED MALFUNC 214 11 19 22 70 5 6 7 0 74 INSUFF/LACK/HOUSEKEEPING PROGRAM 30 11 2 1 0 0 0 0 9 7 INSUFF/LACK/EXPOS/BIOLOGCL MNTRG. 3 1 0 0 0 0 1 0 0 1 INSUFF/LACK/ENGINEERNG CONTROLS 255 110 56 31 2 5 38 1 0 12 INSUFF/LACK/WRITN WRK PRAC PROG. 174 66 36 24 17 6 3 6 0 16 INSUFF/LACK/RESPIRATORY PROCTECT 19 1 0 0 0 0 17 0 0 1
INSUF/LACK/PROTCV WRK CLTHG/EQUIP 370 218 42 4 40 10 4 1 6 45
OTHER 2091 851 491 126 78 43 22 107 54 319
Total 9358 3944 2156 934 567 253 214 168 166 956
41 Table 6 continued
(c)
Risk Factor Observation Frequency Falls (Elevation)
Struck-By Caught In/ Between Electrial Shock Struck-Against Inhalation Respiratory Failure Falls (Same Level) Others AIRCRAFT 0 0 0 0 0 0 0 0 0 0 AIR PRESSURE 34 2 22 0 0 1 1 0 0 8 ANIMAL/INS/REPT/ETC. 6 1 1 1 0 0 0 0 0 3 BOAT 9 4 1 0 0 0 2 1 0 1 BODILY MOTION 639 497 37 34 9 16 0 2 27 17 BOILER/PRESS VESSEL 34 1 6 0 0 0 0 0 0 27 BOXES/BARRELS, ETC. 23 4 13 6 0 0 0 0 0 0 BUILDINGS/STRUCTURES 1104 721 283 50 12 18 2 0 9 9 CHEM LIQUIDS/VAPORS 163 1 11 1 0 2 75 3 7 63 CLEANING COMPOUND 3 0 0 0 0 0 1 0 0 2 COLD (ENVIR/MECH) 0 0 0 0 0 0 0 0 0 0 DIRT/SAND/STONE 275 51 80 104 0 10 0 4 1 25 DRUGS/ALCOHOL 5 1 1 0 0 0 0 2 0 1 DUST/PARTICLES/CHIPS 12 1 6 0 0 0 2 1 0 2 ELEC APPARAT/WIRING 847 27 41 5 490 44 1 29 1 209 FIRE/SMOKE 167 0 12 17 0 0 11 0 1 126 FOOD 4 0 1 1 0 1 0 0 0 1 FURNITURE/FURNISHING 15 3 3 3 0 0 3 0 1 2 GASES 112 1 11 1 0 1 78 8 0 12 GLASS 12 2 7 2 0 0 0 0 0 1
HAND TOOL (POWERED) 488 5 283 68 10 39 1 0 1 81 HAND TOOL (MANUAL) 55 9 26 7 4 0 0 0 4 5 HEAT (ENVIR/MECH) 104 1 8 2 1 0 0 13 7 72 HOISTING APPARATUS 299 91 124 58 9 9 0 1 1 6 LADDER 702 661 14 3 7 3 0 4 7 3 Source of Injury
42 Table 6 continued
(c) continued
Risk Factor Observation Frequency Falls (Elevation)
Struck-By Caught In/ Between Electrial Shock Struck-Against Inhalation Respiratory Failure Falls (Same Level) Others MACHINE 437 38 125 205 2 38 1 0 3 25 MATERIALS HANDLG EQ. 474 72 239 121 8 16 0 1 3 14 METAL PRODUCTS 166 18 109 23 1 8 0 0 3 4 MOTOR VEHICLE (HWY) 267 14 203 34 0 4 0 0 1 11 MOTOR VEHICLE(INDUS) 283 36 139 84 1 13 0 0 1 9 MOTORCYCLE 3 2 0 0 0 0 0 0 0 1 WIND/LIGHTNING, ETC. 35 18 16 0 0 0 0 0 0 1 FIREARM 5 0 0 0 0 0 0 0 0 5 PERSON 26 14 7 1 0 0 0 0 1 3 PETROLEUM PRODUCTS 20 0 1 0 0 0 0 0 1 18 PUMP/PRIME MOVER 14 0 9 4 0 0 0 0 0 1 RADIATION 3 0 0 0 0 0 1 0 0 2 TRAIN/RAILROAD EQUIP 7 0 5 1 0 0 0 0 0 1 VEGETATION 11 1 9 1 0 0 0 0 0 0 WASTE PRODUCTS 10 0 2 1 0 0 6 0 0 1 WATER 40 4 10 2 1 0 3 5 2 13 WORKING SURFACE 1284 1154 38 13 2 12 0 1 51 13 OTHER 1135 487 252 81 10 18 10 92 33 152 FUME 17 2 0 0 0 0 13 0 0 2 MISTS 1 0 0 0 0 0 1 0 0 0 VIBRATION 1 0 1 0 0 0 0 0 0 0 NOISE 1 0 0 0 0 0 0 0 0 1 BIOLOGICAL AGENT 6 0 0 0 0 0 2 1 0 3 TOTAL 9358 3944 2156 934 567 253 214 168 166 956 Source of Injury
43
Table 7 Correlation (p-value) among different risk factors Environmental Condition Worker Behavior Injury Source Environmental Condition Worker Behavior p < 0.001 Injury Source p < 0.001 p < 0.001
44 Table 8 Key risk relationships contributing to accidents
Accident Type
Environmental Condition Worker Behavior Injury Source Frequency %
Working surface or layout condition Misjudgment of hazardous situation Working surface 251 6.36% Working surface or layout condition Misjudgment of hazardous situation Buildings or structures 134 3.40% Working surface or layout condition Safety devices removed or inoperative Working surface 129 3.27% Working surface or layout condition Misjudgment of hazardous situation Bodily motion 82 2.08% Working surface or layout condition Safety devices removed or inoperative Buildings or structures 73 1.85% Working surface or layout condition Malfunction in securing/warning operation Working surface 62 1.57% Working surface or layout condition Inappropriate equipment operation Working surface 62 1.57% Working surface or layout condition Lack of PPE Working surface 61 1.55% Working surface or layout condition Misjudgment of hazardous situation Ladder 60 1.52% Working surface or layout condition Lack of PPE Buildings or structures 50 1.27% Overhead moving or falling object action Misjudgment of hazardous situation Buildings or structures 53 2.46% Material handling equipment or method Misjudgment of hazardous situation Material handling equipment 37 1.72% Flying object action Misjudgment of hazardous situation Powered hand tool 24 1.11% Overhead moving or falling object action Inappropriate material handling procedure Buildings or structures 22 1.02% Pinch point action Misjudgment of hazardous situation Machine 24 2.57% Pinch point action Misjudgment of hazardous situation Material handling equipment 22 2.36% Squeeze point action Misjudgment of hazardous situation Machine 21 2.25% Overhead moving or falling object action Misjudgment of hazardous situation Dirt/sand/stone 14 1.50% Shear point action Safety devices removed or inoperative Machine 14 1.50% Material handling equipment or method Misjudgment of hazardous situation Material handling equipment 14 1.50% Squeeze point action Misjudgment of hazardous situation Industrial motor vehicle 13 1.39% Squeeze point action Misjudgment of hazardous situation Dirt/sand/stone 10 1.07% Working surface or layout condition Misjudgment of hazardous situation Electrical apparatus or wiring 34 6.00% Material handling equipment or method Misjudgment of hazardous situation Electrical apparatus or wiring 29 5.11% Working surface or layout condition Inappropriate task position Electrical apparatus or wiring 14 2.47% Overhead moving or falling object action Misjudgment of hazardous situation Electrical apparatus or wiring 11 1.94% Working surface or layout condition Lockout, tagout procedure malfunction Electrical apparatus or wiring 11 1.94% Working surface or layout condition Lack of PPE Electrical apparatus or wiring 9 1.59% Working surface or layout condition Safety devices removed or inoperative Electrical apparatus or wiring 6 1.06% Shear point action Safety devices removed or inoperative Powered hand tool 9 3.56% Working surface or layout condition Misjudgment of hazardous situation Electrical apparatus or wiring 8 3.16% Shear point action Safety devices removed or inoperative Machine 5 1.98% Working surface or layout condition Misjudgment of hazardous situation Working surface 5 1.98% Working surface or layout condition Safety devices removed or inoperative Buildings or structures 4 1.58% Catch point or puncture action Misjudgment of hazardous situation Powered hand tool 4 1.58% Catch point or puncture action Safety devices removed or inoperative Machine 4 1.58% Working surface or layout condition Misjudgment of hazardous situation Bodily motion 3 1.19% Working surface or layout condition Lack of PPE Dirt/sand/stone 3 1.19% Material handling equipment or method Misjudgment of hazardous situation Electrical apparatus or wiring 3 1.19% Material handling equipment or method Inappropriate task position Electrical apparatus or wiring 3 1.19% Shear point action Misjudgment of hazardous situation Powered hand tool 3 1.19% Gas, vapor, mist, fume, smoke, dust Misjudgment of hazardous situation Gases 27 12.62% Gas, vapor, mist, fume, smoke, dust Lack of engineering control Gases 24 11.21% Gas, vapor, mist, fume, smoke, dust Misjudgment of hazardous situation Chemical liquid or vapor 20 9.35% Gas, vapor, mist, fume, smoke, dust Lack of respiratory protection Chemical liquid or vapor 13 6.07% Gas, vapor, mist, fume, smoke, dust Lack of engineering control Chemical liquid or vapor 8 3.74% Gas, vapor, mist, fume, smoke, dust Inappropriate material handling procedure Chemical liquid or vapor 7 3.27% Gas, vapor, mist, fume, smoke, dust Misjudgment of hazardous situation Fume 7 3.27% Gas, vapor, mist, fume, smoke, dust Lockout, tagout procedure malfunction Chemical liquid or vapor 6 2.80% Gas, vapor, mist, fume, smoke, dust Inappropriate equipment operation Gases 5 2.34% Material handling equipment or method Inappropriate equipment operation Gases 5 2.34% Gas, vapor, mist, fume, smoke, dust Safety devices removed or inoperative Gases 4 1.87% Chemical action/reaction exposure Inappropriate equipment operation Gases 4 1.87% Gas, vapor, mist, fume, smoke, dust Malfunction in securing/warning operation Gases 3 1.79% Temperature +/- tolerance level Misjudgment of hazardous situation Heat 3 1.79% Chemical action/reaction exposure Misjudgment of hazardous situation Gases 2 1.19% Working surface or layout condition Misjudgment of hazardous situation Bodily motion 10 6.02% Working surface or layout condition Misjudgment of hazardous situation Working surface 7 4.22% Working surface or layout condition Misjudgment of hazardous situation Buildings or structures 3 1.81% Pinch point action Inappropriate material handling procedure Chemical liquid or vapor 2 1.20% Overhead moving or falling object action Misjudgment of hazardous situation Working surface 2 1.20% Working surface or layout condition Electrical apparatus or wiring Working surface 2 1.20% Respiratory failure Falls at the same level Falling from an elevation Struck-by Caught in/or between Electrical shock Struck-against Inhalation