ORIGINAL ARTICLE
Optimal allocation of fault current limiters for
sustaining overcurrent relays coordination in a
power system with distributed generation
A. Elmitwally
*, E. Gouda, S. Eladawy
Elect. Eng. Dept., Mansoura University, Mansoura 35516, Egypt
Received 10 November 2014; revised 30 April 2015; accepted 6 June 2015 Available online 3 July 2015
KEYWORDS Overcurrent relay; Coordination; Fault current limiter; Optimization
Abstract This paper addresses the problem of overcurrent relays (OCRs) coordination in the presence of DGs. OCRs are optimally set to work in a coordinated manner to isolate faults with minimal impacts on customers. The penetration of DGs into the power system changes the fault current levels seen by the OCRs. This can deteriorate the coordinated operation of OCRs. Operation time difference between backup and main relays can be below the standard limit or even the backup OCR can incorrectly work before the main OCR. Though resetting of OCRs is tedious especially in large systems, it cannot alone restore the original coordinated operation in the presence of DGs. The paper investigates the optimal utilization of fault current limiters (FCLs) to maintain the directional OCRs coordinated operation without any need to OCRs resetting irrespective of DGs status. It is required to maintain the OCRs coordination at minimum cost of prospective FCLs. Hence, the FCLs location and sizing problem is formulated as a constrained multi-objective optimization problem. Multi-objective particle swarm optimization is adopted for solving the optimization problem to determine the optimal locations and sizes of FCLs. The proposed algorithm is applied to meshed and radial power systems at different DGs arrangements using different types of FCLs. Moreover, the OCRs coordination problem is studied when the system includes both directional and non-directional OCRs. Comparative analysis of results is provided.
ª2015 Faculty of Engineering, Alexandria University. Production and hosting by Elsevier B.V. This is an open access article under the CC BY-NC-ND license (http://creativecommons.org/licenses/by-nc-nd/4.0/).
1. Introduction
Integration of distributed generation (DG) can improve relia-bility, reduce power losses, improve power quality, decrease
environmental pollution and diminish the need for network expansions. The protection devices are set to have a coordi-nated operation to isolate faults with minimum impact on cus-tomers. When DG units are connected to a distribution network, the magnitude and direction of fault current will be changed. So, the coordination between the network protection devices may vanish[1]. Autorecloser-fuse miscoordination and relay–relay miscoordination can occur. Size of DG, location of DG, and type of DG (static or rotating machine) influence the * Corresponding author.
E-mail address:[email protected](A. Elmitwally).
Peer review under responsibility of Faculty of Engineering, Alexandria University.
H O S T E D BY
Alexandria University
Alexandria Engineering Journal
www.elsevier.com/locate/aej www.sciencedirect.com
http://dx.doi.org/10.1016/j.aej.2015.06.009
1110-0168ª2015 Faculty of Engineering, Alexandria University. Production and hosting by Elsevier B.V. This is an open access article under the CC BY-NC-ND license (http://creativecommons.org/licenses/by-nc-nd/4.0/).
share of DG in total fault current. Thus, these factors determine the DG effect on protection system coordination [2]. Directional overcurrent relays (DOCR) form the primary protection of distribution and sub-transmission systems and the secondary protection of transmission systems. The over-current relay (OCR) coordination is realized by adjusting the pickup current setting (Ip) and the time dial setting (TDS) of
OCR for increasing the selectivity and reliability of protective system[3]. Setting of OCRs is difficult, especially in the multi-loop, multi-source networks. Trial and error, topological anal-ysis, and optimization methods are used for OCRs setting[4]. The possible solutions to the OCR miscoordination prob-lem in power delivery system (PDS) with and without DGs are searched. In case of PDS without DG, the authors in[5] reported an approach to break all system loops and coordinate the breakpoint for both directions. In [6,7], a linear graph theory method was used to determine a set of breakpoints. Furthermore, optimization approaches such as dual simplex [8,9] and genetic algorithms [10] were used to minimize the relay operating times. To provide coordination between OCRs under the presence of DG, various techniques are pro-posed [4]. Ref. [11]discussed the high-impedance protection applications for tripping acceleration. But this method depends on current transformer (CT) whose dynamic behavior influences the protection stability. Ref.[12]proposes utilizing the distribution automation system capabilities for protection coordination. One drawback of this method is that the number of protection zones increases when the number of DGs increases. So, many isolating circuit breakers will be needed and the scheme may not be economic. Communication-assisted digital relay approach is presented in[13]to achieve coordinated operation of OCRs. Complexity and enlarged fail-ure rates are major concerns in this method. Ref.[14]reviews the protection schemes and coordination techniques in micro-grid systems. A neural network and backtracking-based
protection coordination scheme for distribution system with DG is presented in[15].
One approach to control fault current in the presence of DG is the use of Fault Current Limiter (FCL)[16]. FCL basi-cally provides nearly zero impedance in normal operation without energy loss or voltage drop. If a fault occurs, the FCL will insert high impedance within few milliseconds. This reduces the fault currents to lower levels within circuit breakers capabilities [16]. FCLs can be divided into three main cate-gories [17]: passive FCLs, solid-state FCLs, and hybrid FCLs. The passive FCL simply inserts a current-limiting inductance without external control signals. The solid-state FCL is formed by power electronics equipment and sensors. The hybrid FCLs use combination of mechanical switches, solid-state devices, superconducting elements and other tech-nologies to mitigate fault current [17]. FCLs are generally sophisticated and expensive equipment. The FCL size is defined as the impedance value it introduces under fault condi-tions. FCL cost typically increases when its size increases. Placement and sizing of FCLs in a PDS greatly determine its impact on protection system. In[18], genetic algorithm-based method was implemented to determine the optimal number and locations of FCLs in a radial distribution system with DG to minimize the total cost of protective devices. In[19], the optimal FCLs sizes in a distribution system with DG are determined. Nonetheless, the FCLs locations are hypotheti-cally assumed and their cost is not considered. In[20], FCLs are utilized to restore DOCRs coordination in the presence of DG. So, the optimal OCRs settings without DG are main-tained with DG. This avoids any need to OCRs resetting. The latter is a tedious task especially in a large scale PDS. Besides, it may not be adequate to keep OCRs coordination in the presence of DG. However, sizes and locations of FCLs are estimated by trial and error in[20]and cannot be optimal from performance and cost perspectives.
Nomenclature
A,B,C relay characteristic constants
CTI coordination time interval for backup-primary relay pair (in seconds)
i,j relay indices
Ifi ith relay near-end-fault current (in Amps).
Ifj;i jth relay fault current for near-end fault at ith
relay(in Amps)
Ipi ith relay pickup current setting (in Amps) Ipimin;Ipimin lower and upper limits ofIpi
Ipi;Fixed specific value ofIpi
J sum of operation time of the primary relays (in seconds)
LDC local distribution company
Mi ith relay multiple of pickup current
Mj;i jth relay multiple of pickup current for the ith
relay near-end fault
N total number of overcurrent relays in the systemN Np number of backup-primary OCR pairs
RCTI revised coordination time interval for the backup-primary relay pair (in seconds)
ti operating time of the ith primary relay for near-end fault (in seconds)
tj;i operating time of thejth backup relay for near-end
fault at theith primary relay (in seconds) Dt operating time difference =tj;iti
TDSi time dial setting for theith relay
TDSimin;TDSimax lower and upper limits of TDSi
FCL fault current limiter R-FCL resistive fault current limiter X-FCL inductive fault current limiter Z-FCL resistive-inductive fault current limiter
tB;bDG operating time of backup relay before DG tM;bDG operating time of main relay before DG tB;aDG operating time of backup relay after DG tM;aDG operating time of main relay after DG Ri resistance of theith FCL
Xi inductive reactance of theith FCL
L number of FCLs
Rmin, andRmax lower and upper limits of FCL resistance
Xmin, andXmax lower and upper limits of FCL inductive reactance
In this paper, the FCLs are used to restore the coordination between the OCRs in PDS with DG maintaining the PDS reliability [20]. The FCLs allocation problem involves more than one objective function such as level of fault current damping and FCLs sizes. These objectives are contradictory and of different dimensions. So, the problem is formulated as a multi-objective constrained nonlinear programming problem. The interaction among different objectives gives rise to a set of compromised solutions, largely known as the trade-off, non-dominated, or Pareto-optimal solutions [21]. The main contributions of this paper are as follows:
1. Propose a main-backup OCR-pairs coordination index in the presence of DGs.
2. Present a new multi-objective formulation of the OCRs coordination maintenance problem in PDS with DGs by FCLs.
3. Both optimal locations and sizes of FCLs are searched with no pre-assumptions.
4. Consider a mixed system of both directional and non-directional OCRs.
5. Study the OCRs coordination problem in both looped and radial networks.
The main objective was to simultaneously minimize the proposed main-backup OCR-pairs coordination maintenance index and the total cost (size) of required FCLs. The optimiza-tion problem is solved using Particle Swarm Optimizaoptimiza-tion (PSO). Comparative analysis of results is provided.
2. Proposed relay coordination restoration approach
2.1. Determination of the original relay coordination
The time dial setting defines the operation time (t) of the OCR for each relay current value (I).Mis the current multiple of the pickup current value, i.e. M=I/Ip. t is normally given as a
function ofM based on the OCR characteristics. The IEEE OCR characteristics are adopted in this work and are given as[22–24]: ti¼TDSi A MC i 1 þB withMi¼ Ifi Ipi ð1Þ tj;i¼TDSj A MCj;i1þB ! withMj;i¼ Ifj;i Ipj ð2Þ The primary objective of the OCR coordination problem is to minimize the sum of operation times of the primary OCRs as given by(3).
MinimizeJ¼X
N
i¼1
ti ð3Þ
The time dial setting and pickup current setting are deter-mined for each relay provided that certain coordination con-straints are met [22]. For this purpose, a two-phase optimization model is mathematically formulated in (3)–(9) [20]. In Phase 1, the objectiveJgiven in(3)is minimized sub-ject to the set of constraints given in(4)–(6). In Phase 2, the
objective J given in(3)is minimized subject to another set of constraints given in7–9to further tune the determined OCR setting in Phase 1.
(i) For Phase 1
There are relay setting constraints as in(4), (5)and backup-primary OCR pair constraints as in(6) [23].
IpiminIpiIpimax ð4Þ
TDSiminTDSiTDSimax ð5Þ
tj;itiCTI ð6Þ
The backup protective OCR should not operate until the primary OCR fails to operate. When the interval CTI is exceeded, backup relay should act[25]. The value of CTI is chosen based on the LDC practice. It accounts for relay oper-ating time, the breaker operoper-ating time, and safety margin for relay error.
(ii) For Phase 2
Ipi determined in Phase 1 is approximated to the nearest
standard value and kept fixed during the search process. CTI is modified to a lower practical value RCTI.
Ipi¼Ipi;Fixed ð7Þ
TDSiminTDSiTDSimax ð8Þ
tj;itiRCTI ð9Þ
2.2. Restoration of the original relay coordination
The backup-main OCR pairs (BMOP) coordination deter-mined above without DGs can deteriorate by integrating DGs to the system. To maintain the original OCRs coordi-nated settings in the presence of DGs, it is proposed to use optimally allocated FCLs. The set of required FCLs impe-dance values is a function of DG capacity, number of DGs, and DGs locations [23]. Keeping the original relay settings unchanged, optimal FCLs can almost keep the same OCR fault current before DG integration, and hence the same OCR operating time. This in turn maintains the desired original coordinated operation of BMOP irrespective of DGs status.
3. Problem formulation
It is assumed that BMOP are properly set to assure coordi-nated operation in a DG-free PDS. Integration of DG will feed additional fault current that may lead to loss of coordination of protective OCRs. Thus, the main objective of this paper was to minimize such change in the OCR-seen fault current levels by optimal placement and sizing of FCLs. This keeps the coordinated operation of BMOP. The coordination index of BMOP (RPCI) is proposed as follows:
RPCI¼X
Np
n¼1
The ideal value of RPCI is zero as it means perfect coordi-nation between BMOP under DGs.
The FCLs-based BMOP coordination maintaining problem is formulated as multi-objective constrained nonlinear opti-mization problem. Objective functions: Min F1¼RPCI ð11Þ Min F2¼X L k¼1 RkþXk ð12Þ
The above problem is solved subject to the following inequality constraints:
RminRiRmax ð13Þ
XminXiXmax ð14Þ
tB;aDGtM;aDG>RCTI ð15Þ
4. Solution algorithm
The maximum number of FCLs to be connected to the system equals the sum of number of lines and number of power sources. Particle swarm optimization (PSO) is presented recently as an efficient heuristic search method to obtain the global or quasi-global optimal solution in power system opti-mization problems[23,26]. Single objective PSO searches the minimum or maximum value of a single objective function. Multi-objective PSO (MOPSO) searches the minimum values of multiple objectives simultaneously. Since these objectives can be conflicting, the problem has a set of candidate compro-mised solutions rather than a single solution. This set of differ-ent solutions is known as the Pareto optimal set. Three main issues are considered on implementing MOPSO [26]. These include giving preference to non-dominated solutions, retain-ing the non-dominated solutions found durretain-ing the search pro-cess, and maintaining diversity in the swarm. MOPSO is well explained in[27,28]. It is employed to solve the optimization problem formulated in (11)–(15). The solution algorithm is implemented as given below.
1. Disconnect all DGs, apply a solid symmetrical three-phase fault at the nearest bus to each main OCR (one at a time), the short circuit currents seen by this OCR and its backup OCRs are calculated. Estimate the operation time of each BMOP from(1) and (2).
2. Set the time countert= 0 and generate randomlyn parti-cles, {Xj(0),j= 1,. . .,n}. Similarly, generate randomly ini-tial velocities of all particles, {Vj(0), j= 1, . . ., n}. Each particle includes values for all control variables to be opti-mized, resistance and inductance for each possible FCL. Set the initial value of the inertia weight.
3. Connect all DGs. Insert the FCLs estimated by a particle (possible set of FCLs). Apply a solid symmetrical three-phase fault at the nearest bus to each main OCR (one at a time), the short circuit currents seen by this OCR and its backup OCRs are calculated. Estimate the operation time of each BMOP from (1) and (2). Repeat for all particles.
4. Calculate the objectives F1, F2 values for each particle using(11) and (12). Then, compute the fitness value of each particle using a dynamic weighted aggregating approach [29]as in(16): Fitness¼1 X Q i¼1 wiFi , ð16Þ where
wiis a weighting factor such that
P wi= 1.
Fiis the value of theith objective function.
Qis the number of objective functions.
5. Search for the non-dominated solutions and form the non-dominated global setS**(0). The best member in
S**(0) is selected as the global best Xj**(0). Set the external set equal toS**(0).
6. Update the time countert=t+ 1. 7. Update the inertia weight.
8. Update the particle velocity and position.
9. The updated position of the jth particle is added to
Sj*(t). Truncate the dominated solutions in Sj*(t). If the size of Sj*(t) exceeds a prespecified value, reduce the size to its maximum limit by the hierarchical cluster-ing algorithm[27].
10. Perform the union of all non-dominated local sets to produce the non-dominated global setS**(t). If the size of S**(t) exceeds a maximum limit, reduce this set size by hierarchical clustering algorithm.
11. Copy the members ofS**(t) to the external Pareto set. If the number of the Pareto set members exceeds the maximum size, reduce the set by means of clustering. 12. Measure the individual distances between members in
Sj*(t), and members in S**(t) in the objective space. The members ofSj*(t) andS**(t) that give the minimum distance are selected as the local best and the global best, respectively.
13. If the termination criterion is met, then stop. Else go to step 3.
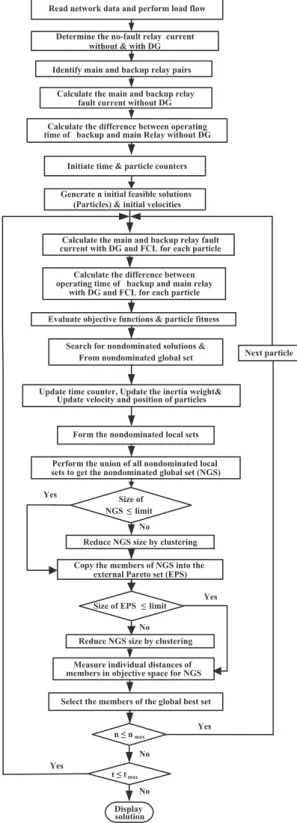
Flowchart of restoring OCRs coordination using optimal FCLs is shown inFig. 1.
5. Results and discussion
A meshed system and a radial system are analyzed in this work. The meshed system under study is a part of the IEEE 30-bus system [30]depicted in Fig. 2. This PDS is assumed to have 29 DOCRs. The radial system is the IEEE33-bus radial distribution system shown inFig. 3. It has 33 DOCRs located as depicted inFig. 3. It is assumed that all OCRs are identical and have the standard IEEE relay curves with the following constants 0.0515, 0.114, and 0.02 forA,B, andC, respectively [31]. The IEEE 33-bus test system data are provided in[32]. OCRs are assumed to be optimally-set and well-coordinated before DG integration. CTI is assumed to be 0.3 s for each backup-primary OCR pair. The chosen DG technology is a synchronous-type, operating nominally at 0.9 lagging power factor, and has a 0.15 p.u. transient reactance based on its capacity. The DG is practically connected to the PDS bus through a transformer with 0.05 p.u. reactance based on its capacity[24].
5.1. Meshed system
Three scenarios are examined to evaluate the effectiveness of FCLs in restoring the original OCRs coordination for a meshed PDS with DGs.
(i) Scenario A: It is the base case with well-established relay coordination, where there is no DG in the PDS. (ii) Scenario B: DGs are connected. It is the worst case as
OCRs miscoordination arises.
(iii) Scenario C: It illustrates the proposed approach of installing optimally-allocated FCLs to restore the BMOP coordination.
5.1.1. Scenario A: BMOP coordination without DGs
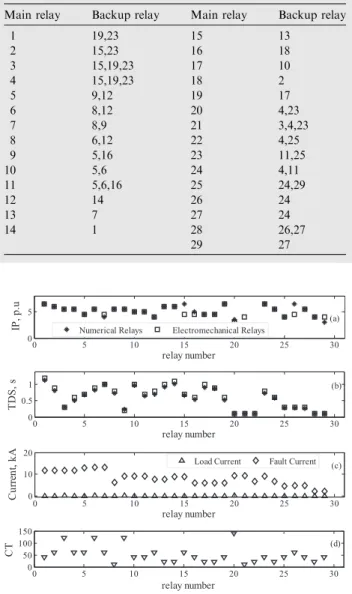
Each OCR represents a main protection and has other OCRs serving as a backup protection. So, Table 1 defines backup OCRs for each relay in the meshed system[20].
The two-phase BMOP optimal setting process discussed in Section2is carried out using GAMS software[33]. The mini-mum and maximini-mumIplimits are chosen to be 1.25 and 2 times
the maximum no-fault current seen by each OCR, respectively. On the other hand, the minimum TDS is assumed to be 0.1 s in all cases. The obtained relaysIpare rounded and kept fixed at
the nearest standard setting.
Due to rounding theIpresults obtained in Phase 1, the CTI
constraints in(4)are violated for 15 pairs out of the 50 BMOP. The chosen RCTI values are 0.284 s and 0.27 s for numerical and electromechanical OCRs, respectively. After conducting Phase 2 of OCR optimal setting given in(3), (7), (8) and (9) using GAMS, the obtained rounded Ip and TDS settings satisfy the constraints(7)–(9)for all OCRs. Fig. 4shows the optimal settings of the primary DOCRs in the meshed system.
5.1.2. Scenario B: relay coordination in the presence of DG
DG changes the value of fault current, and it may bring miscoordination between the BMOP.Fig. 5 reports samples of relay normal load current, near-end-fault current and DG-supplied fault current in the meshed system for single-DG operation at bus 12 and at bus 19. For single-DG at bus 12, mis-coordination occurs for five BMOP, based on RCTI threshold (0.27 s).Fig. 6a comparesDtof related BMOP in the meshed s s e n t i f e l c i t r a p & s n o i t c n u f e v i t c e j b o e t a u l a v E n ≤ nmax Next particle Calculate the difference between
operating time of backup and main relay with DG and FCL for each particle
Display solution Yes
Generate n initial feasible solutions (Particles) & initial velocities
Yes
t ≤ tmax
Calculate the main and backup relay fault current with DG and FCL for each particle
Search for nondominated solutions & From nondominated global set
Copy the members of NGS into the external Pareto set (EPS)
Reduce NGS size by clustering
Measure individual distances of members in objective space for NGS
Select the members of the global best set Update time counter, Update the inertia weight&
Update velocity and position of particles
Form the nondominated local sets
Perform the union of all nondominated local sets to get the nondominated global set (NGS)
Size of NGS ≤ limit
Reduce NGS size by clustering
Size of EPS ≤ limit Initiate time & particle counters Calculate the main and backup relay
fault current without DG Read network data and perform load flow
Determine the no-fault relay current without & with DG
Calculate the difference between operating time of backup and main Relay without DG
Identify main and backup relay pairs
No No No No Yes Yes
Figure 1 Flowchart of restoring OCRs coordination using optimal FCLs.
Figure 3 IEEE 33-bus radial system.
Table 1 Main and backup relay in the meshed system.
Main relay Backup relay Main relay Backup relay
1 19,23 15 13 2 15,23 16 18 3 15,19,23 17 10 4 15,19,23 18 2 5 9,12 19 17 6 8,12 20 4,23 7 8,9 21 3,4,23 8 6,12 22 4,25 9 5,16 23 11,25 10 5,6 24 4,11 11 5,6,16 25 24,29 12 14 26 24 13 7 27 24 14 1 28 26,27 29 27
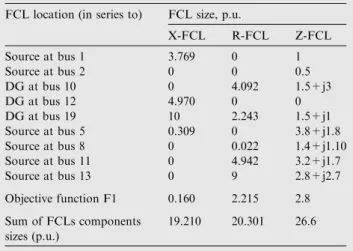
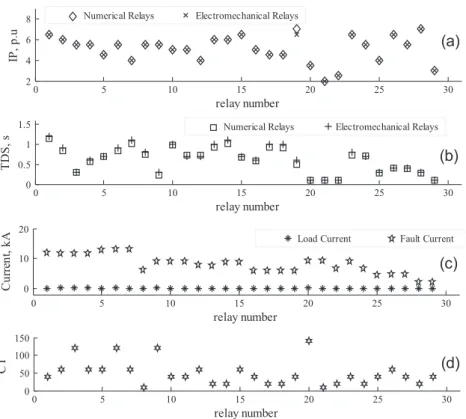
Figure 4 Optimal settings for primary DOCRs in meshed system. (a) The pickup current (IP, p.u.), (b) the time dial setting
(TDS, s), (c) the normal load and fault currents, (d) the current transformer ratio.
Figure 5 Samples of normal load relay current, near-end-fault relay current, and DG-supplied fault current in the meshed system (a) DG at bus 12, (b) DG at bus 19.
Figure 6 BMOP miscoordination in the meshed system (a) for DG at bus 12, (b) for DG at bus 19.
system with and without DG for a DG installed at bus 12. It is clear that Dt is reduced in the presence of DG. In Fig. 6b, BMOP miscoordinations in the meshed system are reported for a DG installed at bus 19. Eight BMOP (23,1 & 9,5 & 8,6 & 12,6 & 8,7 & 16,11 & 18,16 & 11,23) have lower (Dt) than RCTI. Backup relay operates before the primary one for other two pairs (19,1 & 9,7). For one DG at buses (10, 12, 15, 16, 17, 18, 19, 21, 24, 27, 30)Table 2shows the number of BMOP mis-coordinations in the meshed system for each DG location. This BMOP miscoordination problem is solved by using FCLs as in Scenario C below.
5.1.3. Scenario C: restoration of DOCRs coordination by FCLs
(1) Single-objective function using PSO
For two 10 MVA DG units connected to buses 12 and 19 in the PDS of Fig. 2, many BMOP miscoordinations occur. Optimal FCLs to restore coordination are determined firstly by solving the optimization problem discussed in Section 3 considering only a single objective in(11).Table 3shows the minimum X-FCLs sizes and locations required to restore all BMOP coordination. The sum of obtained minimum X-FCL sizes is 24.5 p.u. Further, for three 10 MVA DGs at buses 10, 12, and 19, the FCL results are given in Table 4for X-FCL, R-FCL and Z-FCL types. The choice of the most proper FCL type depends on the PDS operators experience and FCL types’ costs. The results obtained by the proposed method in Tables 3 and 4are compared to those obtained in [20] and given in Tables 5 and 6. It is remarked that the proposed method, even for single objective, results in coordinating all
BMOP at much lower size/cost of the required FCLs for all DG conditions. This may be attributed to that the locations of FCLs are assumed empirically in[20], whereas the proposed method identifies the optimal sizes and locations of FCLs.
(2) Multi-objective function
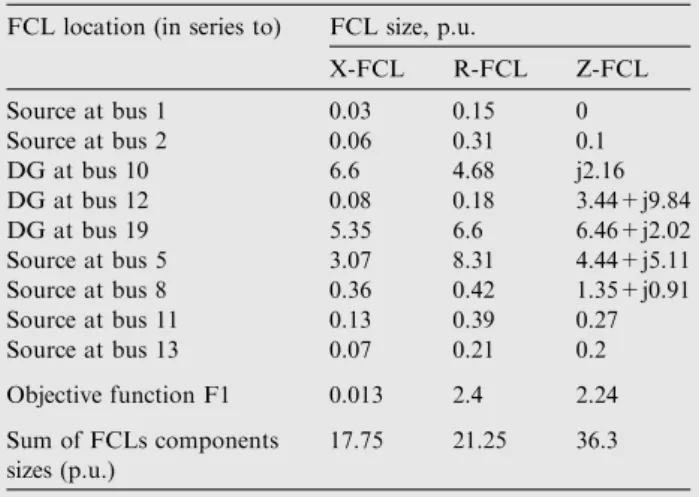
MOPSO is used to solve the full multi-objective FCLs allo-cation problem formulated in11–15for the meshed test sys-tem. Three 10MVA DG units are connected at buses 10, 12, 19 in the PDS shown inFig. 2.Figs. 7–9give the determined optimal X-FCLs, R-FCLs, and Z-FCLs, respectively. For the three FCLs types, all BMOP coordination is maintained after DG integration. The optimal value of (F1) is 1.5, 0.04 and 1.7 s for X-FCLs, R-FCLs, and Z-FCLs, respectively. The sum of required FCLs components sizes (F2) is 0.294, 1.85 and 2.3 p.u. for X-FCLs, R-FCLs, and Z-FCLs, respec-tively. F1 and F2 values are clearly less than their counterparts obtained by single-objective optimization or the method in [20].Table 7indicatesDtof selected BMOP for various scenar-ios. Marked cells inTable 7refer to miscoordination case.
5.1.4. Optimal identification of FCLs using genetic algorithm
Three 10 MVA DGs at buses 10, 12, and 19 are integrated to the meshed PDS ofFig. 2as in Section5.1.3above. This makes many BMOP lose coordination. Optimal FCLs to restore coordination are determined by solving the optimization prob-lem discussed in Section3considering only a single objective in (11)by genetic algorithm. The obtained FCL results are given inTable 8for X-FCL, R-FCL and Z-FCL types. The results obtained in Tables 8 are comparable to those obtained in Table 4 by PSO. The PSO and genetic algorithm methods got similar solutions to the FCLs identification problem in terms of the value of the objective function F1 and the sum of FCLs components sizes for the X-FCL, R-FCL, and Z-FCL types. However, PSO tends to lower the number of the determined FCLs for X-FCL and R-FCL types. Also, PSO obviously lowers the sum of FCLs components sizes of the determined FCLs for the Z-FCL type. For 200 particles and 200 iterations, PSO algorithm is completed in 393 min on Dual Core, 2.13 GHz, and 4 GB RAM PC. The genetic Table 2 Number of relay-pairs miscoordination.
DG location Dt< RCTI Backup relay operates before primary relay
Bus 10 0 6 Bus 12 0 5 Bus 15 2 8 Bus 16 0 6 Bus 17 0 6 Bus 18 2 7 Bus 19 2 8 Bus 21 0 5 Bus 24 1 8 Bus 27 0 3 Bus 30 0 3
Table 3 Determined FCLs for 2 DGs at buses 12, 19.
FCL location (in series to) X-FCL size, p.u.
Source at bus 1 1.858 DG at bus 12 10 DG at bus 19 10 Source at bus 5 2.469 Source at bus 13 0.014 Objective function F1 1.263
Sum of FCLs components sizes (p.u.) 24.5
Table 4 Determined FCLs for 3 DGs at buses 10, 12, 19 using PSO.
FCL location (in series to) FCL size, p.u.
X-FCL R-FCL Z-FCL Source at bus 1 3.769 0 1 Source at bus 2 0 0 0.5 DG at bus 10 0 4.092 1.5+j3 DG at bus 12 4.970 0 0 DG at bus 19 10 2.243 1.5+j1 Source at bus 5 0.309 0 3.8+j1.8 Source at bus 8 0 0.022 1.4+j1.10 Source at bus 11 0 4.942 3.2+j1.7 Source at bus 13 0 9 2.8+j2.7 Objective function F1 0.160 2.215 2.8 Sum of FCLs components sizes (p.u.) 19.210 20.301 26.6
algorithm is completed in 605 min for population size of 200 chromosomes and 200 generations. This indicates the superior-ity of PSO over genetic algorithm in terms of the optimization results and solution speed.
5.2. IEEE 33-bus radial distribution system
BMOP are listed in Table 9. Two 10 MVA DG units are connected at buses 2, 33 as revealed inFig. 3.
(1) Single-objective function
Table 10 presents the determined optimal X-FCLs, R-FCLs, and Z-FCLs for only single objective function, RPCI in(11), using PSO.
Table 5 X-FCLs determined in[20].
Table 6 R-FCLs determined in[20].
Figure 7 Determined X-FCLs for three DGs in the meshed test system.
Figure 9 Determined Z-FCLs for three DGs in the meshed test system.
Table 7 Dtof selected primary-backup relay pairs.
Table 8 Determined FCLs for 3 DGs at buses 10, 12, 19 using genetic algorithm.
FCL location (in series to) FCL size, p.u.
X-FCL R-FCL Z-FCL Source at bus 1 0.03 0.15 0 Source at bus 2 0.06 0.31 0.1 DG at bus 10 6.6 4.68 j2.16 DG at bus 12 0.08 0.18 3.44+j9.84 DG at bus 19 5.35 6.6 6.46+j2.02 Source at bus 5 3.07 8.31 4.44+j5.11 Source at bus 8 0.36 0.42 1.35+j0.91 Source at bus 11 0.13 0.39 0.27 Source at bus 13 0.07 0.21 0.2 Objective function F1 0.013 2.4 2.24 Sum of FCLs components sizes (p.u.) 17.75 21.25 36.3
Table 9 Main and backup DOCR for IEEE 33-bus radial system.
Main relay Backup relay Main relay Backup relay
2 1 17 16 3 2 18 1 4 3 19 18 5 4 20 19 6 5 21 20 7 6 22 2 8 7 23 22 9 8 24 23 10 9 25 5 11 10 26 25 12 11 27 26 13 12 28 27 14 13 29 28 15 14 30 29 16 15 31 30 32 31
Table 10 FCLs obtained by single objective PSO for IEEE 33-bus radial system.
FCL location (in series to) Size, p.u.
Z-FCL X-FCL R-FCL Source at bus 1 1.55+j0 1.81 1.53 DG at bus 2 5.67+j9.49 20 16.67 DG at bus 33 10+j10 20 20 F1, s 2.99 3.41 2.79 Sum of FCLs components sizes (p.u.) 36.72 41.81 38.21
(2) Multi-objective functions
Figs. 10–12 give the determined optimal X-FCLs, R-FCLs, and Z-FCLs, respectively. For the three FCLs types, all BMOP coordination is maintained after DG integra-tion. The optimal value of (F1) is 2.1, 1.7 and 3.02 s for X-FCLs, R-FCLs, and Z-FCLs, respectively. The sum of required FCLs components sizes (F2) are 5.9, 7.5 and
6.07 p.u. for X-FCLs, R-FCLs, and Z-FCLs, respectively. The sum of the FCLs components sizes (F2) obtained by mul-tiple objective optimization are clearly less than those obtained by single-objective optimization. Table 11 indicates Dt of selected BMOP for various scenarios using X-FCLs. Insertion of X-FCLs enables to make Dt above 0.27 s (RCTI) to assure coordination of all BMOP as indicated in the third column ofTable 11. It is noted that FCLs sizes are
Figure 10 Determined X-FCLs for two DGs in IEEE 33-bus radial system.
much bigger for the radial system compared to the meshed system.
5.3. Mix of directional and non-directional OCRs
For the meshed system inFig. 2, if the OCRs 1, 5, 16, 29 are replaced by non-directional OCRs, the primary-backup relay pairs change. Fig. 13 reveals the new primary-backup relay pairs. Main relays are set on thex-axis. Corresponding backup ones are shown by bars. Using the same data and method in Section5. A above,Fig. 14illustrates the obtained final opti-mal settings of primary OCRs for this case. For three 10 MVA DGs at buses 10, 12, and 19, the optimal FCLs are determined by solving the optimization problem in(13)–(15) considering only single objective F1 in (11) using PSO. Results are given in Table 12 for X-FCL, R-FCL, Z-FCL types. The choice of the proper FCL type depends on opera-tors experience and FCL type’s cost. The sum of FCLs compo-nents sizes is close to the case of considering only DOCRs for all FCL types.
6. Conclusion
The paper is focused on maintaining the directional OCRs coordinated operation in PDS with DGs. Application of FCLs is adopted as an effective solution that would save any need to OCRs resetting. Optimal locations and sizes of FCLs are searched to accomplish OCRs coordination at minimum cost of prospective FCLs. Therefore, the FCL locating and siz-ing problem is formulated as a constrained multi-objective optimization problem. BMOP coordination index and the sum of FCLs components sizes are considered as the two objectives to be minimized. The proposed algorithm is applied to meshed and radial power systems at different DGs arrange-ments using different types of FCLs. Furthermore, the OCRs Figure 12 Determined Z-FCLs for two DGs in IEEE 33-bus radial system.
Table 11 Dtof selected BMOP in IEEE 33-bus radial system.
Figure 13 Primary-backup relay pairs for mixed directional and non-directional OCRs.
coordination problem is studied when the system includes both directional and non-directional OCRs. Results show that
Optimal installation of FCLs maintains coordination of all BMOP.
Multi-objective optimization results in drastically less sum of FCLs components sizes than using only BMOP coordi-nation index as the only objective. This is noticed for all DG conditions, for all FCLs types and for the two case study systems.
There is no much difference in the sum of FCLs compo-nents sizes for the resistive, inductive, and compound FCL types. However, resistive FCL type achieves markedly better value for BMOP coordination index.
The sum of FCLs components sizes is much bigger for radial PDS than meshed PDS.
References
[1] Salman Hemmati, Javad Sadeh, Applying superconductive fault current limiter to minimize the impacts of distributed generation on the distribution protection systems, in: 11th International Conference on Environment and Electrical Engineering (EEEIC), 2012, pp. 808–813.
[2] U. Khan. Impact of Distributed Generation on Electrical Power. Network. www.wppt.pwr.wroc.pl.
[3]Abbas Saberi Noghabi, Habib Rajabi Mashhadi, Javad Sadeh, Optimal coordination of directional overcurrent relays considering different network topologies using interval linear programming, IEEE Trans. Power Delivery 25 (3) (2010) 1348– 1354.
[4]A.Y. Abdelaziz, H.E.A. Talaat, A.I. Nosseir, Ammar A. Hajjar, An adaptive protection scheme for optimal coordination of overcurrent relays, Electric Power Syst. Res. 61 (1) (2002) 1–9. [5] A.H. Knable. A standardised approach to relay coordination. in
Proc. IEEE Power Eng. Soc. Winter Meeting, New York, 1969, pp. 58–62.
[6] M.H. Dwaraknath. L. Nowitz, An application of linear graph theory for co-ordination of directional overcurrent relays, in: Proc. SIAM Conf. Elect. Power Problems: Math. Challenge, Seattle, 1980, pp. 104–114.
Figure 14 Optimal settings of primary relays for mixed directional and non-directional OCRs. (a) The pickup current (IP, p.u.), (b) the
time dial setting (TDS, s), (c) the normal load and fault currents, (d) the current transformer ratio.
Table 12 Determined FCLs for 3 DGs at buses 10, 12, 19 with mixed OCRs (single objective).
FCL location (in series to) FCL size, p.u.
X-FCL R-FCL Z-FCL Source at bus 1 2.769 1 0.08+j0.08 Source at bus 2 0 0.2 0.01+j0 DG at bus 10 0.01 0.01 3.76+j6.02 DG at bus 12 5.970 3.24 0.06+j0.02 DG at bus 19 10 10.21 6.51+j0 Source at bus 5 1.309 10.02 5.42+j2.78 Source at bus 8 1 2.94 0.41+j1.3 Source at bus 11 0 0 0 Source at bus 13 0.05 0.01 0.49+j0.115 Objective function F1 3.12 3.34 2.745 Sum of FCLs components sizes (p.u.) 21.4 18.64 27.07
[7] Damborg et al., Computer aided transmission protection system design, part I: Algorithm, IEEE Trans. Power App. Syst. PAS-103(1) (1984) 51–59.
[8]A.J. Urdaneta, H. Restrepo, S. Marquez, J. Sanchez, Coordination of directional overcurrent relay timing using linear programming, IEEE Trans. Power Delivery 11 (1) (1996) 12–129.
[9]H.A. Abyaneh, M. Al-Dabbagh, H.K. Karegar, S.H. Sadeghi, R.A. Khan, A new optimal approach for coordination of overcurrent relays in interconnected power systems, IEEE Trans. Power Del. 18 (2) (2003) 430–435.
[10] C.W. So, K.K. Li, K.T. Lai, K.Y. Fung, Application of genetic algorithm to overcurrent relay grading coordination, in: Proc. 6th Int. Conf. Developments in Power System Protection, 1997, pp. 60–69.
[11]J. Jager, L. Shang, High-impedance protection applications for tripping acceleration in networks with DG, Trans. Distribut. Conf. Exhib. (2005) 1–5.
[12]S.A. Javadian, M.-R. Haghifam, Protection of distribution networks in presence of DG using distribution automation system capabilities, IEEE Power Energy Soc. Gen. Meet. (2008) 1–6.
[13]Eric Sortomme, S.S. Venkata, Joydeep Mitra, Microgrid protection using communication-assisted digital relays, IEEE Trans. Power Delivery 25 (4) (2010).
[14]A.R. Haron, A. Mohamed, H. Shareef, A review on protection schemes and coordination techniques in microgrid system, J. Appl. Sci. 12 (2) (2012) 101–112.
[15]H. Zayandehroodi, A. Mohamed, H. Shareef, M. Farhoodnea, A novel neural network and backtracking based protection coordination scheme for distribution system with distributed generation, Int. J. Electr. Power Energy Syst. 43 (1) (2012) 868– 879.
[16]Lin Ye, M. Majoros, T. Coombs, A.M. Campbell, System studies of the superconducting fault current limiter in electrical distribution grid, IEEE Trans. Appl. Supercond. 17 (2) (2007) 2339–2342.
[17]Go¨khan Cakal, Fatma Gu¨l Bagriyanik, Mustafa Bagriyanik, The effect of fault current limiters on distribution systems with wind turbine generators, Int. J. Renew. Energy Res. 3 (1) (2013). [18]S. Shahriari, A. Yazdian, M. Haghifam, Fault current limiter allocation and sizing in distribution system in presence of distributed generation, IEEE Power Energy Soc. Gen. Meet. (2009) 1–6.
[19]H.H. Zeineldin, W. Xiao, Optimal fault current limiter sizing for distribution systems with DG, IEEE Power Energy Soc. Gen. Meet. (2011) 1–5.
[20]Walid El-Khattam, Tarlochan S. Sidhu, Restoration of directional overcurrent relay coordination in distributed generation systems utilizing fault current limiter, IEEE Trans. Power Delivery 23 (2) (2008).
[21]M. Reyes-sierra, C. Coello, Multi-objective particle swarm optimizers: a survey of the state-of-the-art, Int. J. Comput. Intel. Res. 2 (3) (2006) 287–308.
[22] G. Tang. M.R. Iravani, Application of a fault current limiter to minimize distributed generation impact on coordinated relay protection, in: Presented at the International Conference on Power Systems Transients IPST’05, Montreal, Canada, 2005, pp. 19–23.
[23]Mohammad Sadegh Payam, Ehsan Bijami, Mostafa Abdollahi, Asadollah Salami Dehkordi, Optimal coordination of directional overcurrent relay for power delivery system with a hybrid shuffled frog leaping algorithm, Aust. J. Basic Appl. Sci. 5 (12) (2011) 1949–1957.
[24]M.H. Aslinezhad, S.M. Sadeghzadeh, J. Olamaei, Overcurrent relays coordination in distribution systems in presence of distributed generation, Int. J. Tech. Phys. Probl. Eng. (IJTPE) 3 (2) (2011) 40–46.
[25]Dharmendra Kumar Singh, S. Gupta, Protection of power system by optimal co-ordination of directional overcurrent relays using genetic algorithm, Int. J. Modern Eng. Res. (IJMER) 2 (1) (2012) 326–331.
[26]Jong-Bae Park, Ki-Song Lee, Joong-Rin Shin, Kwang Lee, A particle swarm optimization for economic dispatch with nonsmooth cost functions, IEEE Trans. Power Syst. 20 (1) (2005).
[27] M. Abido, Two-Level of Nondominated Solutions Approach to Multiobjective Particle Swarm Optimization. GECCO’07, London, England, 2007, pp. 1–8.
[28]M. Janga Reddy, D. Nagesh Kumar, Multi-objective particle swarm optimization for generating optimal trade-offs in reservoir operation, Hydrol. Process. 21 (21) (2007) 2897–2909. [29]Margarita Reyes-Sierra, Carlos Coello, Multi-objective particle swarm optimizers: a survey of the state-of-the-art, Int. J. Comput. Intel. Res. 2 (3) (2006) 287–308.
[30] Univ. Washington. Seattle, March 2006. <http://www.ee. washington.edu/research/pstca/>.
[31] IEEE Standard. Inverse-Time Characteristic Equations for Overcurrent Relays. IEEE Std. C37.112-1996.
[32]B. Venkatesh, Rakesh Ranjan, H.B. Gooi, Optimal reconfiguration of radial distribution systems to maximize loadability, IEEE Trans. Power Syst. 19 (1) (2004).
[33]A. Brooke, D. Kendrick, A. Meeraus, GAMS – A User’s Guide, Scientific, San Francisco, CA, 1988.