A deep learning-based RULA method for working posture
assessment
Li Li1, Xu Xu1,*
Edward P. Fitts Department of Industrial & Systems Engineering North Carolina State University, Raleigh, NC 27695, USA
Abstract: Musculoskeletal disorders (MSDs) represent one of the leading cause of injuries from modern industries. Previous research has identified a causal relation between MSDs and awkward working postures. Therefore, a robust tool for estimating and monitoring workers’ working posture is crucial to MSDs prevention. The Rapid Upper Limb Assessment (RULA) is one of the most adopted observational methods for assessing working posture and the associated MSDs risks in industrial practice. The manual application of RULA, however, can be time consuming. This research proposed a deep learning-based method for real-time estimating RULA from 2-D articulated pose using deep neural network. The method was trained and evaluated by 3-D pose data from Human 3.6, an open 3-D pose dataset, and achieved overall Marginal Average Error (MAE) of 0.15 in terms of RULA grand score (or 3.33% in terms of percentage error). All the data and code can be found at the first author’s GitHub (https://github.com/LLDavid/RULA_machine).
INTRODUCTION
Musculoskeletal disorders (MSDs) are inflammatory and degenerative conditions that affect the muscles, tendons, ligaments, and peripheral nerves (Mark Middlesworth, 2014). Previous research has shown that work-related MSD represents one of the leading cause of injuries from modern industries (Ng, Hayes, & Polster, 2016), and accounts for almost 400,000 injuries per year, causing a direct cost of $20 billion (Matt Middlesworth, 2015). Previous studies have identified a relationship between MSDs and musculoskeletal biomechanical load, which can be estimated through time series of working postures and force exerted on the body (Roman-Liu, 2014). The biomechanical load varies upon different working postures. Therefore, a robust tool for estimating and monitoring workers’ posture is crucial to the prevention of MSDs.
Workers’ posture can be roughly estimated through observational methods. Among these observational method, the Rapid Upper Limb Assessment (RULA) is one of the most popular one in industrial practice due to its simplicity and effectiveness (Roman-Liu, 2014). These methods basically exploit the joints angle of the worker through observing the worker’s posture. A final score is then calculated through given formulas, which will be used for evaluating the potential risks of a task.
However, RULA, as well as other observational methods, suffers from two major weaknesses. First, experienced raters are needed for the evaluation, which can be less cost-effective. Second, the final score is subject to inconsistency brought by the subjectivity of the raters. To tackle these limitations, some studies adopted wearable sensors, such as inertial measurement unit (IMU) and electromyography (EMG) sensors (Yan, Li, Li, & Zhang, 2017), to facilitate real-time data collection. However, sensors are intrusive to natural body motion, and is not feasible for large-scale monitoring purpose (Manghisi et al., 2017).
The recent advancement in computer vision provides a great opportunity to address these weaknesses. For example, a single RGB-D camera (e.g. Microsoft Kinect) can be used to
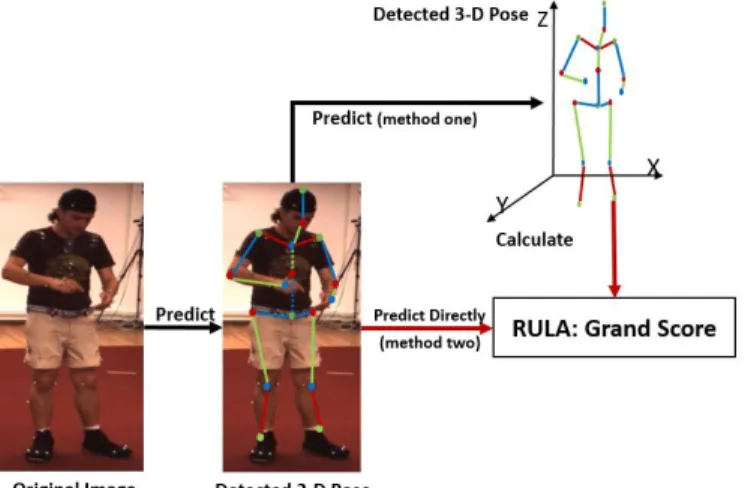
estimate human 3-D pose. (Adams et al., 2015; Diego-Mas & Alcaide-Marzal, 2014; Manghisi et al., 2017; Plantard, Shum, Le Pierres, & Multon, 2017). The 3-D pose estimated from the depth and color map has good accuracy and can be used to calculate RULA. The depth range of the RGB-D camera, however, is typically limited. Therefore, an approach that is only based on color image would be preferred. To estimate human pose in 3-D from color image, most of methods adopted a two-step predicting paradigm (Martinez, Hossain, Romero, & Little, 2017; Pavlakos, Zhou, Derpanis, & Daniilidis, 2017; Tome, Russell, & Agapito, 2017). First, a deep neural network was designed and trained to estimate the 2-D pose. Second, using a regression network to estimate 3-D pose from the detected 2-D pose (black arrows in figure 1). While this type of pipeline achieved good accuracy in predicting 3-D pose, a very intuitive question would be: Can RULA score be estimated directly from 2-D poses if the 3-D pose information is encoded in the 2-D pose? Our work in this paper will be the first to answer this question.
Figure 1. Two methods for estimating RULA from 2-D pose. Our work covers the red arrows. (Subjects photos are extracted from Human 3.6).
The contribution of this paper can be summarized as two aspects (red arrows in figure 1). First, to eliminate the inconsistency and subjectivity brought by human raters, a new procedure was defined for calculating RULA from 3-D pose which contains 17 joints. Second, a new neural network was proposed that can successfully estimate RULA from 2-D annotated poses in real-time. Human 3.6 (Ionescu, Li, & Sminchisescu, 2011; Ionescu, Papava, Olaru, & Sminchisescu, 2014), one of the largest public human 3-D pose dataset, was used for the training and testing, which contains 527,599 poses in total. The RULA scores calculated from the 3-D poses measured by a synchronized motion tracking system were used as the ground truth for both the training and testing step.
METHOD
The pipeline of estimating RULA from monocular image is summarized in figure 1. Our work is represented by the two red arrows in figure 1. In this section, the procedure of calculating RULA from 17 joints, and the structure of the neural network are introduced in details.
Calculate RULA from 3-D pose
The articulated pose is the most widely-adopted representation of human postures. This is because the degree of freedom (DoF) of human body are mainly brought by joints. The articulated pose captures the spatial locations of the joints, and it does not contain redundant texture and background information. In this study, seventeen joints locations are used for the representation, including head, nose, thorax, right/left (L/R) shoulder, (L/R) elbow, (L/R) wrist, spine, hip, (L/R) hip, (L/R) knee, and (L/R) ankle. In the raw data from human 3.6, thirty-two joints are included, and fifteen of them are placed as actuators (with zero DoF), so only the rest seventeen joints data was used in this study. The naming for different joints are according to its actual position.
Note that the term ‘joint’ do not precisely refers to the actual anatomical joints, but the region on human body where
the markers of motion tracking system are typically attached (Figure 2).
To calculate RULA from the 3-D pose, two important planes need to be defined first, i.e. the coronal plane and the sagittal plane of body, denoted by their surface normal, 𝑷𝟏 and
𝑷𝟐(bold letters represent vectors), respectively(see figure 2).
The limb vectors will be represented by the difference of vectors of the joints:
𝒗𝐦−𝐧= 𝒋𝐧− 𝒋𝐦 (1)
Where 𝒗𝐦−𝐧represents the vector pointing from joint m to
joint n; 𝒋𝐧 is given by the 3-D coordinate of the joint.
The projected vector is calculated as: 𝒗𝐦−𝐧 𝑷𝒊 = 𝒗 𝐦−𝐧− 𝒗𝐦−𝐧⋅ 𝑷𝒊 ||𝑷𝒊||𝟐𝑷𝒊 (2) Where 𝒗𝐦−𝐧 𝑷𝒊
is the projection of 𝒗𝐦−𝐧 on plane 𝑷𝒊
(illustrated in figure 3).
In the following context, details will be given regarding how joints angle are calculated from the pose. Note that for asymmetrical lifting, two RULA score may be calculated. Here we take the right-side body as example, and the left-side can be calculated in a mirrored way.
Upper Arm flexion/extension. Upper arm and the reference vector are projected onto 𝑷𝟐, and the angle θ1 is given by the
angle of the projected vectors: 𝜃1= 𝑎𝑐𝑜𝑠(
𝒗𝟏𝟐−𝟎𝟗𝑷𝟐 ⋅𝒗𝟏𝟐−𝟏𝟑𝑷𝟐
|𝒗𝟏𝟐−𝟎𝟗𝑷𝟐 ||𝒗𝟏𝟐−𝟏𝟑𝑷𝟐 |) (3)
Note that the projected vectors do not consider the direction of the original vectors, so the anterior normal vector of the coronal plane, 𝒍𝒂is used to identify the direction.
Upper Arm adduction/abduction. The adduction and abduction angle θ2 is calculated on the upper body coronal
plane:
𝜃2= 𝑎𝑐𝑜𝑠(
𝒗𝟏𝟐−𝟎𝟓𝑷𝟏 ⋅𝒗𝟏𝟐−𝟏𝟑𝑷𝟏
|𝒗𝟏𝟐−𝟎𝟓𝑷𝟏 ||𝑣12−13𝑃1 |) (4)
Raised Shoulder. Angle θ3 is calculated through:
𝜃3= 𝑎𝑐𝑜𝑠(
𝒗𝟎𝟗−𝟎𝟏⋅𝒗𝟎𝟗−𝟏𝟐
|𝒗𝟎𝟗−𝟎𝟏||𝒗𝟎𝟗−𝟏𝟐|) (5)
If θ3> 90°, the shoulder is raised.
Leaning. The leaning angle of upper body is represented by θ4:
𝜃4= 𝑎𝑐𝑜𝑠( 𝒗𝟎𝟏−𝟎𝟗⋅𝒏𝒛
|𝒗𝟎𝟏−𝟎𝟗|) (6)
𝒏𝒛= [0, 0, 1]𝑇 (7)
Where 𝒏𝒛is the unit vector along the global z-axis.
Lower Arm flexion/extension. The angle θ5 is calculated
from projected middle line of upper body and the lower arm on 𝑷𝟐:
𝜃5= 𝑎𝑐𝑜𝑠(
𝒗𝟎𝟗−𝟎𝟏𝑷𝟐 ⋅𝒗𝟏𝟑−𝟏𝟒𝑷𝟐
|𝒗𝟎𝟗−𝟎𝟏𝑷𝟐 ||𝒗𝟏𝟑−𝟏𝟒𝑷𝟐 |) (8)
Lower arm across the middle line. θ6 is calculated as:
𝜃6= 𝑎𝑐𝑜𝑠(
𝒗𝟎𝟗−𝟏𝟒𝑷𝟏 ⋅𝒗𝟎𝟗−𝟏𝟐𝑷𝟏
|𝒗𝟎𝟗−𝟏𝟒𝑷𝟏 ||𝒗𝟎𝟗−𝟏𝟐𝑷𝟏 |) (9)
If θ3> 90°, the lower arm crosses the midline.
Neck extension/flexion. The angle θ7 is calculated by two
projected vectors on 𝑷𝟐:
𝜃7= 𝑎𝑐𝑜𝑠(
𝒗𝟎𝟗−𝟎𝟏𝑷𝟐 ⋅𝒗𝟎𝟗−𝟏𝟏𝑷𝟐
|𝒗𝟎𝟗−𝟎𝟏𝑷𝟐 ||𝒗𝟎𝟗−𝟏𝟏𝑷𝟐 |) (10)
Figure 2. Joints Indexing. 0l-hip, 02/05-right/left hip, 04/07-right/left ankle, 03/06-right/left knee, 08-spine, 09-thorax, 10-nose, 11-head, 12/15-left/right shoulder, 13/16-right/left elbow, 14/17-left/right wrist
Neck side-bending. θ8 will be represented by the
angle between midline of upper body and midline of the head:
𝜃8= 𝑎𝑐𝑜𝑠(
𝒗𝟎𝟗−𝟎𝟏𝑷𝟏 ⋅𝒗𝟎𝟗−𝟏𝟏𝑷𝟏
|𝒗𝟎𝟗−𝟎𝟏𝑷𝟏 ||𝒗𝟎𝟗−𝟏𝟏𝑷𝟏 |) (11)
Upper body flexion/extension (trunk posture). The flexion or extension angle θ9 is calculated by midline of upper body
and 𝑛𝑧, which equals to θ4.
Trunk twisted. The normal vector of 𝑷𝟏, pointing to the
anterior direction is used as reference, so the twisting angle θ10
is calculated as:
𝜃10= 𝑎𝑐𝑜𝑠( 𝒗𝟎𝟏−𝟎𝟓⋅𝒍𝒂
|𝒗𝟎𝟏−𝟎𝟓|) (12)
Trunk side bending. The bending angle θ11 is calculated
as:
𝜃11= 𝑎𝑐𝑜𝑠(
𝒗𝟎𝟏−𝟎𝟗𝑷𝟏 ⋅𝒗𝟎𝟏−𝟎𝟓𝑷𝟏
|𝒗𝟎𝟏−𝟎𝟗𝑷𝟏 ||𝒗𝟎𝟏−𝟎𝟓𝑷𝟏 |) (13)
If θ11 < 90°, the trunk is side-bended.
Trunk side bending. The difference of the distance of two ankle joints’ positions along global z-axis, dz, is used to
identify whether one foot is off the ground. If dz< 5𝑐𝑚, it is
assumed two legs are well supported.
External load/force. It is assumed that external load is at the lowest level (< 4.4 lbs, intermittent), denoted by elf, because
according the experimental protocol, the subjects in Human 3.6 were carrying nothing.
Wrist bending. The pose does not contain data of the distal end of the hand, so the wrist parameter is assumed to be wb,
corresponding to the third column in Table A from the RULA sheet.
The final left/right-side RULA grand score can be estimated from all the variables/parameters mentioned above and the RULA sheet. If regarded as a function, it can be written as:
𝑔𝑠𝑐𝑜𝑟𝑒𝐿= 𝑓(𝜃1∼11𝐿 , 𝑑𝑧, 𝑒𝑙𝑓, 𝑤𝑏) (14)
𝑔𝑠𝑐𝑜𝑟𝑒𝑅= 𝑓(𝜃1∼11𝑅 , 𝑑𝑧, 𝑒𝑙𝑓, 𝑤𝑏) (15)
Where 𝜃1∼11𝐿 and 𝜃1∼11𝑅 represent angles calculated from
left and right side of body respectively.
In practice, we are more concerned with the worst case between the left and right side. Thus, the larger grand score will be chosen as the final estimation for the whole body:
𝑔𝑠𝑐𝑜𝑟𝑒 = 𝑚𝑎𝑥 (𝑔𝑠𝑐𝑜𝑟𝑒𝐿, 𝑔𝑠𝑐𝑜𝑟𝑒𝑅) (16)
Where 𝑔𝑠𝑐𝑜𝑟𝑒 is the final grand score for the whole body.
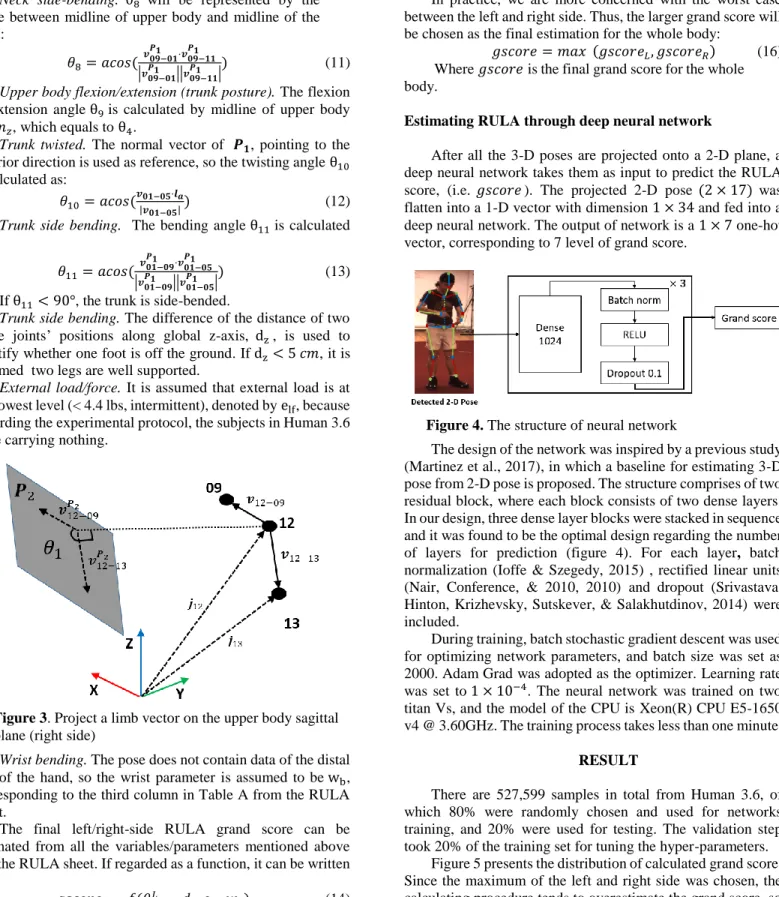
Estimating RULA through deep neural network
After all the 3-D poses are projected onto a 2-D plane, a deep neural network takes them as input to predict the RULA score, (i.e. 𝑔𝑠𝑐𝑜𝑟𝑒). The projected 2-D pose (2 × 17) was flatten into a 1-D vector with dimension 1 × 34 and fed into a deep neural network. The output of network is a 1 × 7 one-hot vector, corresponding to 7 level of grand score.
The design of the network was inspired by a previous study (Martinez et al., 2017), in which a baseline for estimating 3-D pose from 2-D pose is proposed. The structure comprises of two residual block, where each block consists of two dense layers. In our design, three dense layer blocks were stacked in sequence and it was found to be the optimal design regarding the number of layers for prediction (figure 4). For each layer, batch normalization (Ioffe & Szegedy, 2015) , rectified linear units (Nair, Conference, & 2010, 2010) and dropout (Srivastava, Hinton, Krizhevsky, Sutskever, & Salakhutdinov, 2014) were included.
During training, batch stochastic gradient descent was used for optimizing network parameters, and batch size was set as 2000. Adam Grad was adopted as the optimizer. Learning rate was set to 1 × 10⁻⁴. The neural network was trained on two
titan Vs, and the model of the CPU is Xeon(R) CPU E5-1650 v4 @ 3.60GHz. The training process takes less than one minute.
RESULT
There are 527,599 samples in total from Human 3.6, of which 80% were randomly chosen and used for networks training, and 20% were used for testing. The validation step took 20% of the training set for tuning the hyper-parameters.
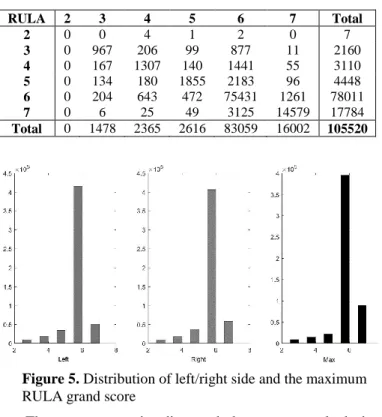
Figure 5 presents the distribution of calculated grand score. Since the maximum of the left and right side was chosen, the calculating procedure tends to overestimate the grand score, so more samples are seen between level 5-7, while no sample is in level 1. Therefore, we excluded level 1 from the prediction. Figure 3. Project a limb vector on the upper body sagittal
plane (right side)
RULA 2 3 4 5 6 7 Total 2 0 0 4 1 2 0 7 3 0 967 206 99 877 11 2160 4 0 167 1307 140 1441 55 3110 5 0 134 180 1855 2183 96 4448 6 0 204 643 472 75431 1261 78011 7 0 6 25 49 3125 14579 17784 Total 0 1478 2365 2616 83059 16002 105520
The common metrics discussed above may overlook the absolute prediction bias, because the RULA score is ordered. Figure 4 plots the Marginal Absolute Error (MAE) for each score. It shows that the algorithm demonstrates almost zero MAE for high-risk postures (6-7), and low MAE for moderate-risk postures (3-5). Additionally, the algorithm tends to overestimate the risk level (average bias greater than zero). The MAE for all the predictions is 0.15, with 0.12 standard deviation, and the mean error rate is 3.33%. During testing, the whole framework can run at 53 frames per second (fps).
RULA Precision Recall F1 score
2 0 0 0 3 0.6543 0.4477 0.5316 4 0.5526 0.4203 0.4774 5 0.7091 0.4170 0.5252 6 0.9082 0.9669 0.9366 7 0.9111 0.819 0.8630 Inter-class average 0.6225 0.5119 0.5556 Weighted average 0.8845 0.8921 0.8850 DISCUSSION
The proposed method demonstrates satisfying sensitivity in detecting potentially risky postures, and it can be further extended to other observational methods, such as Rapid Entire Body Assessment (REBA). More generally speaking, any application that takes the monocular images or 2-D poses as
input and predicts discrete output can be formulated into a similar form and use the framework illustrated in Figure 1. However, a few limitations need to be addressed. First, the method shows less robustness for postures with lower RULA score. This is because unbalanced dataset was used for training. The number of samples for different class falls into three order of magnitude, and the predicting performance drops significantly with the decreased number of samples. Another reason is due to the overestimation during calculation of RULA score from 3-D pose. The 3-D pose does not consider the volume of limbs. Because the markers are attached to the lateral side of the limbs for visibility, calculated joints angle will be overestimated.
Second, there remains the lack of training data in the context of occupational tasks. The adopted dataset, Human 3.6, contains a large amount of 3-D poses, but only covers activities during daily life. The scenarios where RULA is adopted are mainly from industries, so that more working postures are needed. Additionally, the deep neural network is data-driven, which means its performance highly depends on the generalization of the training dataset. Poses collected in the field would substantially contribute to network training. In addition, an evaluation against working postures collected in the field could provide a full picture of the validity of the proposed automated RULA method.
To tackle these limitations, future studies should focus on the following three aspects. First, more working postures need to be collected. Common working postures, including lifting/putting down boxes, walking while carrying objects, bending, and reaching for objects in sitting/standing posture, should be included in the training set. Second, data augmentation can be adopted to balance the training set and improve overall predicting capability. To do so, one can use Generative Adversarial Network (GAN) (Goodfellow, Pouget-abadie, Mirza, Xu, & Warde-farley, 2014). When the collected data is not enough, GAN can generate artificial 2-D pose and 3-D pose according to a specific style using style transfer (Gatys, Ecker, & Bethge, 2016), so that more samples can be generated from a smaller amount of data, and the number of each class can be controlled. Third, more advanced structure could be further explored. In this study a three-layer vanilla deep neural network was used. If the networks go deeper, vanishing gradients might occur during back-propagation, and a residual block may need to be added (He, Zhang, Shaoqing, & Sun, 2016).
Table 2. Precision, recall and F1-score of the algorithm Table 1. Confusion Matrix. Rows represent the actual class and columns represent the predicted class. The diagonal entries show the number of samples correctly classified.
Figure 5. Distribution of left/right side and the maximum RULA grand score
Conclusion
This study proposed a new procedure for calculating RULA from 3-D pose and a novel framework for estimating RULA from 2-D articulated pose. The proposed neural network demonstrates satisfying accuracy in estimating RULA score, and efficiency for real-time use. Future work will focus on collecting more work-related postures, and exploit more advanced deep neural network to further enhance the robustness of the framework.
Acknowledgement
This manuscript is based upon work supported by the National Science Foundation under Grant No 1822477.
Reference
Adams, R. J., Lichter, M. D., Krepkovich, E. T., Ellington, A., White, M., & Diamond, P. T. (2015). Assessing Upper Extremity Motor Function in Practice of Virtual Activities of Daily Living. IEEE Transactions on Neural Systems and Rehabilitation Engineering, 23(2), 287–296. https://doi.org/10.1109/TNSRE.2014.2360149
Diego-Mas, J. A., & Alcaide-Marzal, J. (2014). Using KinectTM sensor in observational methods for assessing postures at work. Applied Ergonomics, 45(4), 976–985. https://doi.org/10.1016/j.apergo.2013.12.001
Gatys, L. A., Ecker, A. S., & Bethge, M. (2016). Image Style Transfer Using Convolutional Neural Networks Leon. CVPR, 2414–2423. https://doi.org/10.1007/s12517-018-4039-8
Goodfellow, I. J., Pouget-abadie, J., Mirza, M., Xu, B., & Warde-farley, D. (2014). Generative-Adversarial-Nets. Nips, 1–9. https://doi.org/10.1017/CBO9781139058452 He, K., Zhang, X., Shaoqing, & Sun, J. (2016). Deep Residual
Learning for Image Recognition. CVPR, 770–778. Ioffe, S., & Szegedy, C. (2015). Batch Normalization:
Accelerating Deep Network Training by Reducing Internal Covariate Shift. https://doi.org/10.1007/s13398-014-0173-7.2
Ionescu, C., Li, F., & Sminchisescu, C. (2011). Latent structured models for human pose estimation. Proceedings of the IEEE International Conference on Computer Vision, (November), 2220–2227. https://doi.org/10.1109/ICCV.2011.6126500
Ionescu, C., Papava, D., Olaru, V., & Sminchisescu, C. (2014). Human3.6M: Large scale datasets and predictive methods for 3D human sensing in natural environments. IEEE Transactions on Pattern Analysis and Machine Intelligence, 36(7), 1325–1339. https://doi.org/10.1109/TPAMI.2013.248
Manghisi, V. M., Uva, A. E., Fiorentino, M., Bevilacqua, V., Trotta, G. F., & Monno, G. (2017). Real time RULA assessment using Kinect v2 sensor. Applied Ergonomics,
65, 481–491.
https://doi.org/10.1016/j.apergo.2017.02.015
Mark Middlesworth. (2014). Definition of Musculoskeletal Disorder (MSD) | ErgoPlus. Retrieved January 29, 2019,
from https://www.ergo-plus.com/definition-of-musculoskeletal-disorder-msd/
Martinez, J., Hossain, R., Romero, J., & Little, J. J. (2017). A simple yet effective baseline for 3d human pose estimation. https://doi.org/10.1109/ICCV.2017.288 Matt Middlesworth. (2015). The Cost of Musculoskeletal
Disorders (MSDs) [Infographic]. Retrieved January 29, 2019, from https://ergo-plus.com/cost-of-musculoskeletal-disorders-infographic/
Nair, V., Conference, G. H.-P. of the 27th international, & 2010, U. (2010). Rectified Linear Units Improve Restricted Boltzmann Machines. Cs.Toronto.Edu, (3), 6421113. https://doi.org/10.1.1.165.6419
Ng, A., Hayes, M., & Polster, A. (2016). Musculoskeletal Disorders and Working Posture among Dental and Oral Health Students. Healthcare, 4(1), 13. https://doi.org/10.3390/healthcare4010013
Pavlakos, G., Zhou, X., Derpanis, K. G., & Daniilidis, K. (2017). Coarse-to-fine volumetric prediction for single-image 3D human pose. Proceedings - 30th IEEE Conference on Computer Vision and Pattern Recognition, CVPR 2017, 2017–Janua, 1263–1272. https://doi.org/10.1109/CVPR.2017.139
Plantard, P., Shum, H. P. H., Le Pierres, A. S., & Multon, F. (2017). Validation of an ergonomic assessment method using Kinect data in real workplace conditions. Applied
Ergonomics, 65, 562–569.
https://doi.org/10.1016/j.apergo.2016.10.015
Roman-Liu, D. (2014). Comparison of concepts in easy-to-use methods for MSD risk assessment. Applied Ergonomics,
45(3), 420–427.
https://doi.org/10.1016/j.apergo.2013.05.010
Srivastava, N., Hinton, G., Krizhevsky, A., Sutskever, I., & Salakhutdinov, R. (2014). Dropout: A Simple Way to Prevent Neural Networks from Overfittin. Journal of Machine Learning Research, 15. https://doi.org/10.1016/0370-2693(93)90272-J
Tome, D., Russell, C., & Agapito, L. (2017). Lifting from the Deep: Convolutional 3D Pose Estimation from a Single Image. https://doi.org/10.1109/CVPR.2017.603
Yan, X., Li, H., Li, A. R., & Zhang, H. (2017). Wearable IMU-based real-time motion warning system for construction workers’ musculoskeletal disorders prevention. Journal of Research in Medical Sciences, 74(2), 2–11. https://doi.org/10.1016/j.autcon.2016.11.007