A Low-cost Real-time Tracking Infrastructure
for Ground-based Robot Swarms
Alan G. Millard1, James A. Hilder1,2, Jon Timmis2, and Alan F. T. Winfield3 1
Department of Computer Science, York Robotics Laboratory, University of York, UK
2 Department of Electronics, York Robotics Laboratory, University of York, UK {james.hilder, jon.timmis}@york.ac.uk
3 Bristol Robotics Laboratory, University of the West of England, Bristol, UK [email protected]
Abstract. A tracking infrastructure is a useful tool for swarm robotics research, and has many potential applications. Unfortunately, for many research laboratories, constructing one may be prohibitively expensive. In this paper we present a low-cost tracking infrastructure that was built at the York Robotics Laboratory for tracking ground-based robot swarms in real-time. We highlight the considerations that were taken when build-ing and configurbuild-ing the system, usbuild-ing a swarm of e-puck robots as a case study. Potential applications of the system are discussed, the cost of the equipment is documented, and its known limitations are addressed. This paper aims to serve as a resource for other swarm robotics researchers interested in implementing a similar low-cost tracking solution.
1
Introduction
Optical tracking systems are used in many research laboratories for monitoring and recording the movements of mobile robots. The data gathered by such sys-tems is invaluable for offline post-experiment analysis, for example, measuring the area coverage of a robot swarm. These systems can also be used to provide robots with online feedback about their current position and orientation, for the purposes of indoor localisation. Unfortunately, obtaining precise and reliable tracking data often comes at the cost of expensive equipment.
Commercial motion capture systems typically work by attaching retrore-flective markers to the robots, and using special cameras that illuminate the scene with infrared (IR) light. These cameras observe the light reflected from the markers through an IR filter, allowing them to efficiently locate the markers in the scene using simple image processing algorithms. A pattern of markers is recognised by the tracking system, allowing the position and orientation (or
pose) of a robot to be detected. Vicon [1] motion capture systems take such an approach, and are able to track robots precisely and reliably. The Vicon-based experimental infrastructure built at the Bristol Robotics Laboratory (BRL) [2] is of particular relevance, as it has been used successfully in a number of swarm
robotics studies [3][4][5]. Sadly, for many research laboratories, Vicon systems comprising even a small number of cameras are prohibitively expensive.
In contrast, IRIDIA’s Arena Tracking System [6] does not use retroreflective markers to detect robots. Instead, an overhead array of 16 visible-light cameras is used to decode printed markers placed on top of each robot, in order to determine their pose. Although this system is cheaper to build than a Vicon system, the high-resolution cameras used are still quite expensive, and it is unlikely that many laboratories could afford to devote the man-hours required to develop the custom sofware to drive the system. One option would be to use an open-source vision-based tracking software solution such as SwisTrack [7] or AprilTag [8], which were developed as cost-effective alternatives to expensive motion capture systems like Vicon. However, the precision of the tracking data obtained using visible-light cameras is often inferior to that aquired from commercial motion capture systems that use retroreflective markers.
OptiTrack [9] is a recent competitor in the motion capture market, and offers a cost-effective alternative to Vicon systems, whilst still delivering precise and reliable tracking data. This potentially provides an affordable solution for many research laboratories. We have recently built an OptiTrack system for real-time tracking of ground-based robot swarms at the York Robotics Laboratory (YRL). In this paper we detail our experiences in constructing this system, in the hope that it will provide a useful resource for other swarm robotics researchers.
2
System Overview
Figure 1 shows the tracking infrastructure built at YRL. This is similar to the Vicon-based experimental infrastructure constructed at BRL [2]. The OptiTrack motion capture system provides high precision tracking of the robots. This con-sists of three cameras that are mounted on a 3.5m x 3.5m x 2.5m truss rig, and are angled down to face the arena below. A swarm of robots can be tracked any-where within the boundaries of the 2.5m square arena. OptiTrack offer a wide range of different cameras, of varying levels of performance. We chose to use Flex 13 cameras, which are designed to provide medium volume motion capture at a reasonable cost. These cameras have a resolution of 1.3 megapixels, a maximum frame rate of 120 frames per second, and a horizontal field of view of 56◦. In order to track the robots, the cameras have a ring of 28 IR LEDs that emit light with a wavelength of 850nm. This light bounces off retroreflective mark-ers mounted on the robots, and returns to the cameras. IR filtmark-ers and image processing algorithms on-board the cameras are used to detect these markers.
At least two cameras are required for the tracking software to triangulate marker coordinates, but a greater number of cameras is typically used to improve coverage. This is especially important if a swarm needs to be tracked over a large area. Using more cameras also allows robots to be tracked reliably even in the presence of marker occlusion — where line of sight between a camera and a marker is obstructed. However, when tracking ground-based robots on a 2D plane, the likelihood of marker occlusion is relatively low. We have found
Fig. 1. Tracking infrastructure monitoring a swarm of six e-puck robots. The three OptiTrack cameras are circled. The arrows indicate the angle of each camera.
that three cameras arranged in a triangular layout provides good coverage at a low cost. The positioning of the cameras is important — they are set up such that their fields of view overlap with each other, and are placed overhead to reduce the chance of marker occlusion. We have chosen to mount the cameras on a permanent truss rig, so that the cameras do not get moved, removing the need for repeated recalibration of the system. However, the cameras could be equivalently mounted on free-standing camera stands.
We use a swarm of open-hardware e-puck robots [10], each augmented with a Linux Extension Board (LEB) [2], which improves its processing and mem-ory resources, and enables Wi-Fi communication. The e-puck robot platform is often used for swarm robotics research, and its size is representative of similar platforms that one may wish to track. The e-puck robots move at a relatively low maximum speed of 13cm/s, which is easy for the tracking system to handle. Figure 2 provides an overview of the experimental infrastructure, and illustrates data flow between system components. The three Flex 13 cameras are connected via USB to an OptiHub 2 — a custom USB hub that allows up to six cameras to synchronise with each other. This, in turn, connects via USB to the OptiTrack server (a Windows machine with tracking software installed), allowing tracking data to be obtained from the cameras. The server processes the tracking data, logs it for post-experiment analysis, and makes it available to e-pucks and users in real-time via the wireless LAN. Each robot is assigned a static IP address, and connects to the LAN via a wireless router. This allows networked computers to connect to any robot using the SSH protocol.
Flex 13 camera OptiHub 2 OptiTrack server Wireless router Flex 13 camera Flex 13 camera e-puck robots User
Fig. 2. Overview of the tracking infrastructure, showing data flow between system components.
3
Tracking Hats
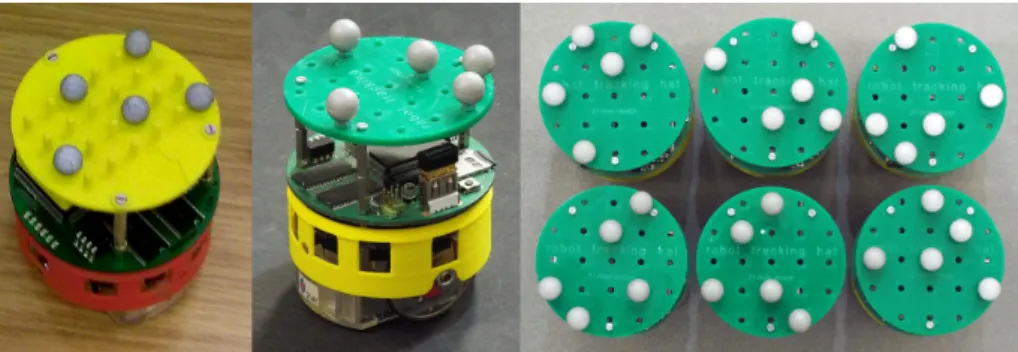
Retroreflective markers must be attached to the robots so that they can be tracked by the OptiTrack cameras. Liu and Winfield [2] solved this problem for the Vicon system installed at BRL by fitting e-pucks with 3D-printed hats (shown in Figure 3), upon which the markers were mounted. The markers have a hole in their underside, allowing them to be placed on pins protruding from the top of the hat. The 3D-printed hats have a 4x6 matrix of pins, providing 24 possible marker positions. This allows each e-puck to be assigned a unique pattern of markers, so that it can be identified by the tracking system.
Initially, we attempted to use the same hat design with the OptiTrack system at YRL. Unfortunately, this was unsuccessful for a number of reasons. Firstly, OptiTrack markers are slightly larger than Vicon markers. Secondly, the Opti-Track cameras are lower resolution than the Vicon MX40 cameras used at BRL (1.3 megapixels vs 4 megapixels). The result is that the 3D-printed hats place the markers too closely together for the OptiTrack cameras to distinguish be-tween them. It was therefore necessary to design a new tracking hat that would allow the markers to be spaced farther apart.
3.1 Laser-cut Hat Design
The new tracking hat design is shown in Figure 3. It is made from a single laser-cut piece of plastic 74mm in diameter, to match the size of the e-puck so that it does not affect the robot’s behaviour. The hat has 21 holes in it, hor-izontally/vertically separated by 14mm. The number of holes was chosen as a
Fig. 3.Left: 3D-printed hat design with Vicon markers.Centre: Laser-cut hat design with OptiTrack markers.Right: Six example marker patterns.
compromise between maximising the number of marker positions, and maximis-ing the separation between markers. The spacmaximis-ing is sufficient that the trackmaximis-ing system is able to distinguish between diagonally adjacent markers when the cameras are mounted 2.5m from the ground as shown in Figure 1.
The original 3D-printed design is quite fragile, and the marker mounting pins are prone to snapping off. The new design overcomes this by instead using bolts pushed upwards through the holes and secured with nuts. The OptiTrack mark-ers are 7/16” (11.11mm) in diameter, and have a hole in their undmark-erside, so they rest on the bolts. This method of mounting markers is a little less convenient, as the bolts must be repositioned when a new pattern is chosen. However, once a set of patterns have been decided upon, it is unlikely that they will need to be changed. This method also has the advantage that the patterns are retained if the markers fall off the hat (a common problem when picking up the robots).
In contrast to the original 3D-printed design, the holes are not laid out in a rectangular grid constrained by the diameter of the hat. Instead they are positioned such that they maximise the available space on the hat. Another difference is that the 3D-printed hat has a slot on the underside for mounting a USB Wi-Fi adapter attached to the Linux extension board. This slot is not required in our laser-cut design, as we now use an Edimax EW-7811UN nano USB Wi-Fi adapter that is small enough to fit under the hat. The new laser-cut design is also cheaper, and faster to produce. The hat is attached to the e-puck with 3 pairs of 15mm PCB standoffs. It is important to provide sufficent clearance for the Wi-Fi adapter, but the hat should not be mounted too high, otherwise the e-puck will be top-heavy and rock back and forth as it moves.
3.2 Marker Patterns
The tracking software requires that each marker pattern comprises between 3 and 7 markers. Due to the low resolution of the Flex 13 cameras, we have found that the tracking system is unable to reliably distinguish between 3 or 4 marker patterns at a distance of 2.5m from the ground, as the shapes that the markers
form appear too similar. Instead we use 5-marker patterns, which are more easily differentiated at this distance. Due to constraints on the physical size of the hat, and therefore the distance between marker positions, we must prohibit patterns with horizontally/vertically adjacent markers. Only diagonally adjacent markers can be resolved by the cameras at this distance. Note that this constraint reduces the number of possible unique marker patterns.
Creating marker patterns is non-trivial, as there are certain situations that must be avoided to prevent ambiguity. Initially, consider a single marker pattern in isolation. If it is is rotationally symmetric, then the tracking software will be unable to determine the true orientation of the robot. Similarly, if the pattern looks identical when flipped, the tracking software may become confused and think that the robot is upside down. For example, a 4 marker pattern that forms a square is symmetrical in both the horizontal and vertical axes, and self-similar under every possible rotation, which is very confusing for the tracking software. When we consider a set of marker patterns for tracking a swarm of robots, it is then also necessary to ensure that the patterns appear as distinct as possible, otherwise the robots may be incorrectly identified by the tracking system. We must therefore check whether a marker pattern looks similar to another under any possible transformation.
3.3 Evolving Patterns
It is infeasible to solve this problem by hand, especially for larger swarm sizes. Instead, we use Evolutionary Search to automatically generate sets of marker patterns that are distinct from each other under any transformation. Each in-dividual in the population comprises a set of marker patterns — one for each robot in the swarm. Each pattern is represented as an integer between 1 and 21, corresponding to the position of the marker holes on the hat. The size of the genome is therefore a product of the number of patterns and the number of markers. For example, for 6 patterns each comprising 5 markers, the genome will be of length 30. Individuals are initialised by randomly generating marker posi-tions for each pattern, with the constraint that a candidate marker position is not already in use, and is not horizontally/vertically adjacent to another marker that has already been placed.
The crossover operator only allows whole marker patterns to be exchanged between individuals, to prevent invalid patterns from being created. The muta-tion operator iterates over the set of patterns in an individual, and probabilis-tically decides whether or not to mutate each pattern. If a pattern is chosen for mutation, a single marker within the pattern is selected at random, and a new marker positition is randomly generated whilst ensuring that it conforms to occupancy and adjacency constraints. We use the Multi-Objective Optimisation algorithm NSGA-II to maximise the following objective functions:
Worst case shortest distance: The shortest distance between any pair of markers in a pattern, over all patterns in the individual. Maximising this distance ensures that the markers are spread as far apart as possible, mak-ing it easier for the trackmak-ing system to distmak-inguish between them. We use the worst case (largest) value, so that the fitness of an individual is limited by the pattern with the most tightly packed markers.
Worst case self similarity: Similarity between two marker patterns under a particular transformation is defined as follows: For every marker in pattern A, find the shortest distance to another marker in pattern B. The distance calculated for each marker is then summed. The minimum value of zero is obtained if patterns A and B are identical. The more dissimilar they are, the larger the sum will be. We calculate similarity under all possible translations, rotations, and reflections, and the worst case value is recorded. Again, we maximise the worst case to ensure that the fitness of an individual is limited by the most self similar pattern it contains.
Overall worst case similarity: This objective is calculated in the same way as self similarity, except that we check the similarity of each pattern against every other pattern in the individual, and record the worst case similarity. We want to maximise this value, to ensure that each pattern in an individual is as dissimilar to others as possible.
Figure 3 shows an example set of six marker patterns that were evolved using this approach, and can be reliably differentiated by the tracking system. Due to the problem constraints, and the necessity for patterns to appear distinct from each other under any transformation, only around 10 unique patterns can be evolved. Beyond this number, the evolved patterns begin to look similar, which can result in the tracking system incorrectly identifying robots. This limitation is influenced by the size of the hats, and therefore the separation between markers, as well as the distance, angle, and number of cameras. For a smaller arena, with the cameras closer to the ground, any placement of markers on the hats could be used without enforcing adjacency constraints, which would allow for more unique patterns to be evolved.
Although we focus here on e-puck robots, it is important to note that the tracking system is robot platform agnostic. Any robot can be tracked provided that a pattern of markers can be mounted on it. The only limitation is that there must be sufficient spacing between the markers, so that the tracking system can distinguish between them. In order to track robots smaller than the e-puck, it may be necessary to use smaller markers that OptiTrack offer for tracking facial expressions, either 3mm or 4mm in diameter, and to position the cameras closer to the ground. Similarly, for significantly larger robots, 5/8” or 3/4” diameter markers are available, which can be tracked at a greater distance.
In future, we will design a new tracking hat for the Pi Swarm robot platform developed at YRL, which is based on the Pololu 3pi robot [11]. These robots are 95mm in diameter, allowing for the creation of a tracking hat with a greater number of holes, and therefore greater potential for unique marker patterns. We antipate being able to track swarms up to the maximum of 32 robots.
Fig. 4.Screenshot of the Motive:Tracker software that shows the position and orienta-tion of six rigid bodies (one for each e-puck) being tracked. Each rigid body comprises 5 markers. The pivot point of each rigid body is also displayed.
4
Tracking Software
The tracking software (Motive:Tracker) is capable of tracking objects in six de-grees of freedom. Figure 4 shows a screenshot of the graphical user interface (GUI) when tracking six e-puck robots. The minimum system requirements to run software version 1.5 are a 2.5+ GHz i5 processor and 4 GB of memory [9]. This section provides a brief overview of the workflow when working with the tracking software.
The tracking system must be calibrated before it is first used. This is achieved using an OptiWand and Calibration Square. First, the OptiWand is waved through the entire capture volume while the cameras observe its movement by detecting the three retroreflective markers mounted on it. Once sufficient coverage is achieved, the wanding data is used to automatically calculate the physical position, orientation, and lens characteristics of the cameras. Project-ing the Motive:Tracker GUI onto the wall as shown in Figure 2 makes calibration significantly easier, as the user can easily observe the extent of capture volume coverage during the wanding process. This is more difficult when the GUI is displayed on a monitor, as it is too small to see from a distance.
After the cameras have been calibrated, the Calibration Square is placed on the floor to align the 3D coordinate system with the physical capture volume. The calibration process is then complete, and the calibration tools are removed from the capture volume so that rigid bodies can be defined. Note that if the cameras are moved after calibration, then the system must be recalibrated. This is why we have mounted the cameras on a permanent truss rig. The initial calibration results can be saved and reused for each subsequent capture session. Following calibration, the GUI is used to select markers belonging to a robot in the software and create rigid body from it. This allows the tracking software to calculate the position and orientation of the robot based on the coordinates of individual markers in each frame. Figure 4 shows the rigid bodies corresponding to the marker patterns shown in Figure 3. After creating a rigid body, it is then necessary to adjust the orientation and pivot point of each rigid body to match that of the real robot. The Motive:Tracker GUI can be used to record tracking data for post-experiment analysis, but the true potential of the tracking system is only realised through integration with custom code via the API. The API is written in C++, and provides direct real-time access to rigid body tracking data. However, it is first necessary to perform calibration, create rigid bodies, and adjust any parameters via the GUI, then save the project to a file which can be loaded using the API. The tracking data can then be used in various applications, as detailed in the next section.
5
Applications
The tracking infrastructure has many potential applications in swarm robotics research, a few of which are listed below. Although similar tracking systems have already been used in most of these application areas, the system presented in this paper offers comparable functionality at a lower cost.
Post-experiment analysis: The most obvious application is recording the be-haviour of robot swarm over time. If desired, the robots can additionally transmit data about their current state to the OptiTrack server, which can be aggregated with tracking data. The data can then be used for post-experiment analysis, and to verify the success of an post-experiment using sta-tistical hypothesis testing. For example, Bjerknes and Winfield [5] used the Vicon system at BRL to analyse the fault tolerance of a robot swarm. Validation: Winfield et al. [12] argue that the ability to repeatably test real
robot swarms systems is important if we are to develop dependable swarms. The tracking infrastructure can be used to carry out repeated experiments, by commanding robots to particular starting positions to initialise each test run. This is particularly important for validating swarm algorithms that rely on self-organisation, as they must be analysed over repeated experimental runs, to check that undesirable behaviours do not emerge.
Localisation: The tracking system can be used to provide real-time feedback to the robots about their current position and orientation. This gives the
robots awareness of their location within their environment. The Vicon-based system at the GRASP Laboratory at the University of Pennsylvania has been for localisation with a swarm of 16 quadrotors, to implement centralised formation control [13].
Rapid prototyping: Tracking data can be used to initially provide robots in a swarm with global information, to quickly test concepts. This approach to development could similarly be carried out purely in simulation, but using a tracking infrastructure makes the system more grounded in reality, due to the use of real robot sensors and actuators. The Flying Machine Arena [14] built at ETH Zurich uses Vicon cameras to track quadrocopters, for rapid-prototyping and performance validation and evaluation.
Virtual sensors: The tracking infrastructure can be used to implement virtual sensors for the robots. This is particularly useful if the robot platform used has limited sensing capabilities. For example, an omnidirectional camera could be emulated, allowing a robot to determine the relative position of other robots. This can be limited to local sensing, by calculating the distance between pairs of robots, and transmitting a limited view of the world to each robot in the swarm. The Vicon system at BRL has been used successfully to implement virtual sensors for swarms of e-puck robots, allowing for online evolution of collective behaviours [3][4].
Automated calibration of simulation: Tracking data could also potentially be used for the validaiton and calibration of robot simulators. This would be of great benefit, as the reality gap of existing simulators is often large, and swarm algorithms developed in simulation often do not work without significant modification when deployed on real robots. This is an area we particularly wish to investigate in future work.
6
Cost
Table 1 shows the cost of the OptiTrack hardware and software required to build a tracking infrastructure similar to the one we present in this paper. The only difference is that we have included the cost of 10ft (3m) stands to mount the cameras on, as these are significantly cheaper than a truss rig. There are some overhead costs associated with the calibration tools and the tracking software. The hardware key is required for licensing — the Motive:Tracker software may be installed on multiple machines at no cost, but can only be used when a licensed hardware key is connected via USB. To extend the system after these initial overheads, it would only be at the expense of additional cameras, hubs, and cables. The cost of tracking swarms of larger sizes is dictated only by the cost of extra markers.
7
Limitations
The tracking system presented in this paper has a few limitations that we are aware of. Firstly, the tracking software will only run under the Windows op-erating system, and the API is written in C++. For our purposes this is not
Item Unit Cost Quantity Subtotal
Flex 13, 56◦FOV (5.5mm), FS included $1098 3 $3294
OptiHub 2 $299 1 $299
Hardware Key $99 1 $99
Motive:Tracker Software $999 1 $999
Calibration Square $99 1 $99
OptiWand Kit $249 1 $249
Reflective Markers: 7/16” Hard (pack of 5) $20 10 $200
Camera Stand: 10ft $99 3 $297
SLIK Clamp Head 38mm $69 3 $207
USB Cable High Grade, Down Angle: 5m $10 3 $30 USB Uplink Cable: 16ft A to B $5 1 $5
Total: $5778 Table 1.Cost of OptiTrack hardware and software for a three camera system, with enough markers for tracking 10 robots [9]. All prices quoted are in USD.
a major issue, as we simply transmit the tracking data to Linux systems via network sockets, but it is something worth considering when planning to build an OptiTrack system. Secondly, a maximum of 32 rigid bodies can be defined in Motive:Tracker. Unfortunately, this imposes an upper limit on the size of swarm robotic systems that tracked.
Finally, the IR light from the cameras can interfere with a robot’s IR sensors, potentially resulting in erratic behaviour. This is one major disadvantage that OptiTrack systems have in comparison to Vicon systems, which offer cameras with ‘visible red light’ and ‘near-infrared’ modes of operation that do not cause IR interference. Despite this limitation, we have found that strobing the Flex 13 cameras much lower than their maximum framerate of 120fps greatly alle-viates these issues. The Motive:Tracker software imposes a minimum framerate of 30fps, but the cameras can be strobed at an even lower framerate if desired, by connecting an external signal generator to the OptiHub 2. Another potential solution might be to use the Flex 13 cameras in passive mode, where instead of emitting IR light themselves, they sense light from active IR LED markers mounted on the robots. We have, however, been able to successfully track the behaviour of an e-puck swarm running the swarm taxis algorithm presented in [5], which relies entirely on IR sensing and communication, with minimal IR interference by strobing the cameras at 30fps.
8
Conclusions and Future Work
In this paper we have presented details of the tracking infrastructure built at YRL, and the considerations taken when constructing and configuring the sys-tem. We believe that the information provided here will be of use to the wider swarm robotics research community, and will assist others in developing low-cost solutions for tracking ground-based robot swarms in real-time. Electronic resources for reproducing our system have also been made available online [15].
In future, we will use this tracking infrastructure to implement exogenous fault detection as proposed in [16]. Each robot will initialise an internal simula-tion such that it reproduces the relative poses of the other robots in reality. The simulation can then be run for a short period of time, and the resulting pose of each robot may be compared against the observed state of the robots in reality. A significant discrepancy between the predicted and observed position of a par-ticular robot may indicate that it has developed a fault that can be detected. This fault detection approach has already been shown to work for single-robot systems [17], and will soon be extended for use with robot swarms.
References
1. Vicon. www.vicon.comAccessed: May 2014.
2. Liu, W., Winfield, A.F.T.: Open-hardware e-puck Linux extension board for exper-imental swarm robotics research. Microprocessors and Microsystems35(1) (2011) 60–67
3. O’Dowd, P., Winfield, A.F.T., Studley, M.: The Distributed Co-Evolution of an Embodied Simulator and Controller for Swarm Robot Behaviours. In: Proceedings of the 2011 IEEE/RSJ International Conference on Intelligent Robots and Systems (IROS). (2011) 4995–5000
4. Bredeche, N., Montanier, J.M., Liu, W., Winfield, A.F.T.: Environment-driven Dis-tributed Evolutionary Adaptation in a Population of Autonomous Robotic Agents. Mathematical and Computer Modelling of Dynamical Systems18(1) (2012) 101– 129
5. Bjerknes, J.D., Winfield, A.F.T.: On Fault Tolerance and Scalability of Swarm Robotic Systems. In: Distributed Autonomous Robotic Systems. Volume 83 of Springer Tracts in Advanced Robotics. (2013) 431–444
6. Stranieri, A., Turgut, A.E., Francesca, G., Reina, A., Dorigo, M., Birattari, M.: IRIDIA’s Arena Tracking System. Technical Report TR/IRIDIA/2013-013, Universit´e Libre de Bruxelles (2013)
7. Lochmatter, T., Roduit, P., Cianci, C., Correll, N., Jacot, J., Martinoli, A.: SwisTrack - A Flexible Open Source Tracking Software for Multi-Agent Systems. In: Proceedings of the 2008 IEEE/RSJ International Conference on Intelligent Robots and Systems (IROS). (2008) 4004–4010
8. Olson, E.: AprilTag: A robust and flexible visual fiducial system. In: Robotics and Automation (ICRA), 2011 IEEE International Conference on. (2011) 3400–3407 9. NaturalPoint, Inc.: OptiTrack. www.naturalpoint.com/optitrack
Accessed: May 2014.
10. Mondada, F., Bonani, M., Raemy, X., Pugh, J., Cianci, C., Klaptocz, A., Magnenat, S., Zufferey, J.C., Floreano, D., Martinoli, A.: The e-puck, a Robot Designed for Education in Engineering. In: Proceedings of the 9th Conference on Autonomous Robot Systems and Competitions. (2009) 59–65
11. Pololu: 3pi Robot. www.pololu.com/product/975Accessed: February 2014. 12. Winfield, A.F., Harper, C.J., Nembrini, J.: Towards dependable swarms and a new
discipline of swarm engineering. In: Swarm robotics. Springer (2005) 126–142 13. Kushleyev, A., Mellinger, D., Powers, C., Kumar, V.: Towards A Swarm of Agile
14. Lupashin, S., Hehn, M., Mueller, M.W., Schoellig, A.P., Sherback, M., D’Andrea, R.: A platform for aerial robotics research and demonstration: The Flying Machine Arena. Mechatronics24(1) (2014) 41–54
15. E-Puck Tracking Resources. www.york.ac.uk/robot-lab/epuck-tracking/
Accessed: May 2014.
16. Millard, A.G., Timmis, J., Winfield, A.F.T.: Towards Exogenous Fault Detection in Swarm Robotic Systems. In: Proceedings of the 14th Annual Conference Towards Autonomous Robotic Systems (TAROS). (2013) To appear.
17. Millard, A.G., Timmis, J., Winfield, A.F.T.: Run-time Detection of Faults in Autonomous Mobile Robots Based on the Comparison of Simulated and Real Robot Behaviour. In: Proceedings of the 2014 IEEE/RSJ International Confer-ence on Intelligent Robots and Systems (IROS). (2014) To appear.