3146
GUIDING FEATURE BASED SAR IMAGE ALIGNMENT
USING BAG OF WORDS MODEL
1
B SIRISHA, 2B SANDHYA, 3CHANDRA SEKHAR PAIDIMARRY, 4AS CHANDRASEKHARA SASTRY
1
K L University, Department of Electronics and Communication Engineering, Guntur, A.P, India. 2
Assoc Professor, MVSR Engineering College, Department of Computer Science and Engineering, India 3
Professor, UCE-Osmania University, Department of Electronics & Communication Engineering, India 4
Professor, KL University, Department of Electronics and Communication Engineering, India
E-mail: [email protected], [email protected],
3
[email protected],[email protected]
ABSTRACT
Automatic SAR image alignment or registration is one of the fundamental preprocessing operations in several applications of computer vision, image processing, pattern recognition etc. Advances in feature extraction algorithms have led to the development of efficient alignment algorithms which offer invariance to deformations like scale, rotation, view angle etc. To further improve the performance of standard SAR image alignment, an iterative approach generating multiple synthetic views, known as view synthesis has been employed. State of art detectors like SIFT, SURF, Hessian Affine and MSER when used with view synthesis have been proved to be invariant to a wider range of deformations, however at the cost of additional memory and time to be spent on generation of views and feature extraction across all the views. Hence we studied if the characteristics of source and target SAR images to be aligned can be used to provide some knowledge and guide SAR image alignment approach. This paper focuses on identifying the possibility of aligning two SAR images and also predicts suitable alignment approach by building a predictive data mining model using classification based algorithms. The dataset of 540 Terra SAR X band images is tested and applied on various classification algorithms such as Naive Bayes, SVM, and J48 using attributes computed from Bag of Words model applied on feature detector and descriptor.
Keywords: Image Alignment, Feature Detection, Feature Description, View Synthesis, Bag of Visual Words, SVM
1. INTRODUCTION
SAR image alignment or registration aims to evaluate optimal transformation by establishing correspondence among two or more images [1] [2] [3]. Image alignment is the fundamental operation in varied computer vision applications. SAR image alignment applications in the domain of remote sensing, includes disaster analysis [4], image mosaicing, change detection[5] ,image fusion, semantic aerial image [6] and 3D modeling [7],[8]. There is substantial research in the field of image alignment, the review papers by Brown (1992) [9] and Zitov (2003) [10] report this survey in detail. According to Barbara Zitova image alignment is classified into feature based approach and area based or intensity based approach. Area based alignment approach is based on intensities of the
image whereas feature based approach mainly relies
on features for alignment. According to
Lemmens[11], intensity-based algorithms are
ISSN: 1992-8645 www.jatit.org E-ISSN: 1817-3195
3147 to noise and salient in nature. According to Chen and Wu the standard approach of feature based image alignment comprise feature detection and description, feature matching and transform model estimation[13][14].
The aim of feature detection is to detect regions (interest points / key points /feature points) that are location, scale and affine covariant in nature. A patch around the detected regions are described by a invariant feature vector which is extracted using image transform coecients,1st,2nd order derivatives and parametric models. Correspondence between
images is computed by detecting set of
corresponding feature points each related with feature descriptors from SAR image data. The three approaches for identifying feature correspondence are
• Intensive search approach, for each
detected feature in source image, review at all the features detected in reference image.
• Nearest-neighbor approach using Kd
trees and variants.
• Hashing approach computes precise
descriptor from each vector or hash long descriptor.
After attaining the nearest correspondence among feature/interest points, we need to estimate appropriate spatial transformation among the matched feature points of source and target SAR images. Based on this transformation a relevant optimization algorithm is used to refine the correspondences and finally the source SAR image is transformed to target SAR image using mapping function and interpolation. [15][16][17].Dahl and F.Fraundorfer stated that in spite of the significant advances made in feature extraction algorithms, it still remains quite a task to automatically align SAR images with challenging characteristics (Extreme
view change, illumination, scale and
texture)[18][19]. The standard alignment approach using an efficient detector/descriptor is able to address only limited set of rotations and scale changes. Most of the detectors fail if view angle difference is greater than 60degree for planar and 30 degree for non planar objects. In addition, it has been proved that a single feature detector/descriptor may not be sufficient to address all kinds of SAR
images and deformations between the SAR images.
Once a feature detector and descriptor for the application have been selected, some of the issues when images are being registered with this pipeline are:
1. Matching is traditionally performed by measuring the correspondences between the source and target image descriptors using threshold on the nearest neighbor distances or the ratio of nearest neighbor distances. However, in practice, the optimal nearest neighbor algorithm and its parameters depend on the data set characteristics. For the same kind of images, in this case SAR images, accuracy of matches varies as the kind and amount of deformation between images changes even when the method of matching remains same. This is because; the performance of matching based on interest points depends on both the properties of the underlying interest points and the associated image descriptors.
2. Transformation is performed using RANSAC based algorithms. It is Possible to accurately compute homography matrix if there is reasonable number of accurate correspondences between the images. Although proven highly successful, by applying standard RANSAC, without explicitly considering the underlying problem it is employed to solve, important problem-specific clues are being ignored for the quality of hypotheses.
3. There has been little progress in objectively estimating the accuracy of registration. Only after transforming the source image using the estimated matrix and comparing the transformed target image with the source image, success of registration can be commented upon.
Due to the aforementioned issues the outcome of registration of two images even when belonging to the same sensor is unpredictable with all the parameters of the feature extraction, matching and transformation algorithm fixed. Hence Xiangjun and Chuan proposed several hierarchical or iterative kind of approaches performing estimation and evaluation of transformation parameters iteratively varying feature detectors and correspondences in each iteration [20] [21]. In this paper, we explore one such iterative approach for SAR image alignment, view synthesis, which is based on generating synthetic views of images and then applying the standard alignment pipeline on the entire set of images. This method is been proved
1. In finding more precise and correct
feature correspondences.
2. Aligning difficult matching cases.
3. Improving the performance of features
like SIFT, MSER, Hessian Affine in
terms of addressing ranges of
3148 However the approach needs to address the following concerns
1. The number of views to be generated is
not fixed.
2. Feature detection time shoots up
significantly as the views increases
3. Feature matching time shoots up even
further significantly.
4. The approach needs inputs in terms of
number of views to be generated, which cannot be fixed for all kinds of images and deformations.
The paper contributes in two main ways
1. To propose a model which should be
used to predict and tell us given two SAR images if they can be aligned or not. If aligned, the model predicts the alignment approach (standard approach or iterative approach)
2. Explore the use of detector features i.e.:
points detected from a feature detector in Bag of Words framework for prediction of alignment approach.
This paper is organized as follows: section 2 deals with related work on standard and iterative image alignment approach, section 3 presents iterative SAR image alignment approach using view synthesis, section 4 presents the implementation of prediction model using bag of words (BOW) model, section 5 briefs the experimental results and section 6 presents the conclusion and future work of the paper.
2. RELATED WORK ON STANDARD AND ITERATIVE IMAGE ALIGNMENT
The success of feature based standard alignment approach is directly based on the advances that have been made in the feature extraction algorithms. Enormous numbers of feature detectors and descriptors have emerged in recent times which are efficient in terms of invariance to a wide range of deformations, robustness to noise, computational efficiency etc. Progress has been made in interest point feature detection, initially from corner detectors like Moravac corner detector ,Harris[22] ,Shi-Tomasi which are translation and rotation invariant, to scale
invariant features like David Lowe SIFT
[23],Herbert's SURF[24] and further towards affine invariant detectors like Mikolajczyk's Hessian Affine and Harris Affine [25].Scale invariance was
addressed by introducing the concept of scale space which was further extended to Affine space by Mikolajczyk et al. After feature point has been recognized, they are extracted and described as feature descriptor or vector. A descriptor is a measurement taken from a region centered on a local point or feature defined by a feature detector. The main characteristics of feature descriptors are that they should i) allow definite differences between the region’s illumination, scale, shape, rotation and noise change ii) be robust to background clutter and occlusion iii) be invariant to photometric and geometric transformations. According to Bin Fan[26] feature descriptors have been widely researched .The two main categories of feature descriptors are real valued descriptors - SIFT, GLOH, MROGH, LIOP etc. and binary descriptors like ORB, FREAK, BRISK etc. However, no single detector or descriptor has been proved to be suitable for all applications of SAR image alignment. In addition, the amount of tolerance a feature has towards any deformation is fixed, which is not sufficient to align certain challenging SAR image pairs. To address wider range of disparities between the images, feature based iterative image alignment approach using view synthesis has been proposed.
Lepetit developed a matching algorithm generating synthetic views; the number of views
generated was really high for allowable
repeatability [27]. Morel proposed, ASIFT
ISSN: 1992-8645 www.jatit.org E-ISSN: 1817-3195
[image:4.612.85.304.156.645.2]3149 paper we explore the advantages of using synthetic views in aligning SAR images.
Table 1: Review of SAR Image Alignment using Standard Feature based and Iterative approaches.
SAR Image category Feature Extraction & Matching Transfo rmation Referen ce Landsat 5TM and ESR ,Multi Spectral QUICK BIRD and IKONOS
Edge Features Shift and search algorithm to find control points ,Edge pixel matching using -Cost function
Affine Tai D (2005)
[32]
QUICK BIRD and IKONOS
Wallis filter is applied to images and Foerstner Operator for extraction, Normalized cross correlation and probability relaxation based matching
Affine C Zhang (2005) [33] SAR and Optical Image Pairs
Distribution of Edge type features in a circular template -Canny edge detector ,similarity between circular region thin plate spline interpolation Rotation and Scale Lei Huang (2010) [34] LANDSA T and SPOT SURF-X, Correlation Best Bin First Search Method
Affine R.Bouch iha (2013) [35] Terra SAR X Image pair SIFT-OCT,SAR SIFT, Similarity measurement (SKLD),RANSAC
Affine Tao Tang(20 14) [36] Optical and Terra SAR X images Segmentation, level set iterative SIFT features, NNR matching
Affine Chuan Xu (2015) [37] SAR Images ASIFT,NNR Levenberg Optimization
Affine Xiangju n (2015)
[38]
3. ITERATIVE SAR IMAGE ALIGNMENT APPROACH USING VIEW SYNTHESIS
The standard feature based image
alignment algorithm using an efficient
detector/descriptor fails to align the SAR image pairs, as the deformation between the SAR images
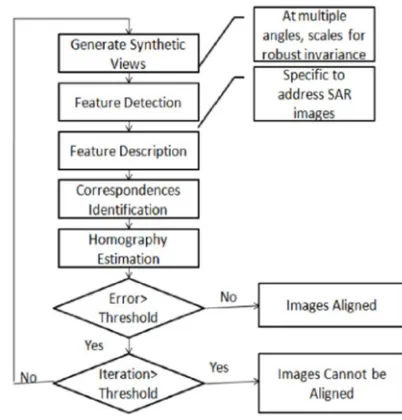
increases. The algorithm address only limited set of rotations and scale changes. To address wider range of disparities between the images, feature based iterative SAR image alignment using view synthesis has been proposed. Figure 1 below display the flow chart of iterative approach of image alignment using view synthesis. Iterative approach of image alignment using view synthesis consists of five important stages which are synthetic view generation, feature detection, feature
description, matching, inliers/homography
estimation, and error estimation and loop iteration.
Figure 1:Iterative approach of Image Alignment using View Synthesis
3.1 Synthetic View Generation
The objective of the view synthesis process is to support feature detectors with a adequately identical subset of all articial views on the view-sphere that allow matching. This is based on Ane camera model described in the following section.
3.1.1 Affine Camera Model
A camera matrix maps/transforms three
dimensional scene point , , into a two
dimensional image point x , .Affine
camera is a kind of projective camera acquired by constructing the camera matrix T,
0, 1 contracting the 12 degree of
freedom to eight.It is called affine because scene point at infinity are transformed to scene point at infinity.
[image:4.612.315.516.243.453.2]3150 The affine camera preserve ratio of length and parallelism.The image is presumed to stay far away from the camera and image generation starts from a
front view of the camera u, i.e., u = 1;t = 1;ϴ = 0;ø
= 0.The plane containing optic axis and the normal form an angle to the vertical plane which is fixed. This angle is called longitude. Its optical axis then makes a angle with the normal to the image plane u. This parameter is called latitude.Figure 2 shows the affine camera model.Three parameters decide the number of views that can be generated in view
synthesis, scale ,latitude øand longitudeϴ. The
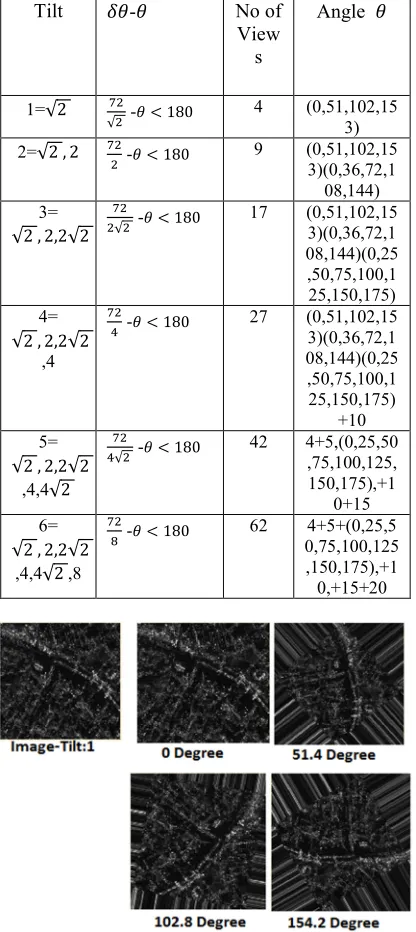
images undergo scale change, rotations followed by tilts.The tilt operation is carried out by applying anti aliasing lter in the direction of x, i.e convolution by a Gaussian. Table 2 show the generation of views.The number of views in each iteration is increased by changing the angle increment and tilt.The views generated in each tilt is explained in table 3 .The figure3 shows the views
generated for √2 tilt, is 72/ 2 and ϴ<180, with
[image:5.612.315.523.109.575.2]scale =1.
[image:5.612.314.522.109.569.2]Figure 2: Affine Camera Model
Table 2: Number of views tested for analysis of view synthesis, where scale parameter = 1
No of Views
Tilt
(From-To)
Angle Increment
(From-To)
Angle Range (From-To)
62 √2 -8
√ - 0-180
51 √2 -8
√ - 0-180
38 √2 -8
√ - 0-180
50 √2 -8
√ - 0-360
25 √2 -8
√ - 0-360
Table 3: Number of views generated for each tilt T
Tilt - No of
View s
Angle
1=√2
√ - ! 180 4 (0,51,102,153)
2=√2 , 2 - ! 180 9 (0,51,102,15 3)(0,36,72,1 08,144) 3=
√2 , 2,2√2 √ - ! 180
17 (0,51,102,15 3)(0,36,72,1 08,144)(0,25 ,50,75,100,1 25,150,175) 4=
√2 , 2,2√2 ,4
- ! 180 27 (0,51,102,15
3)(0,36,72,1 08,144)(0,25 ,50,75,100,1 25,150,175)
+10 5=
√2 , 2,2√2 ,4,4√2
√ - ! 180 42 4+5,(0,25,50,75,100,125,
150,175),+1 0+15 6=
√2 , 2,2√2 ,4,4√2 ,8
- ! 180 62 4+5+(0,25,5
[image:5.612.109.243.363.497.2]0,75,100,125 ,150,175),+1 0,+15+20
Figure 3: Synthtic views generated for tilt: 1=√2, Angle of increment
√ #$ ! 180 %&#' ()*+, 1
3.2 Feature Extraction
[image:5.612.90.297.569.724.2]ISSN: 1992-8645 www.jatit.org E-ISSN: 1817-3195
3151
array and used for feature matching.
Features refer to a pattern or distinct structure
found in an image, such as a point, edge, or small image patch.
3.3 Feature Matching
Nearest neighbor ratio matching is used to find the correspondences between the pair of images.
3.4 Inliers /Homography Estimation
Using RANSAC algorithm inliers and outliers are detected and homography is estimated using the inlier points.
3.5 Error Estimation & Loop Iteration
Key Point Error is the euclidean distance between computed homography transformed matched points of source with target image matched points.If the error is above a predefined threshold, the process is iterated with increasing the number of views.
3.6 Experimental Results
Four Terra SAR X band images of size 9216x10556 which vary in look angle of 2 to 5 degree are used for experiments. From these four SAR images we have generated multiple source and
target images by introducing additional
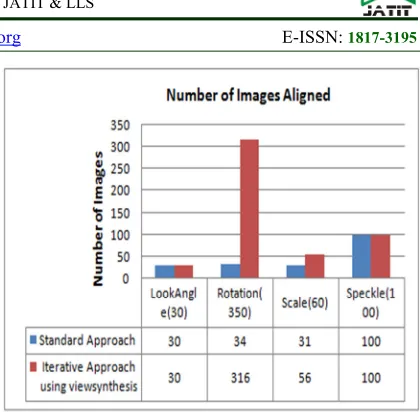
[image:6.612.83.525.25.683.2]deformations like scale and rotation. Total of 540 Terra SAR X image pairs of size 950x950 are generated with hundred, eighty, sixty and forty percent overlap between SAR images. We tried aligning 540 SAR image pairs using standard feature based image alignment approach. It is observed that out of 540 SAR image pairs only 197 image pairs could be aligned. In order to align more number of images we have moved to feature based iterative SAR image alignment approach using view synthesis. It is observed from the table 4 the number of SAR images aligned using iterative approach is high compared to standard approach. The figure 4 shows using standard approach we can align SAR images that vary in scale, look angle, speckle and up to 30 degree rotated images. As the angle of rotation between the images increases standard approach could not align the images.
Table 4: Total Number of Images Aligned using standard and iterative SAR image alignment approaches.
Image Alignment
Approach
Total Images
Aligned Not
Aligned
Standard Approach
540 197 343
Iterative Approach using
view synthesis
[image:6.612.313.523.60.266.2]540 502 38
Figure 4: Total Number of Images Aligned deformation wise in using standard and iterative SAR image
alignment approaches.
Though iterative approach is more efficient in terms of addressing range of deformations between the images, it has been observed that increasing number of views time and space complexity increases. This can be observed in figure 5. Hence we have tried to build a prediction model which can predict possibility of aligning the given SAR image pairs. Once we know the possibility of aligning, the model guides the user by providing some knowledge on the kind of registration approach to be applied between two SAR images. This model helps the user to save time required for aligning SAR images that could not be registered by standard or iterative approach.
Figure 5: Average Alignment time for without view synthesis and with view synthesis each tilt
4. IMPLEMENTATION OF PREDICTION MODEL USING BAG OF VISUAL WORDS FRAMEWORK
[image:6.612.97.521.480.687.2]3152 processing based algorithm like Bag of Words to predict the presence of the scene. Hence we have used Bag of words algorithm to predict registration parameters. Diane Larlus and Florent Perronnin, research scientist in computer vision group at Xerox Research Centre Europe has written in article “A tribute to visual words and how they revolutionized computer vision”, has emphasized that according to Google Scholar there are more than 1,900 papers published related to Bag of visual words model as of today. Most of these papers use bag of visual words in various applications like image retrieval image
reconstruction, image matching, scene/image
classification, textural analysis, image/object
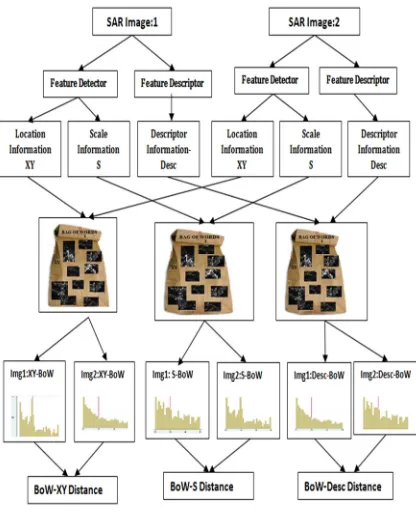
recognition, visual categorization. However, there is no experimental analysis on assessing the relationship between the Bag of visual word distances and the prediction of image alignment. According to Gabriella [39], the idea of Bag of features comes from texture recognition and then extended to document matching (Bag of words) and later to images in classification and retrieval applications as Bag of visual words. As in feature based SAR image alignment approach, the first step is to extract features; the same features can be used for generating Bag of Words feature vector. In Bag of visual words algorithm we detect features using feature detector algorithm and extract a patch around each detected point, this patch is represented as a vector. The image is represented as set of vectors which is clustered; these clusters are called as visual words. Now we mean an image as histogram or bag of visual words.
However, the set-back of Bag of words is that , histogram of descriptors of an image does not carry any spatial information and it does not have any order, it is just a distribution and hence histogram of visual words is order less, it tells how many times a visual word occurs and does not care about its location. Since the image alignment deals with geometric transformations, spatial information between detected features plays a vital role. In order to extract the spatial information we have proposed to make use of feature detector parameters like XY locations and Scale along with feature descriptor for building the model. Using the three feature attributes (XY, Scale and descriptor) we built a model to predict the following outcomes for each pair of the images.
• Given an image pair the model needs to
predict the possibility of alignment.
• If aligned, the model can also predict the
type of alignment approach (standard or iterative) used for alignment.
[image:7.612.317.525.140.396.2]The figure 6 shows flow diagram of proposed feature attributes computation using Bag of Visual Words (BoW) model.
Figure 6:Flow diagram of proposed feature attribute computation using Bag of Visual Words model
5. EXPERIMENTS AND RESULTS
Image registration without and with View synthesis was implemented in OpenCV. For each view features are detected using Hessian Affine detector and described using SIFT descriptor. All the features are stored in a vector array and used for matching. Nearest neighbor ratio matching with RANSAC for inliers estimation is performed.
5.1 Feature Set
For a pair of images we have extracted the bag of words descriptor distance. In order to extract the spatial information we have proposed to make use of feature detector parameters like XY location and Scale distance between the image pair. In this paper we have used Bhattacharya distance measure to calculate the BOW distance between the given image pair. We have also tried to fuse the features
and evaluated the model by combining descriptor,
XY distance, descriptor, scale distance and descriptor ,XY, scale distances.
5.2 Classes
ISSN: 1992-8645 www.jatit.org E-ISSN: 1817-3195
3153
• Two Class problem: Given a SAR image
pair the model needs to predict whether they can be aligned (class1) or not (class2).
• Three Class problem: Given a SAR image
pair the model needs to predict whether they can be aligned or not (class1).If aligned, using standard approach (class2) or using iterative approach (class3).
5.3 Algorithms Used
For building a classifier we have used three algorithms
Naive Bayes: This algorithm is probability based and represents statistical as well as supervised learning methods established on bayes theorem. The algorithm can assess the parameters needed for classification from a limited set of training data. The existence and absenteeism of any feature is not reliant on other.
J48: Ross Quinlan developed Java implementation
of C 4.5, which generates a decision tree established on a labeled set of input features. The entire feature space is successively divided by selecting features with maximum information gain IG
Support Vector Machines-SVM: Supervised
learning algorithms for regression and
classification.SVM make use of kernel equations and apply linear classification algorithms to non-linear data. These equations align the data values in a way that a hyper-plane splits the data into two distinct categories. The data that is separated need to be binary.
5.4 Evaluation Dataset
Four Terra Synthetic Aperture Radar X band (SAR-X) Look Angle varied images of size 9216x10556 was obtained. In order to facilitate a significant assessment, we have generated 10 datasets of hundred, eighty, sixty, forty percent overlapped multiple source and target images by introducing additional deformations like rotation, scale and induced speckle noise. The total number of images per dataset is 54.The figure 7 shows the sample dataset Terra SAR images.
• Look-Angle-3 images (vary by 2 degree
each)
• Rotation-35 images (vary by 10 degree
each)
• Speckle-10 images (vary by 0.04, 0.08,
0.12, 0.16,0.2, 0.24, 0.28,0.32,0.36,0.4 variance)
• Scale- 6 images (scale factor of
[image:8.612.318.523.92.414.2]0.5,2,2.5,3,3.5,4 )
Figure 7:Terra SAR-X Dataset Images
5.5 Results Of Prediction Model Results Of Two Class Problem
The prediction model is investigated and evaluated with three classification algorithms those are Naive Bayes, SVM and J48 ( using tenfold cross validation).Table 5 and 6 show the accuracy and error rate of prediction model in identifying the possibility of aligning two images on the basis of correctly classified instances with cross validation .Comparison of accuracy for all feature attributes is done and it has been investigated that the accuracy of classifier model increases when we combine the feature attributes of both detector(XY, Scale) and descriptor ,it is also observed that accuracy is consistent across the classification algorithms. The figure 8 shows the classification tree of prediction model in identifying the possibility of aligning two SAR images, where X1 is the descriptor parameter, X2 is XY detector parameter and X3 is scale parameter.
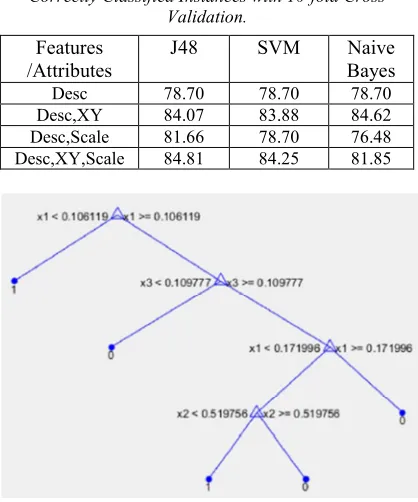
3154 Correctly Classified Instances with 10-fold Cross
Validation.
Features /Attributes
J48 SVM Naive
[image:9.612.91.300.101.352.2]Bayes Desc 78.70 78.70 78.70 Desc,XY 84.07 83.88 84.62 Desc,Scale 81.66 78.70 76.48 Desc,XY,Scale 84.81 84.25 81.85
Figure 8:Flow diagram of proposed feature attribute computation using Bag of Words model
The main objective of this paper is to explore the use of detector features i.e.: points detected from a feature detector for prediction of alignment approach. It is observed that likelihood to align images significantly depends on the amount and kind of deformation between the images. It is well-known that descriptor vectors do not hold any spatial information encoded in them. Hence spatial information present in feature detector has been exploited by using it in BoW model. The results prove that there exists a relation between distances of BoW histograms of XY locations and kind of deformation was observed.
We have evaluated the accuracy of prediction model in identifying the possibility of registering two images across feature detectors, like SIFT, MSER, FAST and Hessian Affine for a sample set of 54 Terra SAR X images using J48 classification algorithm. It is observed from the table 7 that irrespective of type of detector, descriptor used in the alignment algorithm the accuracy identifying the possibility of registering two images increases when we combine the feature attributes of both detector(XY, Scale) and descriptor.
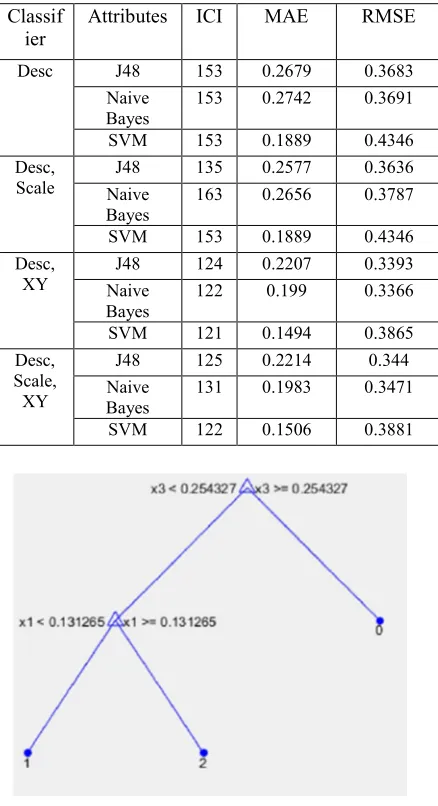
5.6 Results Of Three Class Problem
Given a SAR image pair the model needs to predict they can be aligned using standard approach (class2), iterative approach (class3) or they cannot be aligned (class1). Table 8 and 9 show the accuracy and error rate of prediction model in identifying the approach used for aligning two SAR images on the basis of correctly classified instances with 10 fold cross validation. It is observed from table 8 that accuracy of classifier model increases when we combine the feature attributes of both
detector (XY, Scale) and descriptor. The figure 9
shows the classification tree of prediction model in identifying the approach used for aligning two SAR images, where X1 is the descriptor parameter, x2 is
[image:9.612.307.529.328.529.2]XY detector parameter and x3 is scale parameter.
Table 6: Error Rate of prediction model in identifying the possibility of registering two images with 10-fold Cross
Validation.
Attributes Incorr
ectly Classi fied Instan
ces
Mean absolute
error
Root mean squared
error
[image:9.612.308.529.594.686.2]J48-DESC 115 0.30 0.39 NB-DESC 115 0.31 0.39 SVM-DESC 115 0.21 0.46 J48-DESC,S 99 0.28 0.38 NB-DESC,S 127 0.30 0.40 SVM-DESC,S 115 0.21 0.46 J48-DESC,XY 86 0.22 0.34 NB-DESC,XY 83 0.19 0.34 SVM-DESC,XY 87 0.16 0.40 J48-Desc,XY,S 82 0.22 0.34 NB-DESC,XY,S 98 0.19 0.35 SVM-DESC,XY,S 85 .015 .039
Table 7: Accuracy of prediction model in identifying the possibility of aligning two SAR images across multiple feature detectors using J48 Classification algorithm, on
the basis of Correctly Classified Instances with 10-fold Cross Validation.
Feature Detector
Desc Desc,XY Desc,
Scale
Desc, XY, Scale
FAST 94 95 95 94.44
SIFT 70 71 71 71
Hessian Affine
83 89 89 89
MSER 88 89 89 89
ISSN: 1992-8645 www.jatit.org E-ISSN: 1817-3195
3155 on the basis of Correctly Classified Instances with 10 fold
Cross Validation.
Features/Attributes J48 SVM Naive
[image:10.612.84.305.117.188.2]Bayes Desc 71.67 71.67 71.67 Desc,XY 77.7 77.6 77.5 Desc,Scale 75 71.67 69.81 Desc,XY,Scale 76.85 75.74 77.40
Table 9: Error Rate of prediction model in identifying the aligning approach used for registering two SAR images
with 10 fold Cross Validation.
Classif ier
Attributes ICI MAE RMSE
Desc J48 153 0.2679 0.3683 Naive
Bayes
153 0.2742 0.3691
SVM 153 0.1889 0.4346 Desc,
Scale
J48 135 0.2577 0.3636 Naive
Bayes
163 0.2656 0.3787
SVM 153 0.1889 0.4346 Desc,
XY
J48 124 0.2207 0.3393 Naive
Bayes
122 0.199 0.3366
SVM 121 0.1494 0.3865
Desc, Scale, XY
J48 125 0.2214 0.344 Naive
Bayes
131 0.1983 0.3471
SVM 122 0.1506 0.3881
Figure 9:Classification Tree of prediction model in identifying the aligning approach used for registering
two SAR images with 10 fold Cross Validation
6. CONCLUSION
Aligning SAR Images which differ with complex deformations is a challenging task. Standard feature based image alignment approach with single feature detector /descriptor most of the times fails to meet the requirements. Hence, an iterative approach with synthetic view generation has been tried and tested with a considerable data set of Terra SAR X band images. View synthesis addresses a wide range of deformations but is an expensive approach in terms of time and space. In this paper, we have proposed to use a classifier model to predict the need of view synthesis approach when aligning two Terra SAR X band images. The model has shown good accuracy in predicting if images can be aligned or not in addition to predicting the kind of approach needed for alignment. The attributes used for model are derived from features which are to be used for alignment .Bag of words model has been used on descriptor values and detector values to build a robust attribute set between image pairs. It has been proved on images of all deformations and also on different features that using detector points along with descriptor with BOW vector has increased the efficiency of the predictions of all the classifiers tested. In future we would like to build a model to precisely predict the parameters of view synthesis approach when registering the images .This shall save the iterations and make view synthesis suitable for real time applications.
REFRENCES:
[1]Slomka, P.J, “Multimodality image registration
with software: State-of-the-art”, Eur. J. Nucl.
Med. Mol. Imag, Vol.36, 2009, pp.44--55.
[2]Salvi, J.; Matabosch, C.; Fo , D.; Forest, J, “A review of recent range image registration
methods with accuracy evaluation”, Image Vis.
Comput, Vol.25 , 2007,pp.578--596.
[3]Dawn, S.; Saxena, V.; Sharma, B., “Remote sensing image registration techniques: A
survey”, In Image and Signal Processing;
Springer:Berlin / Heidelberg, Germany,Vol.
6134,2010,pp.103--112.
[4]Honkavaara, E.; Litkey, P.;Nurminen, K.
“Automatic storm damage detection in forests using high-altitude photogrammetric imagery”,
Remote Sens.,Vol. 5, 2013,pp.1405—1424.
[5]Peter, T.B.B.; Guida, R, “Earthquake damage detection in urban areas using curvilinear
Features”, IEEE Trans. Geosci. Remote
Sens.,Vol.51,2013, pp.4877--4884.
[6]Mnih, V. Hinton, G, “Learning to label aerial
[image:10.612.85.304.245.648.2]3156
29th International Conference on Machine
Learning, Edinburgh, Scotland, UK.
2012,pp.567- 574.
[7]Parmehr, E.G.; Fraser, C.S.; Zhang, C.; Leach, S. “Automatic registration of optical imagery with 3D LiDAR data using statistical similarity ”,
ISPRS J. Photogramm. Remote Sens ,Vol.88,
2014,pp.2840.
[8]Lerma, J.L.; Navarro, S.; Cabrelles, M.; Segui, A.E.; Hernndez, D, “Automatic orientation and 3D modelling from markerless rock art
imagery”,ISPRS J. Photogramm. Remote Sens.,
Vol.76,2013,pp 64-- 75.
[9]LG Brown, “A surveyof image registration
techniques ”, ACM Computing
Surveys,Vol.24,No.4, 1992,pp.325-376.
[10]B.Zitova, Flusser, J, “`Image registration
methods: A survey ”, Image Vis. Comput ,
Vol.21 ,2003,pp. 977—1000.
[11]Lemmens, M.J.P.M, “A survey on stereo
matching techniques ”, Int. Arch.
Photogramm.Remote Sens. Spat. Inf. Sci.,Vol.
27,1988,pp.11--23.
[12]Yi, Z.; Zhiguo, C.; Yang, X , “Multi-spectral remote image registration based on SIFT
”,Electron. Lett, Vol.44, 2008,pp.107--108.
[13]Chen, Q.; Wang, S.; Wang, B.; Sun, M, “Automatic registration method for fusion of
ZY 102C satellite images”, Remote Sens.,Vol.
6, 2014, pp.157--179
[14]Wu, Y.; Ma, W.; Gong, M.; Su, L.; Jiao L , “A novel point-matching algorithm based on fast sample consensus for image registration ”,
IEEE Geosci. Remote Sens. Lett, Vol.12,
2015,pp.43--47
[15]Ma, J.; Zhou, H.; Gao, Y.; Jiang, J.; Tian, J, “Robust feature matching for remote sensing
image registration via locally linear
transforming ”, IEEE Trans. Geosci. Remote
Sens, Vol.53,2015,pp. 6469—6481.
[16]Ye, Y.; Shan, J, “A local descriptor based registration method for multispectral remote sensing images with non-linear intensity di
erences. ”, ISPRS J. Photogramm. Remote
Sens., Vol.90,2014, pp.83—95.
[17]Linger, M.E.; Goshtasby, A, “ Aerial image
registration for tracking ”, IEEE Trans. Geosci.
Remote Sens., Vol.53,2015,pp. 2137—2145.
[18]A. L. Dahl, H. Aanaes, and K. S. Pedersen , “Finding the best feature detector-descriptor
combination ”, 3DIMPVT, 2011.
[19]F.Fraundorfer and H.Bischof, “A novel
performance evaluation method of local
detectors on non-planar scenes ”, InCVPR05
Workshops, 2005.
[20]Xiangjun Wang, “ An ASIFT-Based Local
Registration Method for Satellite Imagery”,,
Remote Sens , doi:10.3390/rs70607044,2015.
[21]Chuan Xu, Haigang Sui, Hongli Li ,Junyi Liu, “An automatic optical and SAR image registration method with iterative level set
segmentation and SIFT ”, IJRS, International
Journal of Remote Sensing,
DOI:10.1080/01431161.2015.10703 21,2015. [22]Chris Harris and Mike Stephens, “A combined
corner and edge detector ”, In Proc. of Fourth
Alvey Vision Conference,1988, pp.147-151.
[23]David G. Lowe(2004), “Distinctive image
features from scale-invariant keypoints”, Inter-
national Journal of Computer Vision,
Vol.60,2004, pp.91-110
[24]Herbert Bay, Tinne Tuytelaars, and Luc Van
Gool, “Surf: Speeded up robust features ”, In
ECCV ,2006,pp. 404-417
[25]K. Mikolajczyk and C. Schmid , “Scale and
affine invariant interest point detectors ”, IJCV
Vol.60,No.1,2004,pp.63—86.
[26]Bin Fan ,Zhenhua Wang, Fuchao Wu, “Local
image descriptor:Morderen Approaches”,
Springer briefs in Computer Science,2013,
pp.99.
[27]V. Lepetit and P. Fua, “Keypoint recognition
using randomized trees”, PAMI,Vol.28,No.9,
2006, pp.1465—1479.
[28]J.-M.Morel and G.Yu, “ASIFT:A new
framework for fully afne invariant image
comparison ”, SIIMS, 2009,pp.438-469
[29]Y. Pang, W. Li, Y. Yuan, and J. Pan, “Fully affine invariant SURF for image matching ”,
Neurocomputing, Vol.85,2012,pp.6--10.
[30]Dmytro Mishkin and Michal Perdoch
and Jiri Matas, “Two-View Matching with
View Synthesis Revisited ”, CoRR, 2013,1306-
3855.
[31]K. Lebeda, J. Matas, and O. Chum, “ Fixing the
Locally Optimized RANSAC”, BMVC , 2012.
[32]Gabriella Csurka and Christopher R. Dance and Lixin Fan and Jutta Willamowski and Cdric Bray, “Visual categorization with bags of
keypoints”, In Workshop on Statistical
Learning in Computer Vision, ECCV ,
2004,pp.1-22.
[33]Tai D. Hong, “A Robust Technique for Precise Registration of Radar and Optical Satellite
ISSN: 1992-8645 www.jatit.org E-ISSN: 1817-3195
3157
Remote Sensing ,10.14358,PERS.71.5.585,
2005.
[34]C.Zhang, “Automated registration of high resolution satellite imagery for change detection
”, Research Report, Department of Geomatics,
University of Melbourne ,2005.
[35]LEI Huang, “Feature based image registration
using the shape context ”, International
Journal of Remote Sensing ,2010
[36]R. Bouchiha and K. Besbes , “Automatic remote sensing image registration using surf ”, Int. J.
Comput. Theory Eng ,2013,pp.88 -92.
[37]Tao Tang, “A New Local Feature Descriptor for
SAR Image Matching-Progress”, In
Electromagnetics Research Symposium
Proceedings, Guangzhou, China ,2014.
[38]Chuan Xu, Haigang Sui, Hongli Li ,Junyi Liu, “An automatic optical and SAR image registration method with iterative level set
segmentation and SIFT ”, IJRS, International
Journal of Remote Sensing