Evolution in Open Source Software:
A Case Study
Michael W. Godfrey and Qiang Tu
Software Architecture Group (SWAG)
Department of Computer Science, University of Waterloo
email:
fmigod,qtu
g@swag.uwaterloo.ca
Abstract
Most studies of software evolution have been performed on systems developed within a single company using tradi-tional management techniques. With the widespread avail-ability of several large software systems that have been de-veloped using an “open source” development approach, we now have a chance to examine these systems in detail, and see if their evolutionary narratives are significantly different from commercially developed systems. This paper summa-rizes our preliminary investigations into the evolution of the best known open source system: the Linux operating system kernel. Because Linux is large (over two million lines of code in the most recent version) and because its develop-ment model is not as tightly planned and managed as most industrial software processes, we had expected to find that Linux was growing more slowly as it got bigger and more complex. Instead, we have found that Linux has been grow-ing at a super-linear rate for several years. In this paper, we explore the evolution of the Linux kernel both at the system level and within the major subsystems, and we discuss why we think Linux continues to exhibit such strong growth.
1
Introduction
Large software systems must evolve, or they risk losing market share to competitors [15]. However, maintaining such a system is extraordinarily difficult, complicated, and time consuming. The tasks of adding new features, adding support for new hardware devices and platforms, system tuning, and defect fixing all become more difficult as a sys-tem ages and grows.
Most published studies of software evolution have been performed on systems developed “in house” within a single company using traditional development and management techniques [3, 4, 12, 15, 23]. In this paper, we present a case study of the evolution of the Linux operating system
[9, 8, 7]. This system has been developed using an “open source development” approach that is quite different from the way most industrial software is created [18].
2
Related Work
Lehman et al. have built the largest and best known body of research on the evolution of large, long-lived software systems [13, 15, 14, 23]. Lehman’s laws of software evo-lution [15], which are based on his case studies of sev-eral large software systems, suggest that as systems grow in size, it becomes increasingly difficult to add new code unless explicit steps are taken to reorganize the overall de-sign. Turski’s statistical analysis of these case studies sug-gests that system growth (measured in terms of numbers of source modules and number of modules changed) is usually sub-linear, slowing down as the system gets larger and more complex [14, 23].
Gall et al. examined the evolution of a large telecom switching system both at the system level and within the top-level subsystems [4], much as we have done with Linux. They noted that while the system-level evolution of the sys-tem seems to conform to the traditionally observed trend of reduced change rates over time, they noted that the major subsystems may behave quite differently from the system as a whole. In their case study they found that some of the major subsystems exhibited “interesting” evolutionary be-haviours, but that these behaviours cancelled each other out when the full system was viewed at the top level. They ar-gue that it is not enough, therefore, to consider evolution from the topmost level; one must also be concerned about the individual parts as well. Our own investigations strongly support this view.
Kemerer and Slaughter have presented an excellent sur-vey of research on software evolution [12]. They also note that there has been relatively little research on empirical studies of software evolution.
and why software becomes increasingly brittle over time [16]. Eick et al. extend the ideas suggested by Parnas by characterizing software “decay” in ways that can be detected and measured [3]. They used a large telephone switching system as a case study. They suggest, for exam-ple, that if it is common for defect fixes to require changes to large numbers of source files, then the software system is probably poorly designed. Their metrics are predicated on the availability of detailed defect tracking logs that allow, for example, a user to determine how many defects have re-sulted in modifications to a particular module. We note that no such detailed change logs were available for our study of Linux.
Perry presented evidence that the evolution of a software system depends not only on its size and age but also on fac-tors such as the nature of the system itself (i.e., its appli-cation domain), previous experience with the system, and the processes, technologies, and organizational frameworks employed by the company that developed the software [17].
3
Open Source Software Development
Although the term “open source” is relatively recent, the fundamental ideas behind it are not [10, 18]. The single most important requirement of an open source software sys-tem is that its source code must be freely available to anyone who wishes to examine it or change it for their own pur-poses. That is, a user must always be able to “look under the hood” and be allowed to tune, adapt, or evolve a system for his/her personal needs.
While the development of open source software (OSS) is often highly collaborative and geographically distributed, this is not a strict requirement. Many corporations and in-dividuals have developed source code in-house as a propri-etary project only to release later it as “open source” or with a license that allows great freedom for personal use of the system. Examples of this include the Netscape web browser (i.e., the Mozilla project), theJikesJava compiler from IBM, and Sun’s Java Development Kit.
The “other” kind of open source system is one that is developed from very early days as a highly collaborative project done “out in the open”; that is, these systems follow an open source development (OSD) model.1 Usually, such
a project begins with a single developer who has a personal goal or vision. Typically, that person will begin work on their system either from scratch or by cannibalizing an ex-tant older system. For example, Linux’s creator, Linus Tor-valds, started with a version of the Minix operating system, while VIM’s creator, Bram Moolenar, began with a older clone of thevitext editor calledstevie[11].
1Eric Raymond has written an informative book on open source
devel-opment called The Cathedral and the Bazaar [18].
3.1
Open Source Development vs.
Traditional Processes
Once the originator is ready to invite others into the project (s)he makes the code base available to others and development proceeds. Typically, anyone may contribute towards the development of the system, but the origina-tor/owner is free to decide which contributions may or may not become part of the official release.2
The open source development (OSD) model is differ-ent from traditional in-house commercial developmdiffer-ent pro-cesses in several fundamental ways. First, the usual goal of an open source project is to create a system that is useful or interesting to those who are working on it, not to fill a commercial void. Developers are often unpaid volunteers who contribute towards the project as a hobby; in return, they receive peer recognition and whatever personal satis-faction their efforts bring to them. Sometimes this means that much of the effort on an OSD project concentrates on what part-time programmers find interesting, rather than on what might be more essential. It can be difficult to direct de-velopment toward particular goals, since the project owner holds little power over the contributing developers. This freedom also means that it can be difficult to convince de-velopers to perform essential tasks, such as systematic test-ing or code restructurtest-ing, that are not as excittest-ing as writtest-ing new code.
Other notable features of open source development in-clude:
Scheduling: There is usually little commercial pres-sure to keep to any hard schedule, and most OSD de-velopers have “day jobs” that take up most of their time. While this may entail longer development cy-cles, this is also an advantage since OSD projects are largely immune from “time-to-market” pressures; a system need not be released until the project owners are satisfied that the system is mature and stable. Code quality and standards can vary widely. Since
code is contributed, it is hard to insist on particu-lar standards, although many projects do have official guidelines.
Unstable code is common, as developers are eager to submit their “bleeding edge” contributions to the project. Some OSD projects, including Linux, address this issue by maintaining two concurrent development paths: a “development” release path contains new or experimental features, and a “stable” release contains
2Some open source projects have forked into distinct development
streams when developers were unhappy with the route taken by the “of-ficial” branch. Under most open source license agreements, this splitting is explicitly permitted. The FreeBSD/NetBSD/OpenBSD systems are an example of this phenomenon.
mostly updates and bug fixes relative to the previous stable release. (In addition, when new “development” features are considered to be stable, they are some-times migrated into the current stable release without waiting for the next major baseline to be established.)
Planned evolution, testing, and preventive mainte-nance may suffer, since OSD encourages active par-ticipation but not necessarily careful reflection and re-organization. Code quality is maintained largely by “massively parallel debugging” (i.e., many developers each using each other’s code) rather than by systematic testing or other planned, prescriptive approaches.3
3.2
Evolution of OSD Systems
We have been examining the growth and evolution pat-terns of OSD projects to see how they compare to previ-ous studies on the evolution of large proprietary software systems developed using more traditional in-house pro-cesses. There are now many large OSD systems that have been in existence for a number of years and have achieved widespread use, including two that we have investigated in some detail: the Linux operating system kernel (2,200,000 lines of code) [9], and the VIM text editor (150,000 lines of code) [11].4
Naively, we had expected that since evolution of OSD software is usually much less structured and less care-fully planned than traditional in-house development that “Lehman’s laws” would apply [15]; that is, as the system grew, the rate of growth would slow, with the system growth approximating an inverse square curve [14]. Indeed, re-cently the maintainers of the Perl project have undertaken a massive redesign and restructuring of the core system [20], since the project owners felt that the current system has be-come almost unmaintainable.5 However, as we explain
be-low, this is not at all what we found with Linux.
3The development model of the FreeBSD operating system [6], a
ri-val to Linux, is a cross between traditional closely managed development and the relatively unstructured approach used by many OSD projects. The FreeBSD system accepts contributions from outsiders, but such contribu-tions are more carefully scrutinized before being accepted into the main source tree. The FreeBSD development team also performs much more stringent testing of code than Linux. As a result, FreeBSD tends to support fewer devices and development proceeds more slowly than Linux.
4Our preliminary analysis of VIM shows that it has also been growing
at a super-linear rate for a number of years.
5One of the core developers, Chip Salzenberg, has said of the current
version of Perl: “You really need indoctrination in all the mysteries and magic structures and so on before you can really hope to make significant changes to the Perl core without breaking more things than you’re adding.” [20]
4
The Linux Operating System Kernel
Linux is a Unix-like operating system originally writ-ten by Linus Torvalds, but subsequently worked on by hun-dreds of other developers [1].6 It was originally written torun on an Intel 386 architecture, but has since been ported to numerous other platforms, including the PowerPC, the DEC Alpha, the Sun SPARC and SPARC64, and even main-frames and PDAs.
The first official release of the kernel, version 1.0, oc-curred in March 1994. This release contained 487 source code files comprising over 165,000 lines of code (including comment and blanks lines). Since then, the Linux kernel has been maintained along two parallel paths: a development re-lease containing experimental and relatively untested code, and a stable release containing mostly updates and bug fixes relative to the previous stable release. By convention, the middle number in a kernel version identifies to which path it belongs: an odd number (e.g., 1.3.49) denotes a devel-opment kernel, and an even number (e.g., 2.0.7) denotes a stable kernel.
At the time of writing (January 2000), the most recent stable kernel is version 2.2.14, and the most recent devel-opment kernel version is 2.3.39. There have been 369 de-velopment kernel releases along four main threads (1.1.X, 1.3.X, 2.1.X, and 2.3.X) and 67 stable kernel releases along four main threads (1.0, 1.2.X, 2.0.X, and 2.2.X).
5
Methodology
We have measured various aspects of the growth of Linux using a variety of tools and assumptions, which we now describe.
We examined 96 kernel versions in total, including 34 stable kernel releases and 62 development kernel releases. We decided to measure relatively more of the stable kernels as they were released less frequently.
The size of the full distribution was measured as atar file compressed usinggzip; this file included all source artifacts of the kernel, including documentation, scripts, and other utilities (but no binary files). That is, the tarfiles were the versions available from the Linux Kernel Archives website [8].
We use the term “source file” to mean any file whose name ends with “.c” or “.h” that appeared in the original tarfile.7 We ignored other source artifacts such as con-figuration files and Makefiles. We also explicitly ignored
6Kernel version 2.3.39 released in January 2000 lists over 300 names in
the credits file as having made significant contributions to the development of the Linux kernel.
7Performing a system build creates additional source files, depending
on the options chosen. We ignored these additional files in the interest of uniformity and simplicity.
source files that appeared under theDocumentation di-rectory, as we felt these were not part of the kernel code per se.
We counted lines of code (LOC) using two approaches: first, we used the Unix command “wc -l” which gave a raw count that included blanks lines and comments in the totals; second, we used anawkscript that causes blank lines and comments to be ignored.8Finally, we used the program
“exuberant ctags” to count the number of global functions, variables, and macros [5].
In considering the major subsystems of Linux, we have used the directory structure of each source release as our definition of the subsystem hierarchy. Others have created customized subsystem hierarchies (i.e., source-based soft-ware architectures) based on detailed analyses of particu-lar versions of Linux [2, 22, 21]. We chose not to follow this route for two reasons: first, creating customized sub-system hierarchies for 96 versions of the Linux kernel, each of which contains between 500 and 5000 source files was a daunting task without clear benefit; second, our analyses of the subsystems’ evolution would have been peculiar to our own ideas of what the software architecture ought to look like, and would not conform to the mental model of most Linux developers.
Lehman suggests using the number of “modules” as the best way to measure the size of a large software system [15]. However, we decided to use the number of uncommented lines of code (“uncommented LOC”) for most of our mea-surements for several reasons. First, as discussed below, we found that total system uncommented LOC seemed to grow at roughly the same rate as the number of source files; how-ever, as shown by the difference between average and me-dian file size below, there was great variation in file size in some parts of the system. We decided, therefore, that using number of source files would mean losing some of the full story of the evolution of Linux, especially at the subsystem level.
6
Observations on the Evolution of Linux
We examined the evolution of the Linux kernel both at the system level as well as within each of the major subsys-tems; we found that the system as a whole exhibited such a strong rate of growth that an investigation of the major sub-systems was appropriate. We now discuss our observations.8We also plotted the difference between the two counts and we found
that the percentage of source file lines that were comments or blank stayed almost constant at between 28 and 30 percent. We consider this constancy to be a healthy sign. A decrease in the amount of commenting often in-dicates poorly maintained code, and a significant increase in commenting often indicates that a system has become difficult to understand and re-quires extra explanation.
6.1
System Level Growth
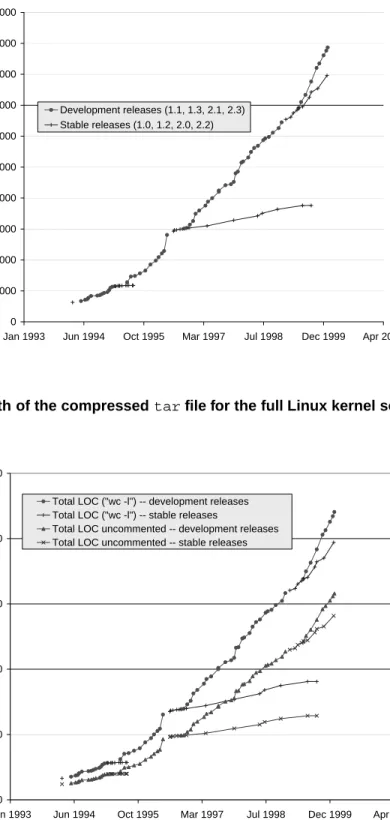
We first examined how the system has grown using sev-eral common metrics. For example, Fig. 1 shows the growth in size of the compressed tarfiles for the full kernel re-lease, and Fig. 2 shows the growth of the number of lines of code (LOC). We also measured the growth of the num-ber of source files and the growth of the numnum-ber of global functions, variables, and macros; however, we have omitted the graphs for these measurements for the sake of brevity as the growth patterns they show are very similar to those of Fig. 1 and Fig. 2.
It is interesting that these measurements all seem to tell the same story. They clearly show that the development re-leases are growing at a super-linear rate over time, which contradicts Lehman and Turski’s inverse square growth rate hypothesis [14, 23].9 The early stable kernel paths
(ver-sions 1.2.X, and 2.0.X, which can be seen on the graphs as starting in March 1995 and July 1996 respectively) are growing at a much slower rate than the corresponding de-velopment release paths, as one would expect. However, the most recent stable release path, version 2.2.X (which started in January 1999), has shown remarkable growth for a “stable” path. Subsequent investigation has determined that most of this growth has been in the addition of new features and support for new architectures rather than de-fect fixing [7]. The recent rapid rise in the popularity of Linux has resulted in a large amount of contributed stable code from third parties, such as IBM for their S/390 main-frame [24], together with external pressure to “fast track” integration of this code into the stable release path.
We plotted all growth against time rather than version number (Lehman et al. suggest the latter approach [14]). It made no sense to us to plot stable and development paths that were parallel in real time as being sequential; to do so would have led to apparent “dips” where one kind of release path finished and another began. Also, the behaviour of the two kinds of paths were understandably different: develop-ment kernels were released with great frequency and varied greatly in size, while early stable kernel releases varied in frequency but (until version 2.2.X) were relatively small in size. We also note that Linux emphatically does not appear to obey Lehman’s third law of software evolution, which states that the incremental effort spent on each release re-mains constant throughout a system’s lifetime [15]; for ex-ample, the update “patch” files within the 2.3.X release path
9Our statistical analysis shows that the growth rate of uncommented
LOC along the development release paths fits well into a quadratic model.
IfXis the number of days since version 1.0 was released andY is the size
of the Linux kernel in uncommented LOC, then the following function is a good model of the growth, as calculated using a “least squares” approxi-mation:
Y =0:21X 2
+252X+90;055
0 2,000,000 4,000,000 6,000,000 8,000,000 10,000,000 12,000,000 14,000,000 16,000,000 18,000,000 20,000,000
Jan1993 Jun1994 Oct1995 Mar1997 Jul1998 Dec1999 Apr2001
Size
in
bytes
Developmentreleases(1.1,1.3,2.1,2.3) Stablereleases(1.0,1.2,2.0,2.2)
Figure 1. Growth of the compressedtarfile for the full Linux kernel source release.
0 500,000 1,000,000 1,500,000 2,000,000 2,500,000
Jan1993 Jun1994 Oct1995 Mar1997 Jul1998 Dec1999 Apr2001
Total
LOC
TotalLOC("wc-l")--developmentreleases TotalLOC("wc-l")--stablereleases
TotalLOCuncommented--developmentreleases TotalLOCuncommented--stablereleases
Figure 2. Growth in the number of lines of code measured using two methods: the Unix command “wc -l”, and anawkscript that removes comments and blanks lines.
varied in size from a few hundred bytes to a few megabytes. We hypothesize that this is a direct consequence of the OSD process model, for reasons stated above.
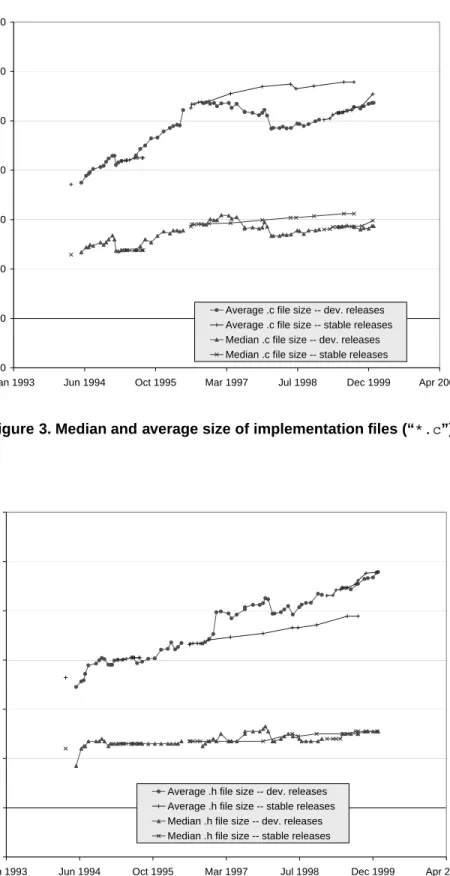
Since the growth patterns seem to be similar for each of the metrics we used, we tried dividing one measure by an-other to see if the resulting curve was a straight line. We therefore plotted the average file sizes (total uncommented LOC divided by number of source files) as well as the me-dian sizes of both “dot-c” (implementation) and “dot-h” (header) source files. Figure 3 and Fig. 4 show that me-dian file sizes were fairly stable, with slight growth in the size of dot-c files, while average file sizes showed definite growth over time. This indicates that while some dot-c files are becoming quite large, most are not. Our subsequent in-vestigation showed that almost all of the largest files were drivers for complicated hardware devices.10 We consider
the flatness of the median dot-h file size curve to be a good sign, as it suggests that new features were not being added indiscriminately to the dot-h files. Investigation into the rise in average size of dot-h files revealed that there were a small number of very large dot-h files for device drivers that con-tained mostly data; these very large dot-h files tended to skew the overall average file size.
An interesting trend arises beginning in mid-1996 with the stable release 2.0.X and its parallel development re-lease 2.1.X as shown in Fig. 3 and Fig. 4. Along rere-lease path 2.0.X, we can see that the average dot-c file size in-creased, while along release path 2.1.X this value decreased before eventually beginning to increase again. At the same time, the average dot-h file size along release path 2.0.X in-creased slowly but steadily, while along 2.1.X the average dot-h file size increased more significantly and dominated the stable release path. By cross referencing this graph with the growth in the number of files, we note that the number of source files grew slowly along stable release 2.0.X, while there was a larger steady increase in the number of source files along 2.1.X, with a significant jump at the same point where its average dot-c file size dipped.11 This suggests
that along the stable release path, its increase in average file size is likely due to bug fixes and simple enhancements that added code to existing files, as one would expect from a sta-ble release path. Along the development release path, it is likely that many new small files were created due to new features being added, causing the average dot-c file size to decrease.12 We consider it a healthy sign that new
develop-10For example, in the most recent development kernel (v2.3.39) while
six of the largest eight dot-c files were drivers for SCSI cards, four of the six largest dot-h files were for network card drivers. This led us to the initial conjectures that SCSI cards have complicated logic, and network cards have complicated interfaces. It turned out that while SCSI cards do have complicated logic, most of the content of the network card dot-h files was simply data.
11At the same time, the ratio of the number of dot-c files to dot-h files remained almost constant along both paths.
12The large jump in average dot-h file size that occurred at release 2.1.20
ment seemed to result in additional infrastructure (i.e., new small files) that were then “filled out” over time.
6.2
Growth of Major Subsystems
After investigating the growth of Linux at a system-wide level, we then decided to investigate the growth of the major subsystems (as defined by the source directory hierarchy). There are ten major source subsystems [19]:
driverscontains a large collection drivers for vari-ous hardware devices;
archcontains the kernel code that is specific to partic-ular hardware architectures/CPUs, including support for memory management and libraries;
includecontains most of the system’s include (dot-h) files;
netcontains the main networking code such as sup-port for sockets and TCP/IP (code for particular net-working cards is contained in thedrivers/net sub-system);
fscontains support for various kinds of file systems; initcontains the initialization code for the kernel; ipc contains the code for inter-process
communica-tions;
kernelcontains the main kernel code that is archi-tecture independent;
lib contains the (architecture independent) library code; and
mm contains the (architecture independent) memory management code.
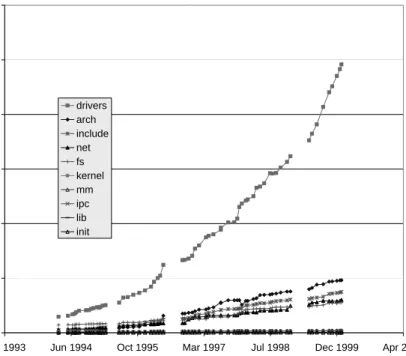
Figure 5 shows the growth of the major kernel subsys-tem. We can see immediately that thedriverssubsystem is not only the largest subsystem it is also the fastest grow-ing, with almost one million (uncommented) lines of code in the latest release. Figure 6 shows that this subsystem has grown steadily relative to the rest of the system to the point where it now comprises more than 60 percent of the total system.
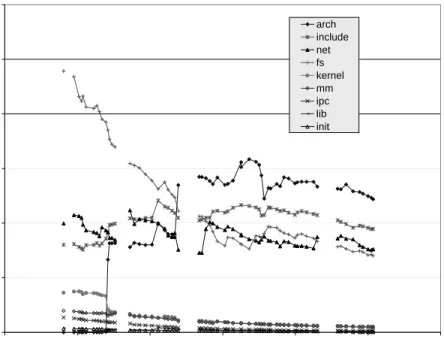
The size and growth rate of thedriverssubsystem ac-tually makes it difficult to see what has happened to the rest of the system in Fig. 5. Fig.7, therefore, shows the relative size of these subsystems as a percentage of the total sys-tem. We can see that thearch,include,net, andfs subsystems are significantly larger than the remaining five,
in January 1997 was mostly due to the addition of one very large device driver dot-h file for a network card.
0 100 200 300 400 500 600 700
Jan1993 Jun1994 Oct1995 Mar1997 Jul1998 Dec1999 Apr2001
Uncommented
LOC
Average.cfilesize--dev.releases Average.cfilesize--stablereleases Median.cfilesize--dev.releases Median.cfilesize--stablereleases
Figure 3. Median and average size of implementation files (“*.c”).
0 20 40 60 80 100 120 140
Jan1993 Jun1994 Oct1995 Mar1997 Jul1998 Dec1999 Apr2001
Uncommented
LOC
Average.hfilesize--dev.releases Average.hfilesize--stablereleases Median.hfilesize--dev.releases Median.hfilesize--stablereleases
0 200,000 400,000 600,000 800,000 1,000,000 1,200,000
Jan1993 Jun1994 Oct1995 Mar1997 Jul1998 Dec1999 Apr2001
Total uncommented LOC drivers arch include net fs kernel mm ipc lib init
Figure 5. Growth of the major subsystems (development releases only).
0.0 10.0 20.0 30.0 40.0 50.0 60.0 70.0
Jan1993 Jun1994 Oct1995 Mar1997 Jul1998 Dec1999 Apr2001
Percentage of total system uncommented LOC drivers arch include net fs kernel mm ipc lib init
0.0 5.0 10.0 15.0 20.0 25.0 30.0
Jan1993 Jun1994 Oct1995 Mar1997 Jul1998 Dec1999 Apr2001
Percentage of total system uncommented LOC arch include net fs kernel mm ipc lib init
Figure 7. Percentage of total system LOC for each major subsystems, ignoring thedrivers subsys-tem (development releases only).
and that these four have continued to grow at a rate that ap-pears to be linear or better. Figure 7 also shows that the fssubsystem has grown more slowly than the others, and its relative size as a percentage of the total kernel size has significantly decreased over time.
Figure 8 shows the growth rate of the five smallest sub-systems. We can see that whilekernelandmmare grow-ing steadily, these subsystems actually comprise a very small amount of code. However, these five subsystems are part of the core of the kernel; almost all of the code in these subsystems in included in kernel compilations regardless of the target hardware. Additionally, since operating system kernels are usually designed to be as small and compact as possible, undue growth in these core subsystems would probably be regarded as an unhealthy sign.
Figure 9 shows the growth of development releases of the sub-subsystems ofdrivers. The largest and fastest grow-ing isdrivers/netwhich contains driver code for net-work devices such as ethernet cards. The growth in this sub-system is a reflection of the number of network devices sup-ported by Linux, the relative complexity of creating drivers for them, and the fact that sometimes a lot of device-specific data must be stored in the source files. We note that the av-erage size of a source file in thedriverssubsystem for the most recent development kernel (2.3.39) was over 600
lines of code, which was the highest average among the ma-jor subsystems. Most of the sub-subsystems ofdrivers showed significant growth, a sign of the growing acceptance of Linux as more users desire to run it with many different makes of devices.
However, we note the growth and size of thedrivers subsystem distorts the idea of how large and complicated the Linux system is. First, the nature of a device driver is that it translates a common and well understood request into a task that a particular hardware device can execute efficiently. Device drivers are often quite large and com-plicated, but also relatively self-contained and independent of each other and of the rest of the system. Second, we note that while old hardware may die out, old drivers tend to live long lives, just in case some users still need them. Consequently, there is a large number of relatively unused (and relatively unmaintained) “legacy” drivers distributed with each kernel version. Finally, we note that even for cur-rent device drivers, most users tend to require only a few of the range of possible drivers. For example, the two largest driverssub-subsystems arenetandscsi, yet the vast majority of PCs are sold today without network or SCSI cards.
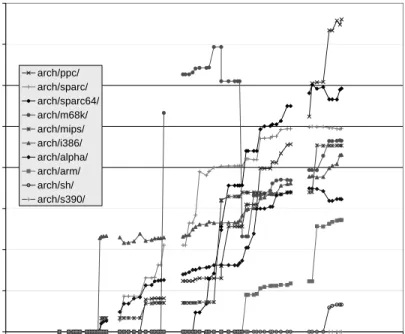
Figure 10 shows the shows the growth of development releases of the sub-subsystems ofarch, each of which
rep-0 1000 2000 3000 4000 5000 6000 7000 8000 9000
Jan1993 Jun1994 Oct1995 Mar1997 Jul1998 Dec1999 Apr2001
Total uncommented LOC kernel mm ipc lib init
Figure 8. Growth of the smaller, core subsystems (development releases only).
0 50,000 100,000 150,000 200,000 250,000 300,000
Jan1993 Jun1994 Oct1995 Mar1997 Jul1998 Dec1999 Apr2001
Total uncommented LOC drivers/net drivers/scsi drivers/char drivers/video drivers/isdn drivers/sound drivers/acorn drivers/block drivers/cdrom drivers/usb drivers/"others"
0 5,000 10,000 15,000 20,000 25,000 30,000 35,000 40,000
Jan1993 Jun1994 Oct1995 Mar1997 Jul1998 Dec1999 Apr2001
Total uncommented LOC arch/ppc/ arch/sparc/ arch/sparc64/ arch/m68k/ arch/mips/ arch/i386/ arch/alpha/ arch/arm/ arch/sh/ arch/s390/
Figure 10. Growth of thearchsubsystem (development releases only).
resents a major CPU/hardware architecture supported by Linux. What is most interesting here is the sudden upward leaps made by many of these subsystems. The first such leap occurred in early 1995, when it was decided to incor-porate support for the Alpha, Sparc, and Mips architectures into Linux, and which also led to code that was specific to the Intel 386 architecture being moved from the main kernelsubsystem intoarch/i386. Subsequent leaps in otherarchsub-subsystems have resulted from externally developed code being added in one large lump. In many cases, this architecture support is developed and maintained separately from the main Linux development kernel release by relatively independent teams of developers (and some-times by corporations). A common growth pattern for such a subsystem is for large jumps as major new revisions are added, followed by periods of relative stability involving only minor revisions and bug fixes.
7
Conclusions
The Linux operating system kernel is a very success-ful example of a large software system in widespread use that has been developed using an “open source” develop-ment (OSD) model. We have examined the growth of Linux over its six year lifespan using several metrics, and we have found that at the system level its growth has been super-linear. This strong growth rate seems surprising given (a)
its large size (over two million lines of code including com-ments and blank lines), (b) its development model (a highly collaborative and geographically distributed set of develop-ers, many of whom contributing their time and effort for free), and (c) previously published research that suggests that the growth of large software systems tends to slow down as the systems become larger [14, 4, 23].
We found that, as previously suggested by Gall et al. [4], it is useful to examine the growth patterns of the subsystems to gain a better understanding of how and why the system seems to have been able to evolve so successfully. We sug-gest further that a “black box” examination is not enough; one must investigate the nature of the subsystems and ex-plore their evolutionary patterns to gain an understanding of how and why the system as a whole has evolved. We found that while the entire source tree for Linux is quite large, more than half of the code consists of device drivers, which are relatively independent of each other; we found that a large part of the remaining system consists of parallel features that are specific to particular CPUs; and we found that the small, core kernel subsystems comprise only a small part of the full source tree. That is to say, the Linux oper-ating system kernel is not as large at it might seem since (based on our own experiments) any compiled version is likely to include only fifteen to fifty percent of the source files in the full source tree.
data point in the study of large software system evolution. We hope that this will encourage further investigation into the evolution of OSD software systems, as well as com-parisons with systems developed using more traditional ap-proaches.
8
Acknowledgments
We thank David Toman for providing several useful comments on the FreeBSD operating system, and we thank Hugh Chipman and Dale Schuurmans for help on statistical modelling.
References
[1] I. T. Bowman and R. C. Holt. Reconstructing ownership ar-chitectures to help understand software systems. In Proc.
of the 1999 IEEE Workshop on Program Comprehension (IWPC’99), Pittsburgh, PA, May 1999.
[2] I. T. Bowman, R. C. Holt, and N. V. Brewster. Linux as a case study: Its extracted software architecture. In Proc. of
the21 st
Intl. Conf. on Software Engineering (ICSE-21), Los
Angeles, CA, May 1999.
[3] S. G. Eick, T. L. Graves, A. F. Karr, J. S. Marron, and A. Mocku. Does code decay? Assessing the evidence from change management data. to appear in IEEE Trans. on
Soft-ware Engineering.
[4] H. Gall, M. Jazayeri, R. Kloesch, and G. Trausmuth. Soft-ware evolution observations based on product release his-tory. In Proc. of the 1997 Intl. Conf. on Software
Mainte-nance (ICSM’97), Bari, Italy, Oct 1997.
[5] D. Hiebert. The Exuberant CTAGS homepage. Website. http://home.HiWAAY.net/˜darren/ctags/.
[6] http://www.freebsd.org. The FreeBSD homepage. Website. [7] http://www.kernelnotes.org. kernelnotes.org: The official
website of Linux kernel information. Website.
[8] http://www.kernel.org. The Linux kernel archives. Website. [9] http://www.linux.org. The Linux homepage. Website.
[10] http://www.opensource.org. The open source homepage.
Website.
[11] http://www.vim.org. The VIM homepage. Website. [12] C. F. Kemerer and S. Slaughter. An empirical approach to
studying software evolution. IEEE Trans. on Software
Engi-neering, 25(4), July/August 1999.
[13] M. M. Lehman and L. A. Belady. Program Evolution:
Pro-cesses of Software Change. Academic Press, 1985.
[14] M. M. Lehman, D. E. Perry, and J. F. Ramil. Implications of evolution metrics on software maintenance. In Proc. of
the 1998 Intl. Conf. on Software Maintenance (ICSM’98),
Bethesda, Maryland, Nov 1998.
[15] M. M. Lehman, J. F. Ramil, P. D. Wernick, D. E. Perry, and W. M. Turski. Metrics and laws of software evolution — the nineties view. In Proc. of the Fourth Intl. Software Metrics
Symposium (Metrics’97), Albuquerque, NM, 1997.
[16] D. L. Parnas. Software aging. In Proc. of the16
th Intl. Conf. on Software Engineering (ICSE-16), Sorrento, Italy,
May 1994.
[17] D. E. Perry. Dimensions of software evolution. In Proc. of
the 1994 Intl. Conf. on Software Maintenance (ICSM’94),
1994.
[18] E. S. Raymond. The Cathedral and the Bazaar: Musings
on Linux and Open Source by an Accidental Revolutionary.
O’Reilly and Associates, Oct 1999.
[19] D. A. Rusling. The Linux Kernel. Website.
http://www.linuxhq.com/guides/TLK/tlk.html.
[20] C. Salzenberg. Topaz: Perl for the 22nd century.
http://www.perl.com/pub/1999/09/topaz.html.
[21] J. B. Tran, M. W. Godfrey, E. H. S. Lee, and R. C. Holt. Architecture analysis and repair of open source software. In
Proc. of 2000 Intl. Workshop on Program Comprehension (IWPC’00), Limerick, Ireland, June 2000.
[22] J. B. Tran and R. C. Holt. Forward and reverse repair of software architecture. In Proc. of CASCON 1999, Toronto, Nov 1999.
[23] W. M. Turski. Reference model for smooth growth of soft-ware systems. IEEE Trans. on Softsoft-ware Engineering, 22(8), Aug 1996.
[24] L. Vepstas. Linux on the IBM ESA/390 mainframe archi-tecture. Website. http://linas.org/linux/i370/i370.html.