A psychometric analysis of reliability and
validity of the index of learning styles (ILS)
Article
Published Version
Creative Commons: Attribution 4.0 (CCBY)
Open Access
AlAzawei, A., Parslow, P. and Lundqvist, K. (2015) A
psychometric analysis of reliability and validity of the index of
learning styles (ILS). International Journal of Psychological
Studies, 7 (3). pp. 4657. ISSN 1918722X doi:
https://doi.org/10.5539/ijps.v7n3p46 Available at
http://centaur.reading.ac.uk/45603/
It is advisable to refer to the publisher’s version if you intend to cite from the
work.
Published version at: http://dx.doi.org/10.5539/ijps.v7n3p46To link to this article DOI: http://dx.doi.org/10.5539/ijps.v7n3p46
Publisher: Canadian Center of Science and Education
All outputs in CentAUR are protected by Intellectual Property Rights law,
including copyright law. Copyright and IPR is retained by the creators or other
copyright holders. Terms and conditions for use of this material are defined in
the
End User Agreement
.
www.reading.ac.uk/centaur
CentAUR
International Journal of Psychological Studies; Vol. 7, No. 3; 2015 ISSN 1918-7211 E-ISSN 1918-722X Published by Canadian Center of Science and Education
A Psychometric Analysis of Reliability and Validity of the Index of
Learning Styles (ILS)
Ahmed Al-Azawei1,2, Patrick Parslow1 & Karsten Lundqvist1 1 School of Systems Engineering, University of Reading, Reading, UK
2 College of Information Technology, University of Babylon, Babel, Iraq
Correspondence: Ahmed Al-Azawei, School of Systems Engineering, University of Reading, Whiteknights, PO Box 217, Reading, Berkshire, RG6 6AH, United Kingdom. E-mail: [email protected]
Received: April 30, 2015 Accepted: June 23, 2015 Online Published: August 12, 2015 doi:10.5539/ijps.v7n3p46 URL: http://dx.doi.org/10.5539/ijps.v7n3p46
Abstract
Prior literature showed that Felder and Silverman learning styles model (FSLSM) was widely adopted to cater to individual styles of learners whether in traditional or Technology Enhanced Learning (TEL). In order to infer this model, the Index of Learning Styles (ILS) instrument was proposed. This research aims to analyse the soundness of this instrument in an Arabic sample. Data were integrated from different courses and years. A total of 259 engineering students participated voluntarily in the study. The reliability was analysed by applying internal construct reliability, inter-scale correlation, and total item correlation. The construct validity was also considered by running factor analysis. The overall results indicated that the reliability and validity of perception and input dimensions were moderately supported, whereas processing and understanding dimensions showed low internal-construct consistency and their items were weakly loaded in the associated constructs. Generally, the instrument needs further effort to improve its soundness. However, considering the consistency of the produced results of engineering students irrespective of cross-cultural differences, it can be adopted to diagnose learning styles.
Keywords: The Index of Learning Styles (ILS), reliability, validity, Arabic population
1. Introduction
Psychologists have proposed several learning style models to meet individual needs of learners, connect teaching and learning styles, and avoid using a “one-size-fits-all” teaching approach (Felder & Silverman, 1988; Kolb, 1984; Riding & Cheema, 1991). Learning styles was defined as “characteristic strengths and preferences in the ways they ‘learner’ take in and process information” (Felder, 1996). The main assumption of learning styles theory is that ignoring individual styles may lead to dropping a course, learner dissatisfaction, and low achievement (Felder & Brent, 2005). On the other hand, empirical studies have not produced conclusive evidence either to confirm or to refute the value of learning styles (Al-Azawei & Lundqvist, 2015; Mayer, 2011). Furthermore, learning styles research is limited by the absence of a valid and reliable measurement to identify this psychological trait (Coffield, Moseley, Hall, & Ecclestone, 2004).
Although several learning style models have been proposed, recent studies indicated that the Felder and Silverman model (Felder & Silverman, 1988) is one of the most dominant learning styles in the area of TEL (Akbulut & Cardak, 2012; Al-Azawei & Badii, 2014; Graf, Viola, & Leo, 2007). This model classifies learning styles into four dichotomies.
The processing (active/reflective) dimension represents information processing. The active pole means that a learner tends to do something physically and work with group, whereas reflective refers to a learner who prefers to apply analytical approach.
The perception (sensing/intuitive) dimension represents information perceiving. A learner with a sensing style tends to use his/her senses and prefers facts. An intuitive learner prefers abstract materials and uses innovative approaches in problem solving.
The input (visual/verbal) dimension refers to information receiving. A learner associated with a visual pole prefers pictorial materials such as pictures, video, animation, flowcharts and so on. A verbal learner tends to prefer written materials or listen to explanation of others.
The understanding (sequential/global) dimension represents information understanding. The first pole (sequential) means that a learner uses a step by step learning method and cares about all details. Another pole (global), in contrast, includes a learner who tends to make leaps in studying to understand the general picture before looking to details.
In order to infer learning styles in accordance with this model, Felder and Soloman (n.d.) proposed the Index of Learning Styles (ILS). However, there are contradictory findings regarding the reliability and validity of this instrument. Additionally, our systematic review did not show that the appropriateness of the ILS was proven in an Arabic engineering population. Hence, this research pursues two aims. Firstly, it contributes to the debate with regard to the soundness of the ILS. Secondly, it aims to overcome the limitation and scarcity in the existing evidence about the appropriateness of the instrument for inferring learning styles in an Arabic engineering sample. As such, we hypothesised that:
1) The ILS is a reliable and valid instrument to infer learning styles in Arabic engineering students.
2) The reliability and validity of some dimensions of the ILS will not be supported to infer learning styles in Arabic engineering students.
The research is structured as follows. Section 2 highlights the findings of related work. Subsequently, Section 3 introduces the methodology of this research. Section 4 illustrates the core results of the study and discusses the findings. Finally, Section 5 concludes the research and identifies the potential future work.
2. Literature Review
Recent studies suggest deducing learning styles implicitly in order to avoid the critique with regard to the reliability and validity of psychometric instruments and direct intervention of users (Graf, 2007; Latham, Crockett, & McLean, 2014). However, to evaluate the accuracy of obtaining results or to initialise student models in such a way require the use of an instrument. Hence, one important issue that has to be addressed is the reliability and validity of learning style measurements and this should be the first step. Reliability means how a scale is free from random error. Construct-internal consistency is widely used to measure reliability. It means that all items that make up the scale should measure “the same underlying attribute”. Cronbach’s coefficient alpha represents the most commonly applied indicator to measure internal-consistency. The nature and the purpose of the scale represent the base of adopting the level of reliability. Generally, equal to or above 0.7 is recommended as a minimum level of Cronbach’s alpha (Pallant, 2013). However, other researchers suggests that this level was recommended for achievement tests, whereas above 0.5 level is an acceptable for attitude tests (Tuckman, 1999 as cited in Zywno (2003)). In this research the recommendation of Tuckman was adopted because it analyses a psychological instrument. Validity, on the other hand, expresses how well an instrument measures the attributes it is designed to measure (Pallant, 2013).
Van Zwanenberg, Wilkinson and Anderson (2000) compared the ILS and Honey and Mumford’s Learning Styles Questionnaire (LSQ). A total of 284 engineers 139 and managers 145 participated in the study. A standard minimum of alpha of 0.80 was adopted. Accordingly, the reliability of the ILS was not supported in the study. However, by considering the alpha of 0.5 is acceptable for attitude tests, the internal consistency of the ILS can be advocated except for the sequential/global dimension because the alpha was 0.41. In addition, a significant correlation was found between sensing/intuitive and sequential/global dimensions.
In Zywno (2003), a total of 557 undergraduate students at Ryerson University, Toronto, Canada participated to contribute to the validation of the ILS. In order to prove the reliability of the instrument, test-retest, Cronbach’s alpha and factor analysis tests were used. Results showed an acceptable level of reliability by adopting a minimum alpha of 0.50. Furthermore, because of the integration of data from several academic years (2000 to 2002), ANOVA tests were applied, revealing that there was no statistical difference in the mean of the scales in the consecutive years. A comparison with the results of other studies indicated that the most dominant styles of the engineering population in different countries are active, sensing, visual and sequential. This leads to support the convergent validity of the ILS. However, more investigation was recommended.
Felder and Spurlin (2005) surveyed many studies that dealt with the reliability and validity of the ILS. According to their conclusion, the questionnaire was proven for engineering samples in four countries and ten universities based on English population. The test-retest results were from 0.7 to 0.90 in all investigated studies and the Cronbach’s alphas were acceptable based on the criterion value of 0.50.
Cook and Smith (2006) compared between four instruments of learning styles in terms of reliability and validity. One of these instruments was the ILS. The participants were residents and medical students 89. Overall, the active/reflective and sensing/intuitive dimensions were validated. Furthermore, the test-retest reliability showed
www.ccsenet.org/ijps International Journal of Psychological Studies Vol. 7, No. 3; 2015
that all dimensions are either at a good or an acceptable level of reliability. Participants were also requested to indicate their level of agreement regarding the identified styles. The responses revealed their satisfaction with the inferred styles as well as the ease of using the questionnaire. Thus, more support to the instrument was provided. However, a significant correlation was found between sensing/intuitive and sequential/global dimensions. This leads to suggesting further research.
Platsidou and Metallidou (2009) investigated the reliability and validity of two learning styles instruments, the ILS and the Kolb’s Learning Styles Inventory (LSI). The instruments were distributed to a total of 340 undergraduate students in Greek university from different disciplines. Researchers concluded that the internal consistency of most of the learning styles dimensions were poor or moderate.
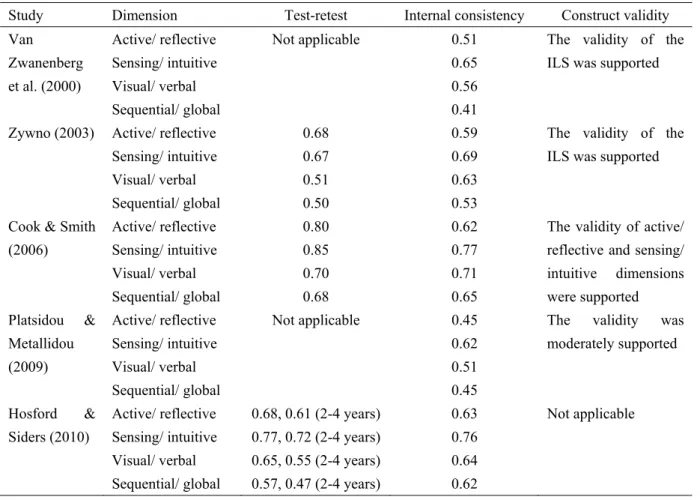
To examine the suitability of the ILS for undergraduate medical students, a total of 358 participants filled in the ILS from 2002 to 2007 (Hosford & Siders, 2010). Generally, the results supported the internal consistency of the measurement and the test-retest analyses showed moderate to high stability for the difference of administrations of two and four years. As with other studies, a significant correlation between perceiving and understanding dimensions was shown. Table 1 summarises the results of the above discussed studies.
To sum up, most of the related works recommend more investigation of the reliability and validity of this instrument. Further, to the best of the authors’ knowledge, it has not confirmed with an Arabic engineering population. Only the study of Cook and Smith (2006) incorporated 2 Arabic students which represent approximately 2% of the total sample. Hence, this study contributes to provide evidence about the validity and reliability of this instrument for such population.
Table 1. Summary of the findings of previous studies
Study Dimension Test-retest Internal consistency Construct validity
Van Zwanenberg et al. (2000) Active/ reflective Sensing/ intuitive Visual/ verbal Sequential/ global Not applicable 0.51 0.65 0.56 0.41
The validity of the ILS was supported
Zywno (2003) Active/ reflective Sensing/ intuitive Visual/ verbal Sequential/ global 0.68 0.67 0.51 0.50 0.59 0.69 0.63 0.53
The validity of the ILS was supported
Cook & Smith (2006) Active/ reflective Sensing/ intuitive Visual/ verbal Sequential/ global 0.80 0.85 0.70 0.68 0.62 0.77 0.71 0.65
The validity of active/ reflective and sensing/ intuitive dimensions were supported Platsidou & Metallidou (2009) Active/ reflective Sensing/ intuitive Visual/ verbal Sequential/ global Not applicable 0.45 0.62 0.51 0.45
The validity was moderately supported Hosford & Siders (2010) Active/ reflective Sensing/ intuitive Visual/ verbal Sequential/ global 0.68, 0.61 (2-4 years) 0.77, 0.72 (2-4 years) 0.65, 0.55 (2-4 years) 0.57, 0.47 (2-4 years) 0.63 0.76 0.64 0.62 Not applicable 3. Methodology
Ethics approval was sought, and obtained, using the procedures laid down by the Ethics Committee at the University of Reading.
3.1 Participants
The ILS questionnaires were deployed at the University of Babylon in Iraq and in an online course. The participation of students was voluntary and some lecturers encouraged their students to participate in the form of extra marks. Data were collected from different courses at the College of Information Technology during 2013-2014, 2014-2015 academic years and from learners who participated in a voluntary online course. All subjects gave consent to participate in the study. The number of females is 136 (52.5 %), whereas the number of males is 123 (47.5 %). The age group of the majority of them ranged from 18 to 22.
3.2 Instrument
The ILS is a free questionnaire to measure learning styles in accordance with Felder and Silverman model (Felder & Silverman, 1988). The instrument was proposed specifically for engineering population. It consists of 44 forced-choice questions where students have to choose either (a) or (b), for example:
1). I understand something better after I (a) try it out.
(b) think it through.
Eleven questions are asked to infer each dimension. The authors suggest using only odd numbers ranging from -1 to -11 and 1 to 11 and in increments of 2, for instance, (-11, -9, -7 …., 7, 9, 11) in order to diagnose mild (1, 3), moderate (5, 7) and strong styles (9, 11) (Felder & Soloman, n.d.).
In this research, authors provided a general explanation about the aim of the study, guaranteeing that all personal information will confidentially be manipulated, and data will be used for the purpose of research only. The instrument consists of the following parts:
Demographic information: The first part identifies demographic information of participants.
The ILS: The second part includes the ILS items. All questions were translated into Arabic language in order to simplify understanding of questions. The translation was confirmed by two experts.
A closed-ended question: a 7-point Likert scale ranging from 1 (strongly disagree) to 7 (strongly agree)
question was used to identify the ease of the questionnaire and the clarity of questions. The question is “I found that it is easy to understand questions and answer them”.
The instrument was administered online to facilitate data collection. In order to avoid missing values and receiving invalid questionnaires, all items were identified as required. Therefore, students cannot submit their response until filling them all in. The obtained scores of the ILS showed that the commonly adopted styles were active (N = 173, 66.8 %), sensing (N = 198, 76.44 %), visual (N = 206, 79.53 %), and sequential (N = 156, 60.23 %).
3.3 Procedure
The questionnaire was administrated via the announcement page of Moodle and email during different academic years. The administrations were in February 2014 for first year students in a Fundamentals of Programming Language (FPL) course, December 2014 for students in an online Web Design course and finally, in March 2015 for all students in the college of Information Technology including some students who participated in the FPL and online courses to conduct test-retest reliability. However, only 19 students have participated twice. This leads to the exclusion of test-retest analysis from the study.
Van Zwanenberg et al. (2000) stated that one of the issues of dichotomous nature of scales is the difficulty of use standard statistic tests. Hence, they suggested assigning a value of 1 to (a) questions and 0 to (b) questions. This binary approach was adopted in our study. Means of the opposite poles can be computed as a complement of 11, for example, if the mean value of visual pole is 7.5, the mean value of verbal pole is 3.5.
3.4 Analysis Techniques
Statistical analysis was conducted by using SPSS (Statistic Package for Social Science) version 22 for Windows 7. Several analyses were applied to include descriptive and inferential statistics. These comprise means (M),
standard deviation (SD), frequency, Pearson’s coefficient correlation, inter-scale correlation, total item
correlation, MANOVA test, Cronbach’s alpha and factor analysis.
4. Results and Discussion
Between January 2014 and March 2015, 259 engineering students consented to participate in this study. The investigation did not show any statistical significance between gender and three dimensions of learning styles as
www.ccsenet.org/ijps International Journal of Psychological Studies Vol. 7, No. 3; 2015
presented in Table 2. A significant correlation was found only in the perception dimension. Female students were more likely to prefer sensing style rather than intuitive (81.61%).
Further analysis was conducted to reveal the ease of understanding the 44 items by accounting the mean value of the ended-closed question. The mean score was 5.15 to indicate a good level of overall understanding and ease of answering the questions. The clarity is a very important factor to succeed using such instruments because students are unwilling to continue answering unclear or ambiguous questions.
Table 2. The relationship between learning styles and gender (MANOVA test) Male = 123, Female = 136 Gender M SD MANOVA Active Male 6.33 1.973 F = 0.47, P = 0.45 Female 6.15 2.02 Sensing Male 6.37 2.11 F = 16.51, P < 0.001 Female 7.47 2.24 Visual Male 7.51 2.20 F = 0.98, P = 0.32 Female 7.24 2.28 Sequential Male 5.86 2.08 F = 2.65, P = 0.10 Female 6.27 1.97 4.1 Internal Consistency
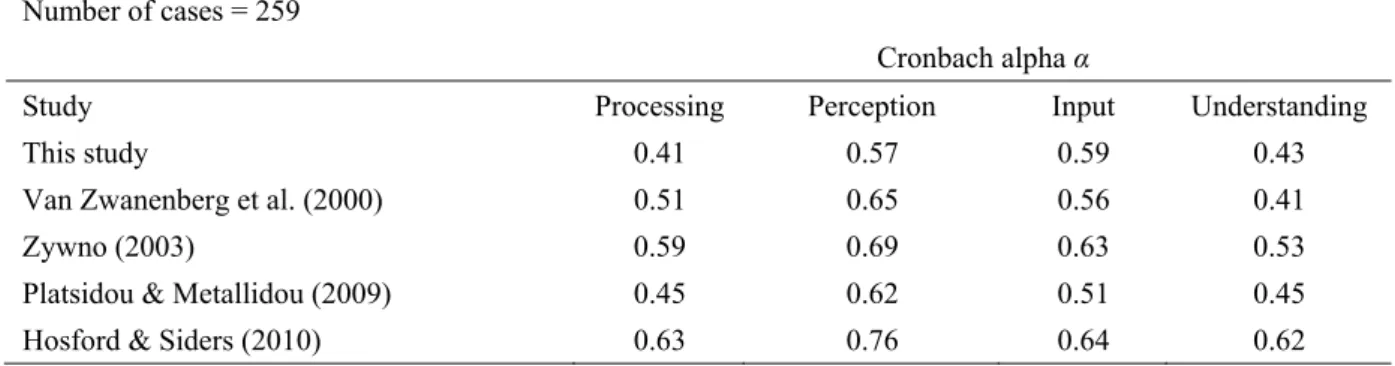
The internal consistency reliability was conducted for all “a” items. Two dimensions (sensing/intuitive and visual/verbal) met the minimum acceptable level of Cronbach’s alpha of 0.50. This result is in agreement with the findings of literature, for example, Platsidou and Metallidou (2009); Van Zwanenberg et al. (2000) and Zywno (2003). However, the internal consistency of active/reflective and sequential/global dimensions was not supported. This cannot be accounted to the translation of the instrument because it was carefully translated to keep the same meaning of the English version and approved by two experts. This interpretation can be advocated by comparing the overall result with prior literature to show that it was symmetric. In the study of Platsidou and Metallidou (2009), the alpha values of these dichotomies were 0.45, which is consistent with our study. Literature showed, as in this research, that the sensing/intuitive and visual/verbal dimensions achieved the highest internal consistency.
The alpha values of deleted items were also investigated to determine whether the internal consistency may be improved if some items are deleted. Item 17 was the only one which can affect the alpha value of active/reflective dimension to be 0.45 instead of 0.41. However, the ILS was designed to force learners to fall in one of the bipolar and if both options seem to apply to their preferences, they have to choose “the one that applies more frequently”. This design does not allow choosing a zero preference. As such, it cannot be recommended to delete an item. However, it can be revised to improve the psychometric properties of the instrument. Table 3 depicts the Cronbach’s alpha values and compares them with related works.
Table 3. Internal consistency of the four dimensions (“a” items) Number of cases = 259
Cronbach alpha α
Study Processing Perception Input Understanding
This study 0.41 0.57 0.59 0.43
Van Zwanenberg et al. (2000) 0.51 0.65 0.56 0.41
Zywno (2003) 0.59 0.69 0.63 0.53
Platsidou & Metallidou (2009) 0.45 0.62 0.51 0.45
4.2 Inter-Scale Correlation
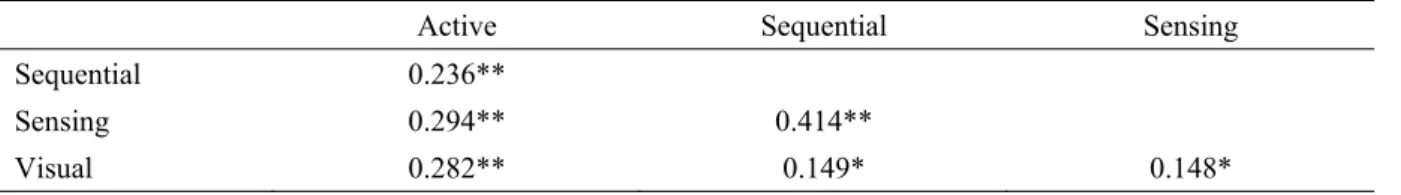
For further investigation, the Pearson’s coefficient correlation was used to test the inter-scale correlation (Table 4). Although results showed a significant correlation among dimensions, it was mild and the strongest moderate correlation is between sensing/intuitive and sequential/global (r = 0.414). This result is consistent with the findings of Van Zwanenberg et al. (2000) and Cook and Smith (2006). Such correlation would seem obvious because the “sensing” and “sequential” learner ends of those spectra rely on small discrete steps and quantised data/knowledge.
Table 4. Pearson’s correlation coefficient between scale scores on the ILS
Active Sequential Sensing
Sequential 0.236**
Sensing 0.294** 0.414**
Visual 0.282** 0.149* 0.148*
**. Correlation is significant at the 0.01 level (2-tailed). *. Correlation is significant at the 0.05 level (2-tailed).
4.3 Construct Validity
Factor analysis was conducted to test the construct validity of the instrument. According to Pallant (2013), two criteria have to be considered in order to ensure the suitability of data for factor analysis test:
Sample size: 150 cases are identified as the smallest sample size to conduct this test. However, there is a correlation between number of cases and items. Hence, 5 cases were recommended for each item (variable).
The strength of the relationship among items: the correlation matrix should show at least 0.3 correlations between some items. Bartlett’s test of sphericity and the Kaiser-Meyer-Olkin (KMO) are two statistical measures to assess the factorability of the data. The former test should be significant at p less or equal 0.05. The latter ranges from 0 to 1 and it should be at least 0.6 as a minimum value.
Our data met both criteria because more than 5 cases were available for each item (44 items and 259 cases). Furthermore, the KMO was 0.615 and the Bartlett’s test of sphericity was significant at p less than 0.001 level. Thus, the factorability of the correlation matrix was supported.
Although the Principle Components Analysis (PCA) showed the presence of 17 factors to explain 61.91% of variance, 8 factors, 5 factors, and 4 factors models were examined. The 8 and 5 factors explained 37.69% and 27% of the total variance respectively, but they did not adequately fit. Factors 1, 2, 3 and 4 loaded the most items of the four scales, whereas other factors indicated an overlap between dimensions to show a weak effect on the model. The “scree plot” of eigenvalues as depicted in Figure 1 was also used. It clearly depicts a smooth decrease in eigenvalues after factor 4.
www.ccsenet.org/ijps International Journal of Psychological Studies Vol. 7, No. 3; 2015
The 4 factors model showed that eight items of sensing/intuitive dimension and nine items of visual/verbal dimension were loaded greater than 0.3 on factors 1 and 2 respectively. This confirms the validity of these two dimensions and supports the literature (Hosford & Siders, 2010; Litzinger, Lee, Wise, & Felder, 2005; Platsidou & Metallidou, 2009; Zywno, 2003). Even though seven items of active/reflective and ten items of sequential/global dimensions were loaded on the third and fourth factors respectively, only five and three items were loaded greater than 0.3 for both dimensions. Factor 4 loaded one item of active/reflective more highly than in factor 3, whereas six items were loaded in factors 1 and 3 of sequential/global more highly than in factor 4. The finding is not in agreement with some literature, for instance, in Hosford and Siders (2010) factors 3 and 4 loaded nine items greater than 0.3 of understanding and processing dimensions respectively. In Zywno (2003), factors 3 and 5 loaded seven and six items of processing and understanding dimensions greater than 0.3. This means that the convergent and discriminant validity of processing and understanding dimensions were not advocated because some items were loaded in their associated factors less than in other constructs. The model as presented in Table 5 assumes that two dimensions of FSLSM were moderately well structured. However, the 4 factors model explained only 23.18 % of the total variance and some items were weakly loaded or exhibited a misfit.
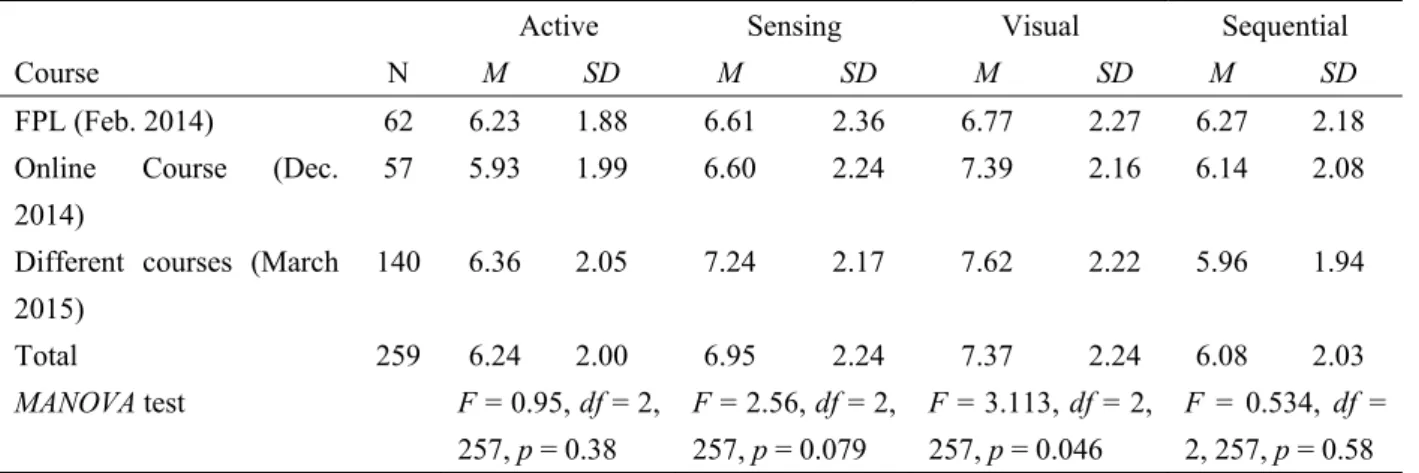
In the next step, more investigation was conducted to explore the consistency of results of the integrated groups and compare them with other studies. Table 6 shows that there are no statistical significance differences between mean scores of the three groups (FPL, online course, and several courses), except for the visual pole where the p value equal 0.046. Furthermore, the most reoccurring styles for engineering students were active, sensing, visual, and sequential. As discussed by Felder and Silverman (1988), engineering students are more likely to be active, sensing, and visual. It was also stated that the most creative learners are global. The study corroborates literature as presented in Table 7. This can support the ILS because it shows similar styles for engineering learners irrespective of cultural differences and other characteristics of investigated populations. It could be noticed that even with a small sample such as in Franzoni and Assar (2008), the dominant preferences of engineering students are similar. Additionally, convergent validity is established if composite reliability (CR) exceeds 0.7. Table 8 depicts that input and perception dimensions achieved the acceptable score to support convergent validity, whereas other dimensions did not.
With regard to the “discriminant validity”, Fornell and Larcker (1981) stated that this validity can be established if the variance shared between a factor and any other variables is less than the variance that a factor shares with its own variables. As shown in Table 8, the discriminant validity of perception and input constructs was
supported as well. Furthermore, Platsidou and Metallidou (2009) carried out MANOVA tests to examine the
learning styles differences of students from four disciplines (in-service teachers, education students, psychology students and polytechnic students). The effect of discipline was significantly shown in active/reflective and visual/verbal dimensions where the p values were 0.039 and 0.003 for both dimensions respectively. Based on the analysis, they concluded that the discriminant validity of the instrument can get some support.
Table 5. Principle component analysis (Four factor solution)
Factors Item 1 2 3 4 Active/ Reflect ive ProcessingQ1 .408 .285 -.250 ProcessingQ5 .173 ProcessingQ9 -.268 .191 .275 ProcessingQ13 .105 .378 ProcessingQ17 -.237 .359 ProcessingQ21 .182 .542 -.166 ProcessingQ25 .208 .174 ProcessingQ29 .531 .240 ProcessingQ33 .260 .316 ProcessingQ37 .375
ProcessingQ41 .192 .518 Sen si ng / In tu itiv e PerceptionQ2 .391 .381 PerceptionQ6 .597 PerceptionQ10 .371 -.244 PerceptionQ14 .545 -.164 .159 PerceptionQ18 .316 .182 -.194 PerceptionQ22 .341 .118 .369 PerceptionQ26 .250 .147 .109 .226 PerceptionQ30 .381 .140 .139 PerceptionQ34 .424 .292 PerceptionQ38 .504 .194 PerceptionQ42 .240 .132 .269 Visual/ Ver bal InputQ3 .329 -.108 -.118 InputQ7 .552 -.133 -.174 InputQ11 .556 .108 InputQ15 .396 .203 -.100 InputQ19 .380 .211 InputQ23 -.143 .549 -.125 .255 InputQ27 .128 .484 InputQ31 .596 .305 InputQ35 .148 .439 InputQ39 .424 InputQ43 .229 .171 Sequ en tial/ Gl ob al UnderstandingQ4 -.249 .103 .441 UnderstandingQ8 .225 UnderstandingQ12 -.138 .192 -.281 .497 UnderstandingQ16 .109 .252 .136 UnderstandingQ20 .376 .382 .245 UnderstandingQ24 .140 .145 .487 UnderstandingQ28 .104 .275 UnderstandingQ32 .259 .106 .129 UnderstandingQ36 .301 .384 UnderstandingQ40 .391 .176 .280 UnderstandingQ44 .210 .285 .385 .198 Variance % 7.158 6.213 5.297 4.516
Rotation Method: Varimax with Kaiser Normalization. Rotation converged in 9 iterations.
www.ccsenet.org/ijps International Journal of Psychological Studies Vol. 7, No. 3; 2015
Table 6. A comparison of the ILS scores dimensions of the three groups (MANOVA test)
Active Sensing Visual Sequential
Course N M SD M SD M SD M SD
FPL (Feb. 2014) 62 6.23 1.88 6.61 2.36 6.77 2.27 6.27 2.18
Online Course (Dec. 2014)
57 5.93 1.99 6.60 2.24 7.39 2.16 6.14 2.08 Different courses (March
2015) 140 6.36 2.05 7.24 2.17 7.62 2.22 5.96 1.94 Total 259 6.24 2.00 6.95 2.24 7.37 2.24 6.08 2.03 MANOVA test F = 0.95, df = 2, 257, p = 0.38 F = 2.56, df = 2, 257, p = 0.079 F = 3.113, df = 2, 257, p = 0.046 F = 0.534, df = 2, 257, p = 0.58 Table 7. A comparison of learning styles preferences of engineering students
Study N Active Sensing Visual Sequential
Iraq: this study 259 66.79% 76.44% 79.53% 60.23%
UK: Van Zwanenberg et al. (2000) 135 Y* Y* Y* Y*
Brazil: Kuri & Truzzi (2002) 351 60% 74% 79% 50%
Canada: Zywno (2003) 338 61% 65% 88% 63%
United States: Litzinger et al. (2005) 235 Y* Y* Y* Y*
México: Franzoni & Assar (2008) 26 62% 62% 85% 62%
UK: Prajapati, Dunne, Bartlett, & Cubbidge (2011)
360 Y* Y* Y* Y*
China: Fang & Zhao (2013) 71 55% 80% 76% 54%
* The percentages were not explicitly provided in these studies; however, authors indicated that the most
reoccurring styles were active, sensing, visual, and sequential. Table 8. Composite reliability (CR) and discriminant validity
Discriminant validity
CR>=0.7 Input Perception Processing Understanding
Input 0.697 0.423
Perception 0.705 0.281 0.440 Processing 0.541 0.398 0.443 0.339
Understanding 0.495 0.221 0.479 0.431 0.386
Based on the overall analysis, on the one hand, the first hypothesis was rejected because results of reliability and validity showed that the internal consistency of two dimensions (processing and understanding) were less than the minimum acceptable level of alpha for attitude tests and could not suitability be loaded in factor analysis. Though the correlation between all dimensions was trivial or mild, an overlap was found, specifically, between perception and understanding dichotomies. On the other hand, reliability and validity of other dimensions (perception and input) were moderately supported to indicate that it is to some extent suitable to infer learning styles according to this model. However, a revision to unsupported dimensions can enhance their internal consistency reliability and construct validity. To sum up, the most reliable and valid dimensions in the instrument are perception and input because both met the acceptable level of reliability and validity. In prior studies, these dimensions also achieved better results than others to confirm our conclusion. Thus, the second hypothesis was retained.
The contribution of this study is twofold. First, the ILS produces consistent results regardless of cross-cultural differences. As presented in the comparison of engineering students’ styles, all of them have particular preferences, more specifically, active, sensing, visual, and sequential. Second, it contributes to fill the gap about the appropriateness of the instrument to infer learning styles of Arabic engineering learners to show that it can be adopted in order to achieve this goal by considering the consistency of the produced results of learning styles of engineering students regardless of the cross-cultural differences.
Some limitations have to be highlighted. First, the sample was homogenous. Although it was sufficient to represent the population, it shared very similar characteristics. Second, larger population and test-retest examination can provide more reliable results that can be generalised. Hence, further research is recommended to overcome the limitation of this study.
5. Conclusion
Learning styles theory has been integrated in different learning modes in order to improve the experience of learners in terms of satisfaction and performance. However, it is widely criticised. One issue which has led to such debates is the reliability and validity of the proposed psychometric instruments to infer learning styles. Accordingly, this research was motivated, specifically, because of the scarcity of studies to investigate the appropriateness of the ILS in an Arabic engineering population. Another reason is the contradictory findings of related research in other populations. Overall results stated that the ILS produces similar results regardless of cultural differences of engineering samples to be the core contribution of the study as well as supporting the existing evidence with regard to the psychometric properties of the instrument. The investigation of reliability included internal consistency, inter-scale correlation, and total item correlation. The internal consistency of two dimensions was moderately accepted at value greater than 0.50. Furthermore, a weak overlap was revealed between dichotomies of the FSLSM. However, the strongest correlation was found between sensing/intuitive and sequential/global dimensions to contribute literature. Factor analysis, convergent, and discriminant validities were identical with the result of internal consistency to show that perception and input dimensions were moderately well defined. Although other dimensions did not show an acceptable level of reliability and validity, the consistency of findings with literature can moderately support the use of ILS.
The ILS has been dominant in recent years to adapt learning environments in accordance with learning styles. However, the concern regarding the soundness of the proposed psychological instruments to diagnose learning styles could not be refuted even with such a common instrument. Two dimensions of the instrument were supported. By considering the result of the study and comparing it with the reported literature, we can moderately support the overall properties of the ILS. In addition, participants were satisfied regarding the clarity of items and the ease of completing the questionnaire. Further effort on the instrument can assist to enhance its psychometric properties. In the future, a heterogeneous sample and data from different disciplines and universities will be integrated to get more robust results.
Acknowledgments
Authors are grateful to the Iraqi Ministry of Higher Education for sponsoring this research. They would also like to thank Mr. Haider M. Habeeb at the University of Babylon for his kind help during conducting the study.
References
Akbulut, Y., & Cardak, C. S. (2012). Adaptive educational hypermedia accommodating learning styles: A content
analysis of publications from 2000 to 2011. Computers & Education, 58(2), 835-842.
http://dx.doi.org/10.1016/j.compedu.2011.10.008
Al-Azawei, A., & Badii, A. (2014). State of The Art of Learning Styles-Based Adaptive Educational Hypermedia Systems ( LS-BAEHSs). International Journal of Computer Science and Information Technology, 6(3), 1-19. http://dx.doi.org/10.5121/ijcsit.2014.6301
Al-Azawei, A., & Lundqvist, K. (2015). Which Factors Affect Learner Achievement? Analysing the Role of
Psychological , Surface Level, Environmental and Learner Effort Variables. International Journal of
Education, 7(2), 215-231. http://dx.doi.org/10.5296/ije.v7i2.7433
Coffield, F., Moseley, D., Hall, E., & Ecclestone, K. (2004). Learning styles and pedagogy in post-16 learning: A systematic and critical review. The Learning and Skills Research Centre.
Cook, D. a., & Smith, A. J. (2006). Validity of index of learning styles scores: Multitrait-multimethod comparison
with three cognitive/learning style instruments. Medical Education, 40, 900-907.
www.ccsenet.org/ijps International Journal of Psychological Studies Vol. 7, No. 3; 2015
Fang, N., & Zhao, X. (2013). A comparative study of learning style preferences between American and Chinese
undergraduate engineering students. 2013 IEEE Frontiers in Education Conference (FIE), 1704-1705.
http://dx.doi.org/10.1109/FIE.2013.6685128
Felder, R. (1996). Matters of style. ASEE Prism, 6(4), 18-23.
Felder, R., & Brent, R. (2005). Understanding student differences. Journal of Engineering Education, 94(1), 57-72. http://dx.doi.org/10.1002/j.2168-9830.2005.tb00829.x
Felder, R. M., & Soloman, B. A. (n.d.). Index of Learning Styles. Retrieved from
http://www.engr.ncsu.edu/learningstyles/ilsweb.html
Felder, R., & Silverman, L. (1988). Learning and teaching styles in engineering education. Engineering Education,
78(June), 674-681.
Felder, R., & Spurlin, J. (2005). Applications, reliability and validity of the index of learning styles. International Journal of Engineering Education, 21(1).
Franzoni, A., & Assar, S. (2008). Student learning styles adaptation method based on teaching strategies and
electronic media. In Advanced Learning Technologies, 2008. ICALT’08. Eighth IEEE International
Conference on (pp. 778-782). IEEE. http://dx.doi.org/10.1109/ICALT.2008.149
Fornell, C., & Larcker, D. F. (1981). Evaluating Structural Equation Models with Unobservable Variables and Measurement Error. Journal of Marketing Research (JMR), 18(1), 39-50. http://10.2307/3151312
Graf, S. (2007). Adaptivity in learning management systems focussing on learning styles (PhD Dissertation, December 2007).
Graf, S., Viola, S. R., & Leo, T. (2007). In-Depth Analysis of the Felder-Silverman Learning Style Dimensions.
Journal of Research on Technology in Education, 40(1), 79-93. http://dx.doi.org/10.1080/15391523.2007.10782498
Hosford, C. C., & Siders, W. a. (2010). Felder-Soloman’s Index of Learning Styles: Internal consistency, temporal
stability, and factor structure. Teaching and Learning in Medicine, 22(March 2015), 298-303.
http://dx.doi.org/10.1080/10401334.2010.512832
Kolb, D. (1984). Experiential learning: Experience as the source of learning and development. Englewood Cliffs, N.J.: Prentice-Hall.
Kuri, N. P., & Truzzi, S. (2002). Learning Styles of Freshmen Engineering Students (pp. 8-12). Proc UICEE Annual Conference on Engineering Education, UNESCO International Centre for Engineering Education. Latham, A., Crockett, K., & McLean, D. (2014). An adaptation algorithm for an intelligent natural language
tutoring system. Computers & Education, 71, 97-110. http://dx.doi.org/10.1016/j.compedu.2013.09.014 Litzinger, T., Lee, S., Wise, J., & Felder, R. M. (2005). A study of the reliability and validity of the
Felder-Soloman Index of Learning Styles. Education, 113(77).
Mayer, R. E. (2011). Does styles research have useful implications for educational practice? Learning and
Individual Differences, 21(3), 319-320. http://dx.doi.org/10.1016/j.lindif.2010.11.016
Pallant, J. (2013). SPSS Survival Manual: A step by step guide to data analysis using IBM SPSS (5th ed.).
McGrawHill.
Platsidou, M., & Metallidou, P. (2009). Validity and reliability issues of two learning style inventories in a Greek aample: Kolb’s Learning Style Inventory and Felder & Soloman’s Index of Learning. International Journal of Teaching and Learning in Higher Education, 20(3), 324-335.
Riding, R., & Cheema, I. (1991). Cognitive Styles—An overview and integration. Educational Psychology,
11(3-4), 193-215. http://dx.doi.org/10.1080/0144341910110301
Van Zwanenberg, N., Wilkinson, L. J., & Anderson, a. (2000). Felder and Silverman’s Index of Learning Styles and Honey and Mumford’s Learning Styles Questionnaire: How do they compare and do they predict
academic performance? Educational Psychology, 20(March 2015), 365-380.
http://dx.doi.org/10.1080/713663743
Zywno, M. (2003). A contribution to validation of score meaning for Felder-Soloman’s index of learning styles. In Proceedings of the 2003 American Society for Engineering Education Annual Conference & Exposition (Vol. 119, pp. 1-5).
Copyrights
Copyright for this article is retained by the author(s), with first publication rights granted to the journal. This is an open-access article distributed under the terms and conditions of the Creative Commons Attribution license (http://creativecommons.org/licenses/by/3.0/).