THE EFFECT OF INTEGRATION OF GEOGEBRA SOFTWARE IN THE
TEACHING OF CIRCLE GEOMETRY ON GRADE 11 STUDENTS’
ACHIEVEMENT
ByALFRED CHIMUKA
Submitted in accordance with the requirements for the degree of
MASTER OF SCIENCE
In the subject
MATHEMATICS EDUCATION
At the
UNIVERSITY OF SOUTH AFRICA
Supervisor
Dr U.I. Ogbonnaya
ii
DEDICATION
To God be the Glory
iii
DECLARATION
Name: CHIMUKA ALFRED
Student number: 46465545
Degree: MSC. MATHEMATICS, SCIENCE AND TECHNOLOGY
EDUCATION
THE EFFECT OF INTEGRATION OF GEOGEBRA SOFTWARE IN THE TEACHING OF CIRCLE GEOMETRY ON GRADE 11 STUDENTS’ ACHIEVEMENT
I declare that the above dissertation/thesis is my own work and that all the sources
that I have used or quoted have been indicated and acknowledged by means of
complete references.
9 MAY 2017
iv
ACKNOWLEDGEMENTS
This study is indebted to several individuals who offered their valuable assistance towards the completion of this work.
I am deeply grateful to Dr U.I. Ogbonnaya, my industrious mentor. He is an excellent academic and oriented and supported me promptly, with diligence and care. I could not have survived this demanding journey had it not been for his unwavering support, motivation, and above all his academic integrity.
I also would like to thank Dr Jane E.M. Murray for language editing this document.
I also extend my gratitude to the staff of the Institute for Science and Technology Education (ISTE): Professor H.I. Atagana, Professor L.D. Mogari, Professor Jeanne Kriek, and Dr C.E. Ochonogor for their encouragement, excellent academic criticism and insightful comments that polished this study.
I am also indebted to the University of South Africa Research Ethics Committee, University of South Africa Research Funding Office, the Circuit Manager (Nzhelele East Circuit in Vhembe district of Limpopo Province), the principals and governing bodies of the schools involved, parents of the students who took part in the study, and the schools where the pilot and main studies were conducted, for granting permission to conduct this study. The students who participated in this study deserve my special appreciation. I derived joy and self-fulfilment in working with these wonderful young people. This work would not have developed to fruition without their enthusiastic participation.
Finally, I am deeply grateful to my wife, Tsitsi, and our children, Makanakaishe, Mufudzi and Claris, for their encouragement and support throughout the duration of this study.
v ABSTRACT
This study investigated the effect of integration of GeoGebra into the teaching of circle geometry on Grade 11 students’ achievement. The study used a quasi-experimental, non-equivalent control group design to compare achievement, Van Hiele levels, and motivation of students receiving instruction using GeoGebra and those instructed with the traditional ‘talk-and-chalk’ method.
Two samples of sizes n = 22 (experimental) and n = 25 (control) drawn from two secondary schools in one circuit of the Vhembe district, Limpopo Province in South Africa were used. A pilot study sample of size n = 15, was carried out at different schools in the same circuit, in order to check the reliability and validity of the research instruments, and statistical viability. The results of the pilot study were shown to be reliable, valid and statistically viable. The study was informed by the action, process, object, schema (APOS) and Van Hiele theories, as the joint theoretical framework, and the literature search concentrated on technology integration, especially GeoGebra, in the teaching and learning of mathematics.
The literature was also reviewed on the integration of computer technology (ICT) into mathematics teaching and learning, ICT and mathematical achievement, and ICT and motivation. The study sought to answer three research questions which were hypothetically tested for significance. The findings of this study revealed that there was a significant difference in the achievement of students instructed with GeoGebra compared to those instructed with the traditional teaching method (teacher ‘talk-and-chalk’). The average achievement of the experimental group was higher than that of the control group. Significant differences were also established on the Van Hiele levels of students instructed with GeoGebra and those instructed without this software at Levels 1 and 2, while there were no significant differences at Levels 3, 4 and 5. The experimental group achieved a higher group average at the visualisation and analysis Van Hiele levels. It was also statistically inferred from questionnaires through chi-square testing, that students instructed with GeoGebra were more motivated to learn circle geometry than those instructed without the software.
Keywords: Integration of GeoGebra software; APOS theory; Van Hiele theory; achievement; motivation
vi
TABLE OF CONTENTS
CHAPTER 1 BACKGROUND AND OVERVIEW ... 1
1.1 Background to the study ... 1
1.2 Problem statement ... 3
1.3 Research questions ... 5
1.4 Research hypotheses ... 6
1.5 Rationale of the study ... 6
1.6 Significance of the study ... 7
1.7 Scope and delimitation of the study ... 8
1.8 Key concepts ... 8
1.8.1 Chalk and talk method of instruction ... 9
1.8.2 Instruction with GeoGebra ... 9
CHAPTER 2 THEORETICAL FRAMEWORK AND LITERATURE REVIEW ... 10
2.1 Theoretical framework ... 10
2.1.1 Van Hiele theory of geometry thinking ... 10
2.1.2 APOS theory ... 16
2.2 Literature review ... 21
2.2.1 Circle geometry ... 22
2.2.2 ICT in mathematics teaching and learning ... 26
2.2.3 ICT and students’ achievement ... 33
2.2.4 ICT and students’ motivation ... 37
2.3 Conclusion ... 39
CHAPTER 3 RESEARCH METHODOLOGY ... 40
3.1 Research Philosophy ... 40
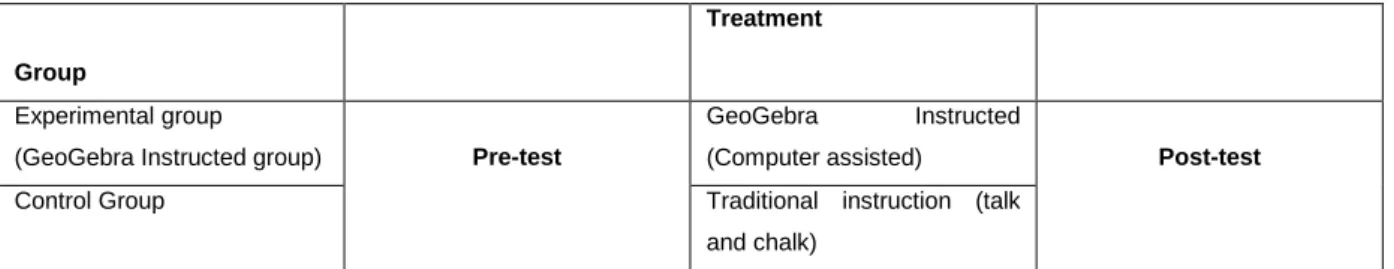
3.2 Research Design ... 41
3.3 Treatments ... 43
3.4 GeoGebra ... 44
3.5 Data collection instruments ... 47
3.5.1 Pre-test ... 48
3.5.2 Post-test ... 48
3.6 Development of Tests ... 49
3.7 Development of questionnaire ... 50
3.8 Reliability and validity of instruments ... 51
3.8.1 Reliability of test instruments ... 51
3.8.2 Reliability of questionnaire ... 53
3.8.3 Validity of instruments ... 53
vii
3.10 Ethical considerations ... 55
3.10.1 Ethical clearance by the University ... 55
3.10.2 Informed consent ... 55
3.10.3 Minimising the risk of harm... 56
3.10.4 Anonymity and confidentiality ... 56
3.11 Conclusion ... 56
CHAPTER 4 FINDINGS ... 58
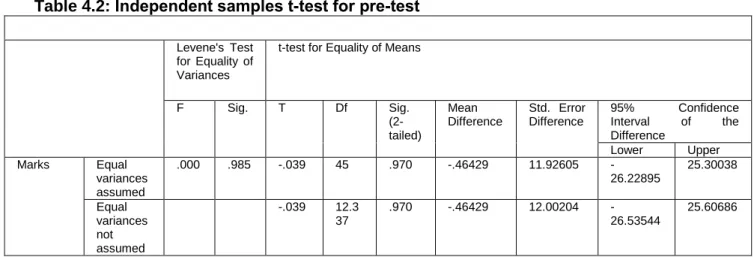
4.1 Pre-test ... 58
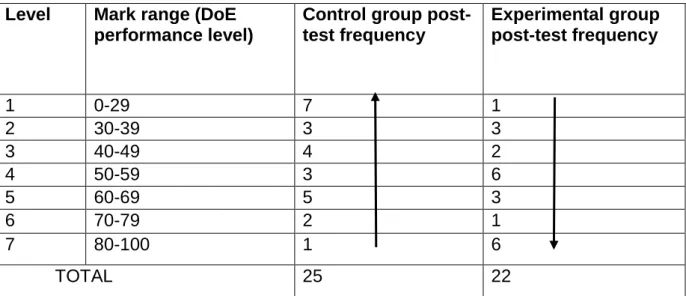
4.2 Post-test results ... 59
4.2.1 Overall students’ achievements in the post-test... 59
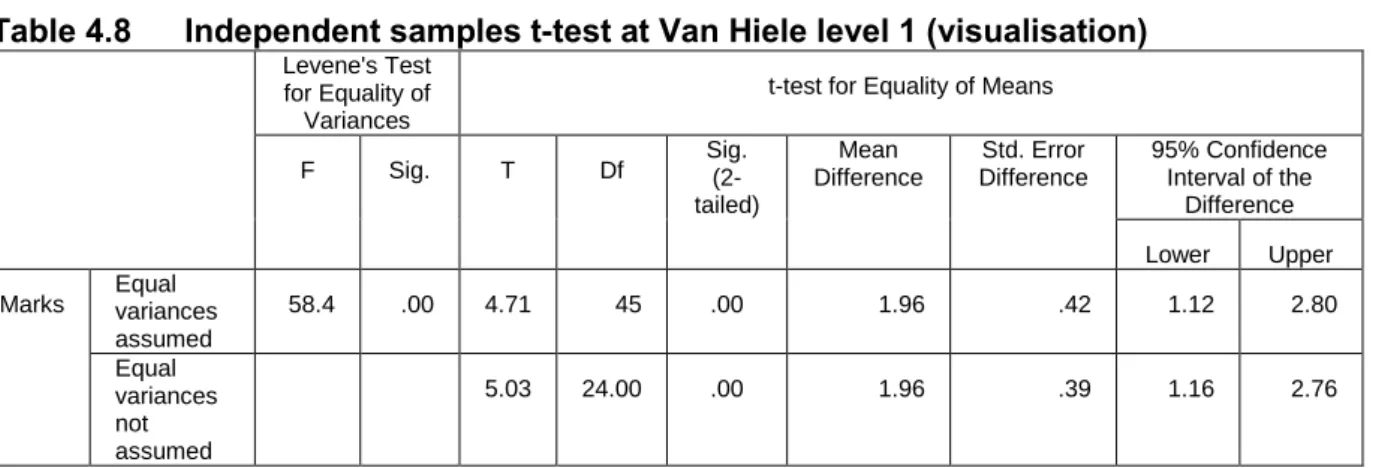
4.2.2 Students’ achievements at Van Hiele levels ... 62
4.3 Questionnaire results ... 67
4.3.1 Participation attribute result ... 68
4.3.2 Concentration attribute result ... 70
4.3.3 Enjoyment attribute result ... 72
4.3.4 Self-confidence attribute result ... 73
4.3.5 Content mastery attribute result ... 75
4.3.6 Recommendation attribute result ... 76
4.4 Answering the research questions ... 79
4.4.1 Research question one ... 79
4.4.2 Research question two ... 79
4.4.3 Research question three ... 82
4.5 Conclusion ... 83
CHAPTER 5 SUMMARY OF THE STUDY, DISCUSSION, RECOMMENDATIONS AND CONCLUSIONS ... 88
5.1 Summary of study... 85
5.1.1 Aim of study... 85
5.1.2 Methodology ... 86
5.2 Findings ... 87
5.2.1 Research question one ... 87
5.2.2 Research question two ... 87
5.2.3 Research question three ... 89
5.3 Discussion ... 89
5.4 Implication of results ... 93
5.5 Limitations of the study ... 93
5.6 Recommendations for future research ... 93
viii
REFERENCES ... 96
APPENDIX A: DATA COLLECTION INSTRUMENTS ... 127
APPENDIX B: RESULTS AND CALCULATIONS ... 128
ix
LIST OF TABLES
Table 2.1 APOS theory phases and their descriptors………..17
Table 3.1 Non-equivalent comparison group design ... 41
Table 3.2 Van Hiele leves/skills question distribution and mark allocation ... 48
Table 3.3 Assessment rubric according to Van Hiele levels ... 49
Table 4.1 Group statistics for pre-test ... 58
Table 4.2 Independent samples t-test for pre-test results ... 59
Table 4.3 Frequence distribution of post-test results ... 60
Table 4.4 Measures of dispersion and central tendency ... 60
Table 4.5 Groups’ statistics for post-test ... 61
Table 4.6 Independent samples t-test for post-test ... 61
Table 4.7 Groups’ statistics at Van Hiele level 1 (visual) ... 62
Table 4.8 Independent samples t-test for group averages at Van Hiele level 1 (visual) .. 62
Table 4.9 Group statistics at Van Hiele level 2 (analysis) ... 63
Table 4.10 Independent samples t-test for groups at Van Hiele level 2 (analysis) ... 63
Table 4.11 Groups’ statistics at Van Hiele level 3 (abstraction) ... 64
Table 4.12 Independent samples t-test for groups at Van Hiele level 3 (analysis) ... 64
Table 4.13 Groups’ statistics at Van Hiele level 4 (deduction) ... 65
Table 4.14 Independent samples t-test for groups at Van Hiele level 4 (deduction) ... 65
Table 4.15 Groups’ statistics at Van Hiele level 5 (rigor) ... 66
Table 4.16 Independent samples t-test for groups at Van Hiele level 5 (rigour) ... 66
Table 4.17 Cross-tabulation of participation attribute ... 69
Table 4.18 Chi-square test of encouragement to participate question ... 69
Table 4.19 Cross-tabulation of concentration attribute ... 71
Table 4.20 Chi-square tests of concentration attribute ... 72
Table 4.21 Cross-tabulation of enjoyment attribute ... 72
Table 4.22 Chi-square tests of enjoyment attribute ... 73
Table 4.23 Cross-tabulation of self-confidence attribute ... 74
Table 4.24 Chi-square tests of self-confidence attribute ... 75
Table 4.25 Cross-tabulation of content mastery attribute ... 75
Table 4.26 Chi-square tests of content mastery attribute ... 76
Table 4.27 Cross-tabulation of recommended/preference attribute ... 77
Table 4.28 Chi-square tests of recommended/preference attribute ... 78
x
LIST OF FIGURES/DIAGRAMS
Figure 2.1 Van Hiele theory ... 11
Figure 2.2 Tangent and chord theorem ... 17
Figure 2.3 Theoretical Framework: Fusion of Van Hiele and APOS theories ... 21
Figure 2.4 Theorem 1 ... 23 Figure 2.5 Theorem 2 ... 24 Figure 2.6 Theorem 3 ... 24 Figure 2.7 Theorem 4 ... 25 Figure 2.8 Theorem 5 ... 25 Figure 2.9 Theorem 6 ... 26
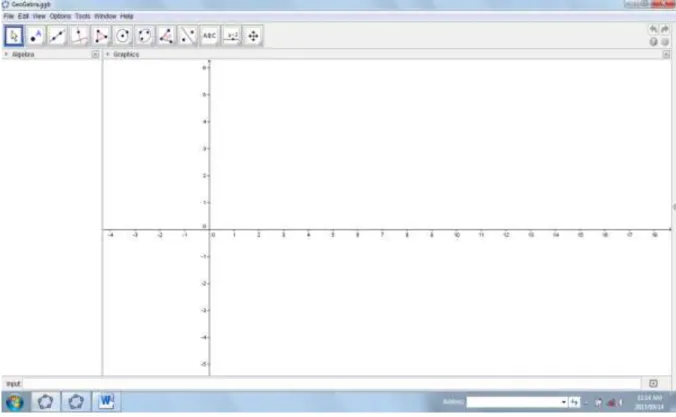
Figure 3.1 GeoGebra’s user interface ... 45
Figure 4.1 Compound bar chart on participation attribute... 70
Figure 4.2 Compound bar chart on concentration attribute ... 71
Figure 4.3 Compound bar chart on enjoyment attribute ... 72
Figure 4.4 Compound bar chart on answering questions satisfactorily attribute ... 73
Figure 4.4 Compound bar chart on expected results question attribute... 74
xi
LIST OF ACRONYMS
ACE Activities, Classroom discussion and Exercises APOS
BECTA
Action, Process, Object Schema
British Educational Communications and Technology Agency
CAPS Curriculum Assessment Policy Statement
CAS Computer Algebraic System
CVR Content Validity Ratio
DGS Dynamic Geometry Systems
DoBE Department of Basic Education
FET Further Education and Training
ICT ISTE
Information and Computer Technology International Society for Technology IT
KISS
Information Technology Keep It Short and Simple
KR20 Kuder-Richardson 20
NCS SERA
National Curriculum Statement
Scottish Educational Research Association SPSS Statistical Package for Social Sciences Unisa University of South Africa
1
CHAPTER 1
BACKGROUND AND OVERVIEW
1.1 Background to the study
Poor achievement in mathematics and other sciences has been a major problem confronting the South African basic education system for quite some time (since the dawn of democracy in 1994). Authorities have from time to time revised the curriculum in general and the mathematics curriculum in particular for various reasons, but mathematical achievement in South Africa by students is yet to compare favourably to international standards.
The South African school curriculum, in particular the secondary school mathematics curriculum, has undergone extensive transformation since 1994. The democratic government of South Africa has issued several curriculum-related reforms intended to democratise education and eliminate inequalities established by the apartheid education system. Chisholm (2003) reported that, since 1994, the curriculum reform process in South Africa has passed through three main stages. She argued that the first stage involved the ‘cleansing’ of the curriculum of its racist and sexist elements in the immediate aftermath of the democratic elections. The second stage, according to Chisholm (2003), was the implementation of outcomes-based education (OBE) through Curriculum 2005 (C2005) while the third stage involved the review of C2005, culminating in the creation of the Revised Curriculum Statement (Chisholm, 2003). To date, the education curriculum in South Africa has undergone a fourth transformation. The National Curriculum Statement (NCS) of 2002, revised in 2009, has been phased out to make way for the Curriculum and Assessment Policy Statement (CAPS) of 2012. These changes, while they are to all intents and purposes desirable, have inevitably brought with them a number of pedagogical and instructional challenges.
In the NCS, the mathematics Grade 12 examination consisted of three papers (Papers 1, 2 and 3) of which Papers 1 and 2 were compulsory for all learners while Paper 3 was optional (Department of Basic Education, 2012). The topics in Paper 3 were optional topics, hence, they were not taught in many schools because learners had not registered for Paper 3. In the CAPS mathematics curriculum, some of the
2
NCS optional topics were integrated into either paper 1 or paper 2 so that two Papers, compulsory for all Grade 12 learners were set while Paper 3 was cancelled.
Some of the topics that have been integrated into papers one and two of the new CAPS mathematics curriculum for the Further Education and Training band (FET) (Grades 10–12) are circle geometry, descriptive statistics and interpretation, probability, and bivariate data. The inclusion of Paper three’s content into papers one and two was a curriculum change of great magnitude for both teachers and learners. The majority of mathematics teachers in the FET band, at least at the time of its introduction, were ill-equipped pedagogically to teach what appeared to be new topics. Learners, on the other hand, had to brace themselves for an increased workload and more challenging mathematical content.
This study sought to intervene, and investigate how technologically oriented teaching methods could improve student achievement. According to Suan (2014), students’ performance and achievement in mathematics is affected by three factors, namely teacher factor, student factor and environmental factor. Suan (2014) argues that the teacher factor is comprised of subject mastery, instructional techniques and strategies, classroom management, communication skills, and personality. The student factor includes study habits, time management, attitude and interest in mathematics; the environmental factor includes issues such as parents’ values and attitudes, classroom settings, and peer group (Suan, 2014). This study sought to explore one aspect of the teacher factor (teaching aids), namely, the extent to which technology-inspired instructional techniques and strategies impact on student achievement in mathematics.
This study sought to investigate the effect of integrating GeoGebra into the teaching of circle geometry on students’ achievement. Two key variables affecting student achievement focused on in this study were students’ Van Hiele levels and student motivation. The researcher believes there are wide knowledge gaps in the effective teaching and learning (instructional techniques and strategies) of circle geometry caused by some of the factors that Suan (2014) alluded to, coupled with the change in the national mathematics curriculum, specifically in Nzhelele East circuit of Vhembe district of Limpopo in South Africa. The researcher believes that the major
3
cause of poor achievement in geometry topics is instructional and knowledge deficiencies among teachers of geometry. In the circuit where this study was carried out, no secondary school was offering mathematics paper three in the NCS curriculum, and most teachers confessed at mathematics workshops to have inadequate knowledge of the geometry topics dating back to their days as students themselves. Moreover, institutional support to schools on presumed difficult topics is either absent or weak. For these reasons, this study explored the effect of technology-inspired teaching.
The traditional talk-and-chalk teacher-centred type of teaching, which assumes that students are passive recipients of knowledge, has lost its lustre among technologically savvy youths. It is one’s belief that the integration of information technology (IT), GeoGebra in particular, into the teaching and learning of secondary school mathematics can serve as a scaffold on which changes and developments in curriculum can be better managed.
In this study, the researcher looked specifically at the mathematical content of circle geometry which was formerly in the Grade 11 optional paper three, and quasi-experimentally explored the effect of integrating GeoGebra in teaching the topic on Grade 11 students’ achievement, Van Hiele levels, and motivation. The intention was to investigate whether it is worthwhile to integrate GeoGebra into the teaching and learning process in order to narrow the instructional and knowledge gap, seemingly created by the teacher factor and curriculum change.
1.2 Problem statement
Perennial poor performance in mathematics and related science subjects has impacted negatively on the South African tertiary education system. The majority of secondary school graduates fail to meet minimum performance standards in mathematics, required for successful completion of a tertiary qualification in mathematics and science-oriented fields.
According to the Centre for Development and Enterprise (2014), 90% of high school graduates in South Africa fail to meet the minimum performance levels required by tertiary institutions. This state of affairs impacts on the country’s human capital and
4
consequently hampers its economic development. From time immemorial, geometry sections in the mathematics examinations in South Africa have contributed significantly to poor performance in mathematics. Examination reports by the Department of Basic Education (DoBE) for the past two decades or so, indicate that geometry in general and circle geometry in particular were major contributors to students’ underachievement in mathematics. Geometry is an indispensable pre-requisite for applied mathematics and applied sciences at tertiary level.
Periodical changes in the mathematics curriculum, in which inclusions and/or exclusions of geometric topics, and sometimes making geometric topics optional or compulsory, has exacerbated the problem of poor performance in geometry. These inconsistencies result in some teachers failing to teach effectively those topics which are sometimes removed or made optional. The change of the South African curriculum from NCS to CAPS seems to have created instructional and/or pedagogical challenges for both teachers and students alike. Some of the content of paper three in the NCS mathematics curriculum has been integrated into paper one and paper two of the new CAPS curriculum. The CAPS mathematics curriculum’s examination assessment now consists of only two compulsory examination papers (papers one and two), as compared to two compulsory papers (papers one and two) and one optional paper (paper three) in the NCS mathematics curriculum. The implication of this curriculum change is that all students, regardless of ability, have to answer all questions previously assessed in optional paper three, while some teachers have little or no experience in teaching the newly introduced topics. Teaching and learning under these circumstances is no mean task, as evidenced by examination reports from 2008 to 2012, which indicate that students enrolled for paper three did not achieve high marks in the paper (DoBE examination reports, 2008 to 2012).
The major problem that this study sought to solve is poor achievement in circle geometry, that I believe has its origins in an inadequate background in geometry and poor motivation to learn it. The study investigates the effect of the integration of GeoGebra into the teaching of circle geometry on student achievement of Grade 11 students. The emphasis is to discover whether the method of instruction
(computer-5
assisted instruction using GeoGebra) motivates students, enhances their problem-solving techniques and ultimately improves their achievement in geometry.
1.3 Research questions
This study sought to address the following three research questions:
1. Is there any difference in the achievements of students exposed to GeoGebra compared to students taught without GeoGebra in circle geometry?
2. Is there any difference in the achievements of students exposed to GeoGebra compared to students taught without GeoGebra at Van Hiele levels of geometric thinking?
To answer research question 2, the following five sub-questions, each focusing on a particular Van Hiele level, were raised:
2.1 Is there any difference in the achievements of students exposed to GeoGebra compared to students taught without GeoGebra at the visualisation level of geometric thinking?
2.2 Is there any difference in the achievements of students exposed to
GeoGebra compared to students taught without GeoGebra at the analysis level of geometric thinking?
2.3 Is there any difference in the achievements of students exposed to GeoGebra compared to students taught without GeoGebra at the abstraction level of geometric thinking?
2.4 Is there any difference in the achievements of students exposed to GeoGebra compared to students taught without GeoGebra at the deduction level of geometric thinking?
2.5 Is there any difference in the achievements of students exposed to GeoGebra compared to students taught without GeoGebra at the rigour level of geometric thinking?
3. Does GeoGebra aid students’ motivation to learn circle geometry?
To answer this research question, a seven-item motivation attributes questionnaire was used and seven hypotheses were chi-square tested for significance of differences.
6 1.4 Research hypotheses
The following null hypotheses were tested at α = 0.05 (95% confidence interval) level of significance.
1. There is no significant difference in the achievement of students exposed to GeoGebra compared to those not exposed to the software.
2. There is no significant difference in the achievement of students exposed to GeoGebra compared to those not exposed to the software at Van Hiele Level one.
3. There is no significant difference in the achievement of students exposed to GeoGebra compared to those not exposed to the software at Van Hiele Level two.
4. There is no significant difference in the achievement of students exposed to GeoGebra compared to those not exposed to the software at Van Hiele Level three.
5. There is no significant difference in the achievement of students exposed to GeoGebra compared to those not exposed to the software at Van Hiele Level four.
6. There is no significant difference in the achievement of students exposed to GeoGebra compared to those not exposed to the software at Van Hiele Level five.
7. There is no significant difference in the extent to which students are motivated to learn circle geometry between students taught with GeoGebra and those taught without the software.
1.5 Rationale for the study
Many South African students at Grade 12 perform very poorly in Euclidean geometry. Examination reports for different years from the Department of Basic Education in South Africa paint a very gloomy picture about student performance in specific topics, especially Euclidean geometry (DoBE Examination Reports 2012 and 2013; Paper three reports 2014; Paper two reports 2015). Many teachers in the South African school system are not effective in the teaching of geometry, for various reasons, including the fact that some never learnt Euclidian geometry during their school or college education. For these reasons, intervention mechanisms and strategies are needed. There is an urgent need for an improvement of teaching strategies in order
7
to improve poor performance in mathematics. To contribute to the solution of the problem of poor performance, this study sought to employ mathematical technology (GeoGebra) in the teaching and learning process of Euclidean geometry.
It is very evident that the traditional methods of teaching geometry are not achieving the desired results. Consequently, there is a dire need to find alternative teaching and learning methods that incorporate technology. Studies have indicated that technology, if correctly used, could improve student performance (Murray, 2016).
Integrating technology software, such as GeoGebra, into the teaching and learning of mathematics is supported by the theory of experiential learning and learner-centred education (Kolb, 2015). Many studies (e.g. Bester & Brand, 2013; Ogbonnaya, 2010) have advocated the use of technology in mathematics teaching and learning to enhance student learning of mathematical concepts. Willougby and Wood (2008) noted that learning takes place on computer software without the learners realising the amount of attention they are paying to the material.
The use of technological software, such as GeoGebra, in the teaching of circle geometry in mathematics can act as a positive stimulus to students’ learning of the concepts.
1.6 Significance of the study
Improving mathematics results in secondary schools in South Africa is a contemporary problem to which practical solutions are yet to be found. This study has sought to contribute in this regard by exploring alternative teaching and learning methods, especially for topics traditionally regarded as problematic to both teachers and students, such as circle geometry.
Geometry is a key mathematics component that is required in all applied physical sciences; its teaching and learning through the use of technology, helps students to develop insights into an understanding of today’s technological industry (Ritz, 2009). Teaching and learning methods that incorporate technology are important to developing countries such as South Africa, in order for these countries to catch up with the rest of the developed world. The long-term goal for this study is to inspire
8
mathematics teachers and students to use mathematical software to simplify the teaching and learning processes. Researchers recommend teaching methods that help students to discover and develop their talents in technical fields (Ritz, 2009). By using mathematical software, such as GeoGebra, students begin the process of technical problem-solving in the classroom, which they will be able to transfer to industrial technical problem-solving (Ritz, 2009). Snyder and Hales (1981) argued that using technology in the teaching and learning of geometry can result in positive effect in today’s world, in areas such as technological systems of communication, construction, manufacturing and transportation.
Hohenwarter and Preiner (2007) argued that there is a growing belief among international mathematics teachers that GeoGebra has the potential to transform mathematics education. Consequently, this study aimed to add to the list of literature on the use of technology in teaching mathematics, especially in the South African context.
The study may serve as a guide to mathematics educators in finding alternative and/or supplementary ways of teaching circle geometry instead of the teacher talk and-chalk method of teaching. Because many students are not motivated to learn mathematics, this study could help the mathematics education community and other stakeholders in mathematics education in South Africa to determine whether the use of technology in mathematics teaching could motivate students to learn the subject.
1.7 Scope and delimitation of the study
This quasi-experimental research study was of limited scope. The population of the study was derived from Grade 11 mathematics students in Limpopo Province of South Africa. The sample for the study was taken from two Grade 11 mathematics classes at two secondary schools in Nzhelele East circuit in the Vhembe district of Limpopo Province. The topic is limited to circle geometry taught in Grade 11.
1.8 Key concepts
This study compared two methods of teaching and learning, namely Chalk and talk method of instruction and instruction using GeoGebra.
9 1.8.1 Chalk and talk method of instruction
The chalk-and-talk method of instruction, or direct instruction, is a traditional teaching method in which the students’ focus is on what the teacher says and what s/he writes on the chalkboard. In most cases, the teacher speaks from the front of the class, explaining, guiding, controlling and deciding what students must do, and occasionally writes notes, diagrams, questions on the chalkboard. Students are often seated in rows and are expected to pay attention and follow instructions. The chalk-and-talk method of instruction is largely teacher-centred (teacher conveys what s/he knows to students).
1.8.2 Instruction with GeoGebra
GeoGebra is interactive and visual software for teaching and learning geometry, algebra, statistics, calculus, and other sciences. It was developed by Markus Hohenwarter, and can be used for active and problem-oriented teaching and learning. Instruction with GeoGebra enables mathematical experiments and discoveries. GeoGebra has several views (algebraic view; geometric view; spreadsheet view; computer algebra system view; protocol design view; and command line) all linked together. Instruction with GeoGebra is largely student centred.
10
CHAPTER 2
THEORETICAL FRAMEWORK AND LITERATURE REVIEW
This study is grounded on two learning theories, Van Hiele (1957) and action, process, objects and schema (APOS) (Dubinsky, 1984a) theories. These two theories were deliberately selected as the joint theoretical framework because of their relevance to the teaching and learning process of geometry; the Van Hiele theory was used as a framework to analyse the learners’ levels and/or stages that they go through when engaged in circle geometry problem-solving and APOS was used as the general guideline to the research process. In the literature review, the background and context for the study that was briefly explained in chapter one are elaborated. The literature review was intended to discuss findings on the integration of ICT in the teaching and learning process and to identify gaps in current knowledge on the integration of technology with mathematics education at secondary school level.
This chapter also reviews studies that have used Van Hiele and APOS theories. Also reviewed are studies on the integration of information and computer technology (ICT) into mathematics teaching and learning with emphasis on GeoGebra, ICT and learners’ achievement, and ICT and learners’ motivation to learn. The chapter concludes by affirming the current study. The literature review strategy was the investigation of published databases, journals, research papers, reports and publications in the field of educational technology of the South African Department of Basic Education and other countries.
2.1 Theoretical framework
This study was framed on two learning theories of how students learn (in particular mathematics), namely Van Hiele theory of geometry thinking (Van Hiele, 1957) and APOS theory (Dubinsky, 1984a).
2.1.1 Van Hiele Theory of Geometry Thinking
The Van Hiele theory of geometric thinking is a framework that describes the development of geometric reasoning. Two mathematics educators in the Netherlands, Pierre Van Hiele and Dina Van-Geldorf, developed a pedagogical
11
theory to describe the geometric understanding levels of children by focusing on problems faced by students when they learn geometry (Olkun & Toluk, 2003). According to Van Hiele theory, a student progresses through five stages/levels of development when learning geometry, namely visualisation, analysis, abstraction, deduction and rigour as illustrated in Figure 2.1.
Figure 2.1: Van Hiele Theory (adapted from Van de Walle, 2004, p. 347)
Level 1: Visualisation
The Van Hieles postulated that this stage/level is when students recognize the figures by appearance alone, often by comparing them to a known prototype. The properties of a figure are perceived. Students recognize triangles, squares, circles, parallelograms, and other shapes, but do not identify correctly the properties of these figures. At visualisation level, students make uninformed decisions because they base their arguments on perception, rather than on reasoning, for example, the figure is a square, cube or rectangle because it looks like one (Ball, 1990).
According to Pegg and Davey (1989), there are at least three basic categories of visualization, as follows:
1. Student can focus only on a single feature such as the number of sides.
2. Student can identify certain features of a figure, such as points, sharpness, corners and flatness, but is not able to link these features so as to have an overview of the shape.
12
3. Student is able to associate a geometric shape with a known shape, for example a cube is like a chalk box or a dice, a rectangle is a long square, parallel lines are like racing tracks (Pegg & Davey, 1989, p. 25).
In essence, successful visualization, according to Pegg and Davey (1989), can be achieved by focusing on one aspect or feature of the geometric figure, or focusing on multiple aspects or features on the figure. Association of a geometric figure with real-life objects also assists visualization.
Level 2: Analysis
A student operating at the analysis level is able to identify each element of a geometric object in terms of its properties in isolation. At this level, students see figures as collections of properties. Although they can recognize and name properties of figures, they do not see relationships between the properties. When describing an object, a student operating at this level might list all the properties the student knows, but does not make connections between figures (Clements & Basttista, 1992). The properties are seen as discrete entities independent of one another. For example, an equilateral triangle has the following properties: three equal sides, three equal angles, and three axes of symmetry but students might not at this level realise that these three properties imply one another. In circle geometry, the following two theorems can be viewed in isolation, yet they imply one another: (i) the theorem that states that, the angle subtended at the centre is twice that subtended at the circumference, and (ii) the theorem that states that, the angle subtended by the diameter is a right angle.
Level 3: Abstraction/Ordering
According to the online Harrap dictionary (2016), an abstraction is ‘an idea or principle considered or discussed in a purely theoretical way without reference to actual examples and instances’. Students at this level are able to perceive relationships between properties and figures. They can define and give informal arguments to justify their reasoning. For example, in circle theorems, students are able to identify that the two theorems, the angle subtended at the centre is twice that subtended at the circumference, and the angle subtended by the diameter is a right angle, imply one another.
13
The key mental or cognitive activity at this stage is ordering (sequencing). Logical implications and class conclusions, such as squares being a type of rectangle, are understood. The role and significance of formal deduction, however, is not understood (Oliver, 2000). Mayberry (1983) indicates that at this level, logical implications and class inclusions are understood. For example, in an equilateral triangle, all sides are equal, implies that all angles are equal.
Level 4: Deduction
Deduction is the reasoning process by which one concludes something from known facts or circumstances. At this level students can construct proofs, understand the role of axioms and definitions, and know the meaning of necessary and sufficient conditions. In addition, at this level, students should be able to construct proofs such as those typically encountered in a secondary school geometry class (Mason, 1998; Van Hiele, 1959; Van Hiele-Geldof, 1984). Most of the higher-order circle geometry theorems or proofs in South African secondary school mathematics can be tackled by students operating at the deductive level, for example, proof of theorems such as: The angle between the tangent to a circle and a chord drawn from point of contact is equal to an angle in the alternate segment.
Level 5: Rigour
The last level, is rigour. Students at this level understand the formal aspects of deductive reasoning, such as establishing the similarities and differences between mathematical concepts. For example, in proving circle theorems, students require the whole set of skills, such as statement of what is to be proved, construction of additional lines (abstraction) and statement of implied or given theorems. They can understand the use of indirect proof and proof by contra-positive methods as well as non-Euclidean systems (Simon, 2006).
Some scholars such as Simon (2006) and Mason (1998) concur with the original Van Hiele theory, they argue that the rigour level is the level of college mathematics, where students major in geometry, (Van Hiele, 1986). Their argument is that, students at rigour level understand the relationships between various systems of geometry, through geometrical maturity, thus they are able to describe the effect of adding or deleting an axiom on a given geometric system. This study, however
14
argues that the levels of geometrical understanding by students, as propounded by the Van Hieles can be applied as they are to any group of students regardless of age and/or gender, this assertion is supported by studies such as those carried out by Alex & Mammen, (2012), Abdullah & Zakaria, (2012), and Abidin, (2013). Van Hiele theory is not a developmental theory where students must reach a certain age to progress through the levels; rather, it is dependent on the experiences and activities in which students are engaged. For this reason, the learning environment created by the teacher can provide experiences that helps students to progress from visualisation level to rigour level, hence the use of GeoGebra in this study.
The theory as propounded by the Van Hieles was meant to be hierarchical, meaning that a learner cannot operate with understanding on one level without having been through the previous levels. Although this has been confirmed by some findings from research studies, such as those conducted De Villiers & Njisane (1987), Fuys, Geddes, Lovett & Tischler (1988), Burger & Shaughnessy (1986) suggest, however, that the levels may not be discrete as suggested by the Van Hieles. Rather, it is possible that students learning a particular geometric concept can be in transition between levels, implying that they can oscillate between the two levels. There is also evidence that the student’s level of geometrical thinking might vary across topics depending on how recent a topic was studied (Fuys et al., 1988).
The original Van Hiele theory of geometrical thinking regarded each level as having its own vocabulary and students at different geometrical levels were assumed not able to understand one another. For example, a rectangle might have a different meaning for students at different levels. Students at the ordering level might regard rectangles as a special kinds of parallelograms, while students at the lower geometrical level may not understand the relationship between rectangles and parallelograms. Fuys et al., (1988), argued that problems can be encountered when a teacher uses higher level language to that of students. The Van Hiele theory in its original state placed emphasis on pedagogy and the importance of the teacher structuring the students’ experiences to facilitate transition through the levels.
15
Fuys et al. (1988) argued that according to Van Hiele theory, progress from one level to the next involves five phases. Each phase involves a higher level of thinking. These phases are useful in designing activities, as follows:
1. Information: The student becomes familiar with the working domain/field of exploration by using the teaching and learning material presented to him/her. The use of GeoGebra (the working domain for this study) in the teaching and learning of circle geometry makes it easy for students to acquire basic, but very important, information that underpins the understanding of the whole topic. Visualisation of angles subtended by various lines, arcs and/or chords, can readily be achieved by students if they are allowed to explore using the computer.
2. Guided orientation: The students explore concepts using the teaching and
learning materials presented to them, for example, by folding and measuring paper, the will be able to identify symmetrical shapes.
3. Explanation: A student becomes conscious of the network of relations, tries to express them in words and learns the required technical language for the subject matter, for example, expresses ideas about the properties of figures. In circle geometry, the learner understands the meaning of key words such as subtending an angle, alternate segment, interior and exterior angles.
4. Free orientation: Investigation of relationships between objects is still largely unknown at this stage, but learners are given more complex tasks to find their way round this field, for example, a learner might know about the properties of one kind of shape but is required to investigate the properties for a new shape, for example, a kite. The tasks should be designed so that they can be carried out in different ways. In circle geometry, free orientation of a learner is achieved when the learner is able to identify angle properties on parallel lines and other geometric shapes that may be present in any given diagram.
5. Integration: Students are able to summarise all that they have learned about the subject, reflect on their actions and thus obtain an overview of the whole network/field that has been explored, for example, are enabled to summarise.
Van Hiele theory has been adopted by many researchers to explain how students understand basic geometry (Howse & Howse, 2014). For example, Khembo (2011) carried out an investigation into Grade 6 teachers’ understanding of geometry,
16
according to the Van Hiele levels of geometric thought. Van der Sandt (2003) carried out a two-year study in South Africa, to investigate the state of the knowledge of prospective teachers of Grade 7 geometry using Van Hiele theory.
There is a need for studies to evaluate the applicability of Van Hiele theory to more advanced geometric concepts, such as Euclidian geometry. In this study, the Van Hiele theory of geometric understanding was extensively used to design the post-test items (questions) for this study.
2.1.2 APOS theory
The APOS theory proposes that in order for an individual to make sense of a given mathematical concept he/she must have appropriate mental structures, (Maharaj, 2010). Dubinsky (1984a) proposed the APOS theory to describe how actions
become interiorized into processes and then encapsulated as mental objects, which take place in more sophisticated cognitive schemas (Tall, 1999). This study sought to use GeoGebra to teach a topic (circle geometry) perceived as difficult by students, following the four phases of APOS theory: action, process, objects, and schema.
An action in APOS theory context is a repeatable physical or mental manipulation that transforms objects (Dubinsky, 1984a). In the teaching and learning of circle geometry, identifying equal angles, parallel lines, various line parts and regions of a circle are actions. By using GeoGebra, with its interactive property, the actions can be repeated several times until the student interiorizes the properties of angles, line parts or regions of the circle. GeoGebra assists the transformation of a physical action (dragging) into mental action when a student is able to make instant identification of any properties, with or without the diagram.
A process in APOS theory context is the cognitive action that takes place entirely in the mind (Dubinsky, 1984b). As an individual repeats and reflects on an action, it may be interiorised into a mental process. The action of identifying various characteristics of angles and lines of a circle can be interiorised in such a way that learners are able to formulate their own mental process without visual diagrams. A process is a mental structure that performs the same operation as the action, but wholly in the mind of the individual (Maharaj, 2010).
17
Every process will result in an outcome or object (Dubinsky, 1984b). If a student becomes aware of the process involved in attempting to solve a problem, then the student has encapsulated the process into a cognitive object (Dubinsky, 1984b). In circle geometry, students, after having encapsulated or interiorized the various angle properties in circles, parallel lines, triangles and quadrilaterals, will be able to state the various objects (circle theorems). The difference between a process and an object is that a process becomes an object when it is perceived as an entity upon which actions and processes can be made (Dubinsky, 1984b).
A schema in APOS theory context is a more or less coherent collection of cognitive objects and internal processes for manipulating these objects (Dubinsky, 1984b). A schema could aid students to ‘understand, deal with, organise, or make sense out of a perceived problem situation’ (Dubinsky, 1991b, p. 102). In the circle geometry example, the objects (circle theorems) can be grouped and applied in formal proof of another theorem. For example, to prove the theorem that states: The angle between a tangent and a chord is equal to the angle subtended by the chord on the circumference; a collection of four objects can be used.
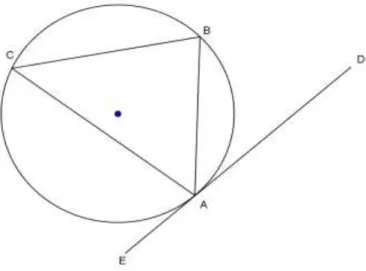
Figure 2.2 Tangent and chord theorem
The formal proof of the theorem illustrated in Figure 2.2, which according to APOS theory is a schema, may require the use of four objects, which are also geometric theories themselves:
1. Angles opposite equal sides are equal.
18
3. The angle subtended at the centre is double that at the circumference.
4. The angle between the tangent and radius/diameter is 900.
The above four theorems combined together form a coherent collection of cognitive objects and internal processes that aid the student to understand and deal with the formal proof of the theorem (schema). Table 2.1 illustrates the four phases of APOS theory when applied to circle theorems (geometry).
Table 2.1 APOS theory phases and their descriptors
APOS theory phase Descriptors of the phase in circle geometry/theorems
Mental/physical process
1. Actions Identification of shapes, angles,
parallel lines
Interiorisation
2. Processes Properties of angles, lines Coordination
3. Objects Theorems Encapsulation
4. Schema Formal proofs of theorems Generalisation and reversal
According to APOS analysis, the initial step in learning is an action of interiorisation, followed by a process of coordination that leads to encapsulation of objects, whose generalisation and reversal result in the attainment of schemas.
According to Brijlall and Maharaj (2013), interiorisation is the ability of the student to perform various tasks such as applying symbols and short cuts, use of correct language, identify pictures and images to construct internal processes as a way of making sense out of perceived phenomena. Actions on objects are interiorised into a system of operations. The process of interiorisation may in itself involve two or more processes coordinated to form a new higher order process, referred to as
encapsulation. When encapsulating students demonstrate the ability to
apply/conceive previous processes as one object. Encapulation involves generalisation and reversal (Dubinsky, 1991a). Generalisation is the ability to apply schema to a wider range of contexts, and reversal is the ability to reverse the thought process of previously interiorized processes (Dubinsky, 1991a).
19
Sfard (1991) argued that abstract mathematical notions (concepts) can be conceived in two fundamentally different ways: as processes (operationally) or objects (structurally). In APOS theory, action and process can be regarded as operational conceptions, while object and schema are structural (Maharaj, 2010). The development of mathematical concepts often proceeds by taking processes as operators and then turning them into objects.
The four phases, action, process, object, and schema, have been presented by Dubinsky in a hierarchical, ordered list. Each concept in the list must be constructed before the next step is possible. In reality, however, when an individual is developing his or her understanding of a concept, the constructions are not actually made in such a linear manner. With an action conception of circle geometry problems, a student may be limited to think about relevant circle theorem only, without making reference to the process, object and schema relevant to the problem.
In this study, the APOS theory was used directly in the teaching and learning process as illustrated in Table 1 and in the analysis of data by the researcher. The researcher was able to compare the success or failure of students on a mathematical task, (circle theorem-related tasks) with the specific mental constructions they may, or may not, have made. The theory makes testable predictions that if a particular collection of actions, processes, objects and schemas is constructed in a certain manner by a student, then the student will, in all likelihood, be successful in using certain mathematical concepts in certain problem situations (Maharaj, 2010).
Many studies conducted between 1990 and 2000 used the APOS theory in order to analyse how students learn mathematical concepts. For example, studies by Arnon (1992) and those by (1997) and colleagues. Arnon (1992, 1995, 1996, 1998, 1998b) conducted various studies using APOS theory as the theoretical framework, some of which include the following: teaching fractions in elementary school using the software ‘Fractions as equivalence classes’; teaching decimal numbers using concrete objects; refining the use of concrete objects for teaching mathematics to children at the age of concrete operations; and, describing how children develop mathematical concepts.
20
Following a similar research approach, Asiala led different research teams in using APOS theory to investigate how students learn various concepts. For example, Asiala, Cottril, Dubinsky & Schwindedorf (1997) investigated student understanding of co-sets, normality and quotient groups, and Asiala, Dubinsky, Matthews, Morics and Oktac (1998) examined how students of abstract algebra came to understand permutations of finite sets and symmetries of regular polygons.
The proponent of APOS theory, Dubinsky (1984), has published various scholarly articles in journals and research papers in which the key focus was reflective abstraction. All his works are a testimony of how he (Dubinsky) strongly believed that an APOS-oriented instructional approach was the best method to teach mathematical concepts.
APOS theory has been used extensively in research studies concerning almost every mathematical concept, except geometry. In my literature search of current mathematics journals from 1990 to 2015, I have not found a research study that used the APOS theory to study Euclidian geometry.
The period from 2001 to date has seen very few studies based on the APOS theory and there has also been a shift from strictly inspired investigations to APOS-fused theoretical frameworks (combination of the APOS theory and one or more learning theories), for example, that of Tall (2004).
This study jointly used Van Hiele and APOS theories to investigate the effect of integration of GeoGebra software on the achievement of Grade 11 students, Van Hiele levels and motivation. Although the theories were propounded at distinctively different times (Van Hiele theory, published in 1957 and APOS theory, published in 1984), they have since made similar contributions to the field of educational instruction and hence form the bases of this study.
21
Figure 2.3 illustrates the fusion of Van Hiele and APOS theoriesfor this study.
Figure 2.3: Theoretical framework: Fusion of Van Hiele and APOS theories
As illustrated in Figure 2.3, the five Van Hiele levels and the four APOS levels overlap, for example, although actions are directly related to visualisation, they are also related to the analysis level, and this overlapping applies to all the other levels. In some cases, at each Van Hiele level it is possible to achieve all four APOS theory levels, but for the purposes of this study, the relationship between Van Hiele theory and APOS theory is as shown in Figure 2.3.
Both APOS and Van Hiele theories are rooted in the learning theory of constructivism, in which learning is viewed as an active, contextualised process of constructing knowledge rather than the acquisition of knowledge (Devries & Zan, 2003). In this study, the major research question focuses on whether GeoGebra can enhance student achievement, while also assessing the impact of the Van Hiele levels attained by learners on their achievement and whether they were motivated by the teaching and learning method used in their class.
2.2 Literature review
The literature review sought to explore Grade 11 circle geometry content and common errors and/or misconceptions that result in circle geometry being a difficult
22
topic for mathematics students. A few examples of how GeoGebra can be used to correct errors and misconceptions are also presented. The literature review also includes how other research studies employed the Van Hiele and APOS theories and the impact of integrating ICT in teaching and learning in learners’ mathematical achievement and motivation.
2.2.1 Circle geometry
Circle geometry is a branch of mathematics that deals with the properties of angles and lines within, on, and outside circles. Circle geometry is a sub-section of Euclidean geometry that incorporates the use of theorems, theorem converses, corollaries and axioms. The South African CAPS (2012) curriculum for Grades 10–12 has circle geometry sections to be covered by students at each grade level. Circle geometry is assessed in paper 2, but South African students continue to perform poorly in this topic. Hence this study seeks to investigate the effect of teaching circle geometry to Grade 11 students by using GeoGebra as a way to improve their poor performance. There could be several reasons responsible for the poor performance in circle geometry, for example, poor teaching and learning methods employed by teachers and lack of student confidence and motivation. Another reason that could contribute to poor performance in circle geometry questions is that circle geometry problems are not intuitively obvious to students. The process of proving theorems often requires students to use results from different sections of geometry and algebra (Stols, 2012).
DoBE (2010, 2011, 2012 & 2013) examination reports on mathematics paper 3 indicate that many students had difficulties in answering circle geometry questions based on Grade 11 content. For example, students may fail to identify that the four diagrams in Figure 2.5 actually depict the same concept.
The focus of this study is circle geometry at Grade 11, hence the presentation of the content of Grade 11 circle geometry and the common errors and misconceptions made by students is important, in order to provide an overview of why students underperform in circle geometry.
23
At Grade 11 students are expected to achieve three main objectives in circle geometry (DoBE, 2012), namely:
1. Investigate and prove theorems of the geometry of circles assuming results from earlier grades, together with results concerning tangents and radii of circles.
2. Solve circle geometry problems, providing reasons for statements when required.
3. Prove riders.
Presented below are some of the circle geometry theorems and some diagrammatical representations that Grade 11 students are expected to master, as stipulated in the Department of Basic Education Examination Guidelines (DoBE, 2014). The theorems are numbered for the purpose of identifying them only.
1. The line drawn from the centre of a circle perpendicular to a chord bisects the chord.
Figure 2.4: Theorem 1
Students are expected to prove that the distance AC = CB.
2. The perpendicular bisector of a chord passes through the centre of the circle.
This theorem is the converse of the theorem stated in 1 and uses the same diagram, but students are expected to prove that angle OCA or OCB is 90o.
24
3. The angle subtended by an arc at the centre of a circle is double the size of the angle subtended by the same arc at the circumference (on the same side of the chord as the centre).
Figure 2.5: Theorem 2
Students are expected to use any of the above four diagrams to prove this theorem. Additional constructions are necessary in order to prove this theorem.
4. Angles subtended by a chord of a circle on the same side of the chord are equal.
Figure 2.6: Theorem 3
Students are expected to prove that the angles at C and D are equal, with the help of additional constructions.
25
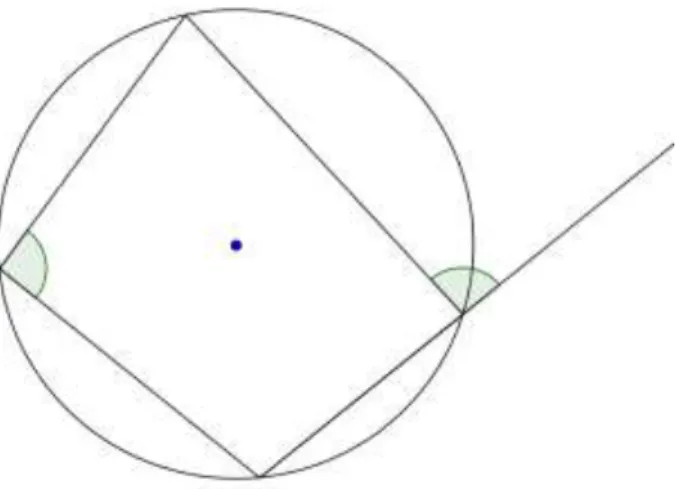
5. The opposite angles of a cyclic quadrilateral are supplementary.
Figure 2.7: Theorem 4
To prove this theorem, students have to pick a pair of opposite angles and then prove that the sum of those angles is 180o; additional constructions are also necessary in order to prove this theorem.
6. Two tangents drawn to a circle from the same point outside the circle are equal in length.
The examination guidelines stipulate that students must be able to apply the theorem but not to prove this theorem.
7. The angle between the tangent to a circle and the chord drawn from the point of contact is equal to the angle in the alternate segment.FF
26
This theorem is commonly known as the ‘Tangent and chord theorem’. Students are expected to prove that the angle DAB is equal to angle ACB.
8. Exterior angle of a cyclic quadrilateral equals the opposite interior angle.
Figure 2.9: Theorem 6
Students are expected to prove that the marked angles are equal.
2.2.2 ICT in mathematics Teaching and learning
The literature review in this section is focused on the role and/or impact of mathematical software, especially GeoGebra in mathematics teaching and learning. I reviewed several research publications that have integrated computer technology, including GeoGebra, in the teaching and learning of mathematics at various levels, ranging from primary education to university education. The aims for this were, among others, to determine whether technology integration had a positive or negative impact on the teaching and learning process, and to identify knowledge gaps in the integration process that need further exploration.
Providing a rich learning environment for students should be every teacher’s priority for successful teaching. Prodromou (2015) discussed the special opportunities for teaching introductory statistics that technology (GeoGebra) offers teachers who aim to provide rich learning experiences to college students. In this study, GeoGebra was integrated into the teaching and learning of introductory statistics, and results indicate that college students were able to perform key statistical investigative tasks, for example, (i) managing data (ii) understanding specific statistical concepts (iii)
27
performing data analysis and inference, and (iv) exploring probability models. Prodromou (2015) strongly recommended the integration of GeoGebra with exploring statistics at college level.
Improvement of student performance in mathematics is largely determined by how effective their teachers are in delivering content to them. Martinovic and Manizade (2013) believe that technology should be used as a partner in the geometry classroom. To support their claim, these authors presented technology-based geometric activities to pre-service teachers, with the aim of promoting pre-service teachers’ mathematical reasoning. They found positive results in which these teachers were able to explore carefully structured activities and engage technological skills that enabled them to develop and evaluate geometric conjectures. The study recognized technology as an important part of developing pre-service teachers’ professional integrity.
Many studies have also focused on the use or integration of dynamic geometry systems (DGS) in the teaching of specific mathematical topics. Strausova and Hasek (2013) investigated dynamic visual proofs using DGS. Their view is that pictures and diagrams play an important role in the process of understanding various mathematical features, and that an appropriate picture or diagram can be used as visual proof of a geometric property or theorem. They argue that non-verbal proofs (proofs without words) are more attractive and acceptable to students than classical proofs. They presented examples of dynamic visual proofs created by dynamic geometry software to secondary school mathematics teachers and students. However, they do acknowledge the weakness of dynamic visual proofs using DGS because in general they do not capture the chain of thought leading to the proof, but focus only on the result.
Karaibryamov, Tsareva and Zlanatov (2012) carried out a study on optimization of courses in geometry by using DGS known as ‘Sam’ (mathematical software). In this study, a new approach to the teaching of synthetic geometry in schools and universities with the help of DGS was used. Their aim was to optimize the teaching process. They reported that their new approach increased the benefits of DGS in the teaching and learning of geometry, especially optimising the education process by
28
saving time involved in drawing, generalizing large groups of problems, and stimulating and helping investigations.
Foster and Shah (2015) explored the process of game-based learning in the classroom through the use of the play, curricular activity, reflection, discussion (PCaRD) model. They carried out a mixed-methods study at high school with control and experimental groups, where they implemented three games with the PCaRD model for a period of one year. Pre- and post-assessments were administered in order to measure achievement gains and motivational changes. Their results indicate that PCaRD aided student learning, and motivated them to learn. They also claimed that PCaRD provided teachers with an adaptive structure of integrating games with their teaching process.
Among many scholars who have investigated the effectiveness of mathematical software is Ertekin (2014). His study sought to investigate the effects of teaching analytical geometry using the software Cabri 3D on teacher trainees’ ability to write the equation of a given special plane, identify the normal vector of a plane and draw the graph of the plane. The software was used with the intention to improve the trainee teachers’ geometric and algebraic competences. The results of this study indicated that students instructed with the software were significantly more successful than those who did not use it, in terms of identifying the equations of special planes and their normal vectors and drawing their graphs.
Swallows (2015), in a case study report titled: ‘The year-two decline: Exploring the incremental experiences of a 1:1 technology initiative’, reported that 1:1 (one-to-one) technology initiatives result in favourable results in the first year, but in subsequent years results decline. This case study’s finding suggests that enthusiasm for the use of technology declines over time, resulting in diminishing favourable outcomes with its continued use.
Design-based research carried out by Donevska-Todorova (2015) on the conceptual understanding of the dot product of vectors in a dynamic geometry environment (DGE), revealed that DGE offers students multiple representations rather than single static representations. This researcher argued that multiple and appropriate combinations of representations are important for students to acquire deeper