MURDOCH RESEARCH REPOSITORY
Kajornrit, J. (2012) Monthly rainfall time series prediction using
modular fuzzy inference system with nonlinear optimization
techniques. In: Postgraduate Electrical Engineering and
Computing Symposium, Perth, Western Australia.
Monthly Rainfall Time Series Prediction using Modular Fuzzy
Inference System with Nonlinear Optimization Techniques
Jesada Kajornrit
School of Information Technology, Murdoch University South Street, Murdoch, Western Australia, 6150
Abstract—Accurate rainfall time series prediction is one of the
important tasks in hydrological study. A conventional time series model such as autoregressive moving average or an intelligent model such as artificial neural network have been used efficiently to perform this task. However, such models are difficult to inter-pret by human analysts because their prediction mechanism is in the parametric form. From the hydrologist’s point of view, the accuracy of the prediction and understanding the prediction model are equally important. This study proposes the use of modular fuzzy inference system with nonlinear optimization technique to predict monthly rainfall time series. The fuzzy infer-ence system is used to generalize the relationship of the rainfall patterns whereas nonlinear optimization method is used to cap-ture the uncertainty in the time dimension. Eight monthly rain-fall time series selected from the northeast region of Thailand are used to evaluate the model. The experimental results showed that the proposed model could be a good alternative method to provide both accurate prediction results and human-understandable prediction mechanism.
Index Terms—Fuzzy Inference System, Monthly Rainfall,
Nonlinear Optimization Method, Northeast Region of Thailand, Time Series Prediction
I.INTRODUCTION
In hydrological study, accurate rainfall time series predic-tion is important since it can provide an extension of the lead-time for the flow forecasting used in reservoir operation and flood prevention. In general, conventional Box-Jenkins mod-els such as Autoregressive Moving Average (ARMA) [1], [3] or intelligent models such as Artificial Neural Network (ANN) [1], [2] have been used to perform this task. However, those models are difficult to be interpreted by human analysts be-cause their mechanism is in parametric form. From a hydrolo-gist’s point of view, the prediction accuracy and the under-standing in the prediction model are equally important.
In order to design the prediction model that the prediction mechanism is easy to interpret and understandable is a chal-lenged task. Two important issues that the model designers have to take care are the dimension of input space and the mechanism to generalize the input-output relationship. In the first issue, basically, human cannot imagine the relationship of data in the high dimensional space. When the input dimension is larger than two, it is difficult for human to visualize the in-put-output relationship. In the second issue, for example, the model such as ARMA or ANN derives the prediction by using mathematical operations of model’s parameters. To interpret the meaning of value of those parameters can sometime be complicated, especially, for the case of ANN where its pa-rameters are connected in the network form.
To address these issues, this study proposes an alternative design of monthly rainfall time series prediction model. The proposed technique can addressed the two issues mentioned and provide accurate prediction results. In the next section, related previous works will be discussed.
II.RELATED AND PREVIOUS WORKS
In the hydrological study, rainfall prediction is relatively difficult than other climate variables such as temperature. This is because of the highly stochastic nature in rainfall, which shows a lower degree of spatial and temporal variability. To address this challenge, soft computing techniques has been adopted in the past decades.
Wu et al. [2] proposed the use of ANN with data pre-processing techniques to predict precipitation data in daily and monthly scale. They applied three pre-processing techniques, namely, Moving Average, Principle Component Analysis and Singular Spectrum Analysis to smoothen the time series data. Somvashi et al. [3] confirmed in their work that ANN pro-vided better accuracy than Autoregressive Integrated Moving Average (ARIMA) models to daily rainfall time series.
Application of soft computing technique to time series pre-diction does not limit only to rainfall data but also other hydro-logical variables such as streamflow modeling [4] and rainfall-runoff modeling [5]. Adaptive Neuro-Fuzzy Inference System (ANFIS) is another popular technique that is applied to hydro-logical time series [6], [7]. However, one disadvantage points of ANFIS is the large number of parameters and computational cost.
In the work of Kajornrit et al. [8], [9], they proposed the modular-based models to address the monthly rainfall predic-tion problems. Their models are developed by fuzzy inference system. In [8], they proposed to decompose the single model into monthly sub-models. The advantage of decomposed model is that the dimension of input vector is smaller. Then the sub-model can be developed easily by Mamdani-type Fuzzy Infe-rence System (MFIS). However, the FIS’s parameters were not well optimized. In [9], Back-propagation Neural Network (BPNN) is used to assists for creating MFIS model. By using BPNN, the MFIS’s parameters are optimized.
However, those two previous models have one disadvan-tage in common, that is, the sub-models perform prediction independently. This could cause the system to loss the capabil-ity of capturing the uncertainty in time dimension. In single models, this problem does not occur because the uncertainty in time is autonomously embedded in the system parameters in the calibrating process. This study tries to address this weak point. This also acts as the improvement over the two Kajorn-rit’s previous models [8], [9].
Fig 1. The case study area is located in the northeast region of Thailand. Eight monthly rainfall time series collected from the eight rain gauge stations.
III.CASE STUDY AREA AND DATASETS
The case study area used in this study is located in the northeast region of Thailand (Fig 1). Eight monthly rainfall time series throughout the study area are used to evaluate the proposed model. The statistics of the datasets is shown in Table 1. The data from 1981 to 1998 were used to calibrate the models and data from 1999 to 2001 were used to validate the proposed models. This study used the models to predict one step-ahead, that is, one month. To validate the models, Mean Absolute Error (MAE) is adopted as given in equation (1). The correlation coefficient of Fit (R) is also used.
𝑀𝐴𝐸 = 𝑚 𝑂𝑖 − 𝑃𝑖
𝑖=1 𝑚 (1)
where Oi and Pi is the observed and the predicted value re-spectively, m is the number of predicted data. The perfor-mance of the proposed model is compared with ARMA and ANN [1], [2], [3], [5], [8], [9].
TABLE I DATASETS’ STATISTICS
Statistics Case 1 Case 2 Case 3 Case 4
Mean 929 1303 889 1286 SD 867 1382 922 1425 Kurtosis -0.045 -0.100 0.808 0.532 Skewness 1.655 0.952 1.080 1.131 Minimum 0 0 0 0 Maximum 3527 5099 4704 6117 Latitude 17.25N 17.15N 16.66N 16.65N
Longitude 101.80E 104.13E 102.88E 104.05E
Altitude 283 176 164 155
Statistics Case 5 Case 6 Case 7 Case 8
Mean 1319 981 1296 1124 SD 1346 976 1289 1153 Kurtosis -0.224 1.229 1.590 1.725 Skewness 0.825 1.154 1.276 0.961 Minimum 0 0 0 0 Maximum 5519 4770 6558 6778 Latitude 15.50N 15.40N 14.63N 15.40N
Longitude 104.75E 102.35E 101.30E 103.40E
Altitude 129 152 476 152
IV.THE PROPOSED MODEL
A. System architecture
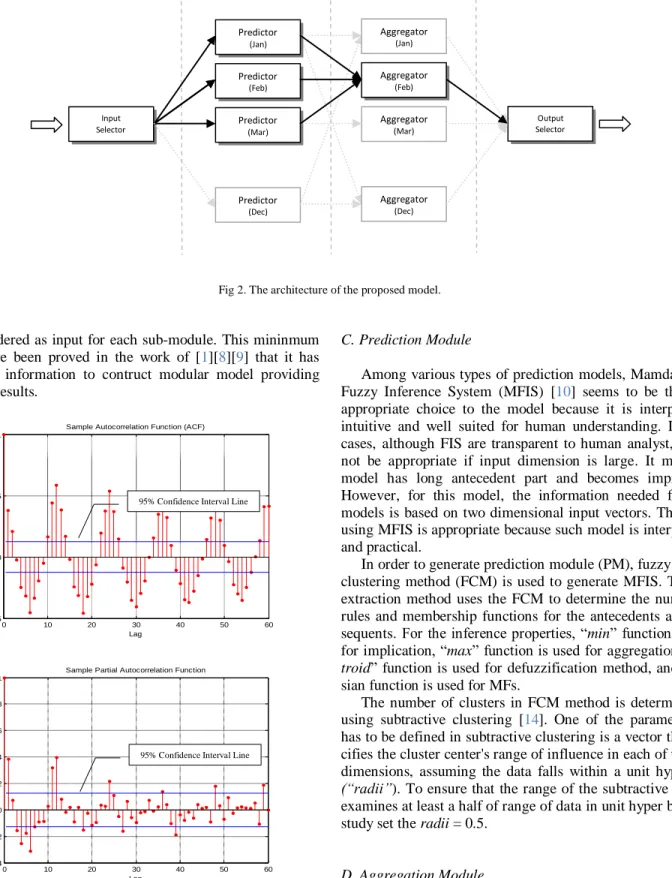
The architecture of the proposed model is depicted in Fig 2. The model consists of input layer, prediction layer, aggrega-tion layer and output layer. The input layer is used to feed the input data into the associated prediction modules. The predic-tion layer consists of twelve predicpredic-tion modules (predictors) associated to the calendar months. The function of these mod-ules is to generalize the input-output relationship of rainfall pattern for the month. The aggregation layer consists of twelve aggregation modules (aggregator) associated to the calendar months which are the same as the prediction modules. The function of these modules is to aggregate the outputs from associated prediction modules by using the combination weights. The output layer is used to derive the final prediction of the system.
An example of the model’s operation is as follows: Sup-posed that the model predicts the rainfall value in February (Fig 2). Firstly, the input selector feeds input data into the as-sociated consecutive predictors (e.g. Feb), previous predictor (e.g. Jan) and next predictor (e.g. Mar). Secondly, the outputs from those predictors are aggregated by associated aggregator (e.g. Feb). Finally, the output selector receives the aggregated output from associated aggregator and provides the final out-put. The principle concept of this design is that the prediction modules work independently, and it may allow the system to capture the uncertainty in time dimension. Therefore, feeding and aggregating data from three consecutive modules is one way to assist the modular model to be able to capture the un-certainty in the time dimension.
B. System Inputs
The objective on predicting rainfall using antecedent val-ues is to generalize a relationship of the following form:
𝑦 = 𝑓 𝑥𝑚 (2)
where 𝑥𝑚 is a m-dimensional input vector representing
rain-fall value with different time lags. Generally, 𝑥𝑚
is not known a priori and there is no consistent theory to define 𝑥𝑚 for soft
computing techniques [4].
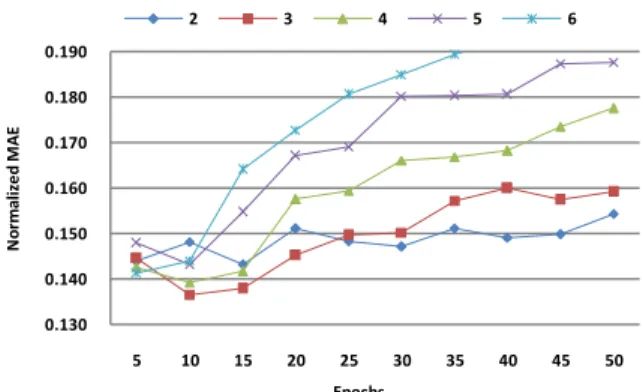
In this study, two statistical methods (i.e. the autocorrela-tion funcautocorrela-tion (ACF) and the partial autocorrelaautocorrela-tion funcautocorrela-tion (PACF)) are employed to guide the dimension m of input vec-tors [4]. The ACF and PACF are generally used in diagnosing the order of the autoregressive process. Fig 3 shows an exam-ple of ACF and PACF of the dataset. ACF exhibits the peak value at Lag 12 and PACF showed a significant correlation at 95% confidence level interval up to lag 12. Therefore, twelve antecedent rainfall values have the most information to predict future rainfall.
However, for the proposed model, the system are decom-posed into monthly sub-modules, 12 lags information may be redundant. This study proposes the use of first lag that cross 95% confidence interval line in PACF as minimum informa-tion for each sub modules. Therefore, two antecedent rainfalls
Thailand N 1 2 3 4 5 6 7 8
Fig 2. The architecture of the proposed model.
are considered as input for each sub-module. This mininmum input have been proved in the work of [1][8][9] that it has sufficient information to contruct modular model providing accurate results.
Fig 3. ACF and PACF of rainfall time series in case 1. (The ACF and PACF of other dataset are rather similar. They are not present all here due to the limited space)
C. Prediction Module
Among various types of prediction models, Mamdani-type Fuzzy Inference System (MFIS) [10] seems to be the most appropriate choice to the model because it is interpretable, intuitive and well suited for human understanding. In some cases, although FIS are transparent to human analyst, it may not be appropriate if input dimension is large. It make the model has long antecedent part and becomes impractical. However, for this model, the information needed for sub-models is based on two dimensional input vectors. Therefore, using MFIS is appropriate because such model is interpretable and practical.
In order to generate prediction module (PM), fuzzy c-mean clustering method (FCM) is used to generate MFIS. The rule extraction method uses the FCM to determine the number of rules and membership functions for the antecedents and con-sequents. For the inference properties, “min” function is used
for implication, “max” function is used for aggregation, “
cen-troid” function is used for defuzzification method, and
Gaus-sian function is used for MFs.
The number of clusters in FCM method is determined by using subtractive clustering [14]. One of the parameter that has to be defined in subtractive clustering is a vector that spe-cifies the cluster center's range of influence in each of the data dimensions, assuming the data falls within a unit hyper box
(“radii”). To ensure that the range of the subtractive method
examines at least a half of range of data in unit hyper box, this study set the radii = 0.5.
D. Aggregation Module
The Aggregation Modules (AM) aggregate the predicted values from three prediction modules by using a combination weight as shown in (3) 0 10 20 30 40 50 60 -0.5 0 0.5 1 Lag S a m p le A u to c o rr e la ti o n
Sample Autocorrelation Function (ACF)
0 10 20 30 40 50 60 -0.4 -0.2 0 0.2 0.4 0.6 0.8 1 Lag S a m p le P a rt ia l A u to c o rr e la ti o n s
Sample Partial Autocorrelation Function
Predictor (Jan) Predictor (Feb) Predictor (Mar) Predictor (Dec) Aggregator (Jan) Aggregator (Feb) Aggregator (Mar) Aggregator (Dec) Input Selector Output Selector
Prediction Layer Aggregation
Layer
Output Layer Input Layer
95% Confidence Interval Line 95% Confidence Interval Line
𝑦 = 𝐾𝑖=1𝑤𝑖𝑦𝑖 (3)
where 𝑤𝑖 ≥ 0, 𝐾𝑖=1𝑤𝑖 = 1 and 𝐾 = 3. Therefore, to
aggre-gate predicted values, combination weights for each module have to be examined.
In this study, constrained nonlinear optimization (
con-strained nonlinear programming) [11] is used to find the
op-timal combination weights. The algorithm attempts to find a constrained minimum of a scalar function of several variables starting at an initial estimate. The algorithm uses a Hessian, the second derivatives of the Lagrangian [12]. The problem can be specified by
min𝑥𝑓 𝑥 𝑠𝑢𝑐ℎ 𝑡ℎ𝑎𝑡
𝐴 . 𝑥 ≤ 𝑏
𝐴𝑒𝑞 . 𝑥 ≤ 𝑏𝑒𝑞 (4)
where 𝐴 . 𝑥 ≤ 𝑏 is set for constrain 𝑤𝑖 ≥ 0 and 𝐴𝑒𝑞 . 𝑥 ≤
𝑏𝑒𝑞 is set for constrain 𝐾𝑖=1𝑤𝑖= 1. For this case, A = [-1 0 0;
0 -1 0; 0 0 -1]; b = [0; 0; 0]; Aeq = [1 1 1]; beq = [1]. The
ini-tial estimate vector is set to [0 1 0]T. In other word, the algo-rithm finds the optimal values of wi that are better than no ag-gregation method. The cost function f(x) which have to be minimized is as follows.
𝑆𝑆𝐸 = 𝑆𝑖=1 𝑤1𝑧1𝑖′ + 𝑤2𝑧2𝑖′ + 𝑤3𝑧3𝑖′ − 𝑧𝑖 (5)
where SSE is error of calibration data, S is number of calibra-tion data, 𝑧𝑖′ is predicted value from PMi and zi is the observed
value.
V.EXPERIMENTAL RESULTS AND ANALYSIS
A Model Calibration
In order to select the optimal ARMA model, Akaike In-formation Criterion (AIC) is adopted [2], [4]. This study gen-erated ARMA models from calibration data by replacing pa-rameter p and q of ARMA model from 0 to 12. The parame-ters that gave lowest AIC value are used for ARMA model. Table II shows the ARMA models for eight datasets.
For ANN or other soft computing techniques, there is no consistent theory to select the model input. However, the work of [4] recommended the use of ACF and PACF to investigate the appropriate inputs. Considering ACF and PACF in Fig. 3, it points out that time series data show autoregressive process up to lag twelve. Therefore, 12-lag inputs seem to be sufficient information for the ANN model.
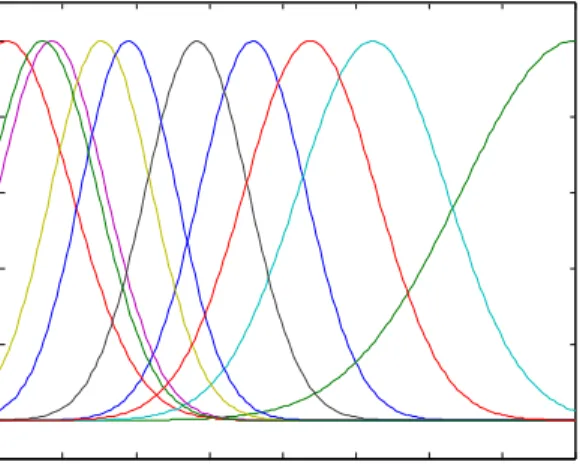
The ANN used in this study is one hidden layer Back-Propagation Neural Network (BPNN). The architecture of the BPNN is twelve input nodes and one output node. The optimal number of hidden node is selected by trial and error procedure. To investigate the optimal number of hidden nodes, calibration data are separated into two parts. The first part is use to train BPNN and the second part is used to test the BPNN. The ex-periment varies the number of hidden nodes from 2 to 6 and repeats 100 times to ensure the results. An example of the result is shown in Fig 4.
TABLE II.
THE SELECTED ARMA MODELS
Case (p,q) AIC Case (p,q) AIC
1 (4,4) 13.417 5 (5,3) 13.751
2 (10,9) 13.982 6 (12,1) 13.536
3 (6,3) 13.379 7 (12,0) 14.334
4 (8,11) 14.182 8 (11,2) 13.850
TABLE III. THE SELECTED BPNN MODELS
Case (p,q,r) Case (p,q,r)
1 (12,3,1) 5 (12,2,1)
2 (12,2,1) 6 (12,3,1)
3 (12,3,1) 7 (12,2,1)
4 (12,3,1) 8 (12,3,1)
From the experiment, the number of two or three hidden nodes could provide the minimum error. Table III summarize the architecture of BPNN for eight datasets (p, q and r are re-ferred to number of input, hidden, output nodes). Furthermore when the number of training epoch larger than 15, the error became increasing. Then, the number of epoch was limited to 15. Since the accuracy of BPNN depends on the initial random weights, to crate the BPNN model for comparison, this study generate 100 BPNN models and select the model that provided MAE closest to the average MAE of those 100 models.
B Model Evaluation
Table 4 and 5 show MAE and R measures of validation pe-riod respectively. Mod FIS-ORG is the proposed model with-out aggregation layer and Mod FIS-OPT is the proposed mod-el. In the last column, Relative MAE (RMAE) is the average of normalized MAE of all cases. Similarly, RCOR is the aver-age of R of all cases.
Overall, prediction accuracy could be range from high to low as Mod FIS-OPT > Mod FIS-ORG > ARMA > ANN. ANN provided highest MAE in 6 cases; whereas ARMA showed highest MAE in 2 cases. In this study, ARMA deem to be more appropriated than ANN for the single model. For Mod
FIS, the prediction accuracy has significantly improved from single models. This showed that modular concepts could be seen as an effective way to monthly time series. In modular model, Mod FIS-OPT showed lowest error in 6 cases and showed compatible results to Mod FIS-ORG in 1 case. There
Fig 4. An example of MAE of testing data in BPNN process
0.130 0.140 0.150 0.160 0.170 0.180 0.190 5 10 15 20 25 30 35 40 45 50 N o rm al ize d M A E Epochs 2 3 4 5 6
TABLE IV
MEAN ABSOLUTE ERROR (MAE) OF VALIDATION PERIOD
Model TS353001 TS356010 TS381010 TS388002 TS407005 TS431008 TS431020 TS432004 RMAE
ARMA 688 626 529 707 823 560 671 471 0.562
ANN 526 631 551 793 806 648 736 592 0.581
Mod FIS - ORG 430 501 406 609 601 486 636 404 0.447
Mod FIS - OPT 458 457 364 602 602 456 549 392 0.427
TABLE V
CORRELATION COEFFICIENT (R) OF VALIDATION PERIOD
Model TS353001 TS356010 TS381010 TS388002 TS407005 TS431008 TS431020 TS432004 RCOR ARMA 0.539 0.787 0.543 0.797 0.666 0.587 0.466 0.776 0.645
ANN 0.731 0.761 0.572 0.740 0.656 0.465 0.371 0.664 0.620
Mod FIS - ORG 0.813 0.872 0.696 0.873 0.791 0.681 0.663 0.824 0.777
Mod FIS - OPT 0.816 0.859 0.721 0.877 0.791 0.693 0.683 0.830 0.784
is only 1 case that Mod FIS-ORG is better than Mod FIS-OPT. It seems that adding aggregation layer to original model could improve the prediction accuracy. Overall, the results from R and MAE measures seem to be consistent.
In single model, ANN is not appropriate to the problem since it provided the lowest prediction accuracy. The week point of ANN for this problem is that ANN needs a lot of training data. In this case study, the calibration data is consid-ered small. This could be the reason why ANN did not per-form well for this case. In the work of [8], they showed that increasing the number of training set could improve the accu-racy of ANN. Another possible reason is that the time series used in this study is periodic. Wu et al. [2] has also provided similar observation in their study, in which ANN performed well on daily rainfall data but not in the monthly rainfall data.
Considering the Mod FIS–ORG models, the prediction ac-curacy is improved significantly from single models. In the modular design, each sub-model handles only a part of the data, thus reducing the heterogeneity and the complexity of the data. One advantage of Mod FIS-ORG is that it takes only
Fig 5. An example of the input-output relationship of rainfall time series of one prediction module.
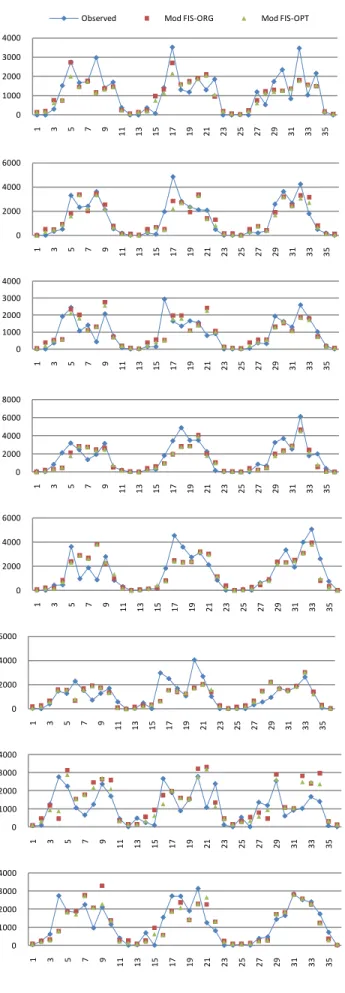
two lags as input information for each PU. This also allows the dimension of input data to decrease to a level that human analysts can understand. Fig 5 shows an example of input-output relationship in 3 dimensional spaces. Another advan-tage is that the number of fuzzy rule and MFs decreases to the level that is more practical for human to handle. Fig 6 shows an example of MFs in sub-model and the number of fuzzy rules related to the example is only ten.
In Mod FIS–OPT, the prediction accuracy has improved from Mod FIS–ORG. This improved accuracy is gained from the aggregation layer. In Mod FIS-ORG, twelve sub-modules work independently. The final prediction value is selected directly from one sub-module. This model could not capture the uncertainty in time dimension. In Mod FIS-OST, input data are feed into three consecutive prediction modules and are aggregated later. With the proposed aggregation module, it can detect a certain degree of uncertainty between them. Fig 7 shows the observed and predicted values of eight cases.
Fig 6. An example of membership functions of the first input of one of Ma-dani-type FIS prediction module
0.4 0.6 0.8 1 0.1 0.2 0.3 0.4 0.5 0.25 0.3 0.35 0.4 0.45 in1 in2 o u t1 0.3 0.4 0.5 0.6 0.7 0.8 0.9 1 0 0.2 0.4 0.6 0.8 1 in1 D e g re e o f m e m b e rs h ip
Fig 7. The predicted values of Mod FIS-ORG and Mod FIS-OPT from case 1 to case 8 respectively.
VI.CONCLUSION
Accurate rainfall prediction is an important task in hydro-logical study. Conventional time series models or intelligent models have been used to perform this task. However, such models are difficult to interpret by human analyst because their mechanism is normally in parametric form. Furthermore, high dimensional input data could cause the model to be im-practical. This study proposed the use of modular model to address these problems for monthly rainfall time series pre-diction. Fuzzy inference system is used to capture input-output relationship of rainfall data whereas nonlinear optimi-zation technique is used to capture uncertainty in the time dimension. In term of prediction accuracy, eight monthly rain-fall time series from the northeast region of Thailand have been used to evaluate the proposed model. The experimental results showed that the proposed model provided higher pre-diction accuracy than autoregressive moving average and back-propagation neural network and the modular model without aggregation layer.
REFERENCES
[1] H. Raman, N. Sunilkumar, “Multivariate modeling of water resources time series using artificial neural network,” Hydrological Sciences–
Journal-des Sciences Hydroligiques, vol. 40, pp.145-163, 1995.
[2] C. L. Wu, K. W. Chau, and C. Fan, “Prediction of rainfall time series using modular artificial neural networks coupled with data-preprocessing techniques.” Journal of Hydrology, vol. 389, pp.146-167, 2010.
[3] V. K. Somvanshi, et al., “Modeling and prediction of rainfall using artificial neural network and ARIMA techniques.” J. Ind. Geophys. Un-ion, vol. 10, no. 2, pp. 141-151, 2006.
[4] W. Wang, K. Chau, C. Cheng and L. Qiu, “A comparison of perfor-mance of several artificial intelligence methods for forecasting monthly discharge time series.” Journal of Hydrology, vol. 374, pp. 294-306, 2009.
[5] A. K. Lohani, N. K. Goel and K. K. S. Bhatia, “Comparative study of neural network, fuzzy logic and linear transfer function techniques in daily rainfall-runoff modeling under different input domains.”
Hydro-logical Process, vol. 25, pp. 175-193, 2011.
[6] P. C. Nayak, et al., A neuro-fuzzy computing technique for modeling hydrological time series, Journal of Hydrology, vol. 291. pp. 52-66, 2004.
[7] M. Z. Kermani and M. Teshnehlab, “Using adaptive neuro-fuzzy infe-rence system for hydrological time series prediction.” Applied Soft Computing, vol. 8, pp. 928-936, 2008.
[8] Kajornrit, J., Wong, K, W., Fung, C. C., “Rainfall Prediction in the Northeast Region of Thailand using Modular Fuzzy Inference System”,
In Proc. IEEE World Congress on Computational Intelligence, 2012.
[9] Kajornrit, J., Wong, K, W., Fung, C. C., “Rainfall Prediction in the Northeast Region of Thailand using Cooperative Neuro-Fuzzy Tech-nique”, In Proc. The 8th International Conference on Computing and
In-formation Technology, 2012.
[10] E. H. Mamdani, and S. Assilian, “An experiment in linguistic synthesis with fuzzy logic controller,” International journal of man-machine stu-dies, vol. 7 no. 1, pp.1-13, 1975.
[11] Optimization toolboxTM – User’s guide R2008b, Matlab [12] Fuzzy Logic toolboxTM – User’s guide R2008b, Matlab
[13] Byrd, R.H., J. C. Gilbert, and J. Nocedal, "A Trust Region Method Based on Interior Point Techniques for Nonlinear Programming,"
Ma-thematical Programming, Vol 89, No. 1, pp. 149–185, 2000.
[14] P. C. Nayak, K. P. Sudheer, “Fuzzy model identification based on clus-ter estimation for reservoir inflow forecasting.” Hydrological Processes, vol. 22, pp. 827-841, 2008. 0 1000 2000 3000 4000 1 3 5 7 9 11 13 15 17 19 21 23 25 27 29 31 33 35
Observed Mod FIS-ORG Mod FIS-OPT
0 2000 4000 6000 1 3 5 7 9 11 13 15 17 19 21 23 25 27 29 31 33 35 0 1000 2000 3000 4000 1 3 5 7 9 11 13 15 17 19 21 23 25 27 29 31 33 35 0 2000 4000 6000 8000 1 3 5 7 9 11 13 15 17 19 21 23 25 27 29 31 33 35 0 2000 4000 6000 1 3 5 7 9 11 13 15 17 19 21 23 25 27 29 31 33 35 0 2000 4000 6000 1 3 5 7 9 11 13 15 17 19 21 23 25 27 29 31 33 35 0 1000 2000 3000 4000 1 3 5 7 9 11 13 15 17 19 21 23 25 27 29 31 33 35 0 1000 2000 3000 4000 1 3 5 7 9 11 13 15 17 19 21 23 25 27 29 31 33 35