Economics Working Paper Series
2020/004
The Gravity Model of Forced Displacement
Using Mobile Phone Data
Michel Beine, Luisito Bertinelli, Rana Comertpay, Anastasia Litina,
and Jean-Francois Maystadt
The Department of Economics
Lancaster University Management School
Lancaster LA1 4YX
UK
© Authors
All rights reserved. Short sections of text, not to exceed two paragraphs, may be quoted without explicit permission,
provided that full acknowledgement is given. LUMS home page: http://www.lancaster.ac.uk/lums/
The Gravity Model of Forced Displacement
Using Mobile Phone Data
Michel Beine
1, Luisito Bertinelli
2, Rana C¨
omertpay
3, Anastasia Litina
4, and
Jean-Fran¸
cois Maystadt
51,2,3
Department of Economics and Management, University of Luxembourg, L-1359 Luxembourg
4
Department of Economics, University of Ioannina, University Campus, 455 00, Ionnina Greece
5Institute of Development Policy, University of Antwerp, Antwerp, Belgium; and Lancaster University
Management School, Department of Economics, Lancaster, LA1 4YX, UK
March 30, 2020
Abstract
Based on geolocalized mobile phone calls data, we study the mobility of refugees in Turkey. We employ a gravity model to estimate the determinants of refugee movements across 26 regions in 2017. To benchmark our findings, we estimate the same model for the mobility of individuals with a non-refugee status. Beyond the standard determinants such as the levels of income at origin, at destination and distances across regions, we find that networks, provision of humanitarian aid and asylum grants are important determinants of refugee mobility. Our paper deepens our understanding on how forcibly displaced people may respond to economic, social and political factors in their location decision.
Keywords: Refugee Mobility, Gravity Model of Migration, Forced Displacement, Mobile Phone Data, News Media, Poisson Pseudo-Maximum Likelihood
1
Introduction
The Global Compact for Refugees, adopted in 2018, highlights the importance of mobility to find durable solutions to protracted refugee situations. Nonetheless, the determinants of the mobility of forcibly displaced populations remain scarcely studied. Understanding human mobility in complex emergencies is essential for both operational and methodological reasons. For the former, understanding how displaced population make their mobility decisions may help relief operations to better target those in need of assistance. For the latter, researchers investigating the consequences of forced displacement on hosting areas have either assumed that forcibly displaced people choose their location in a quasi-random way (Godøy, 2017; Gr¨onqvist et al., 2012) or have overlooked the dynamic nature of such location decision. Anecdotal evidence suggests that for instance, refugees may move multiple times within their country of asylum (Bose, 2013, 2014).
Turkey is an interesting case to study the mobility of forcibly displaced people within a country of asylum. The movement of Syrian refugees in Turkey started in 2011 as a result of the Syrian Civil War. Currently the official statistics report approximately 3.6 million refugees (UNHCR, 2019a). The ongoing conflict induced many refugees to remain in Turkey while others moved to farther European countries. According to official figures, approximately 30% of the Syrian population lives in government–run camps while the rest are dispersed within the country and lives outside of camps. While the Turkish law does not grant relocation rights but only temporary protection status, yet this temporary status is accompanied with the right to apply for a work permit in certain areas and certain professions. As such, internal mobility within the borders of Turkey is rather free for Syrian refugees. In some cases, relocation has even been encouraged in an attempt to close down and relieve some camps (UNHCR, 2019b). As reviewed by Maystadt et al. (2019), there is an emerging literature assessing the impact of refugees on the hosting economies, including Turkey (Ceritoglu et al., 2017; Tumen, 2016) but little attention has been given to the determinants of the mobility of refugees in this country.
In our study, we aim at gaining a better understanding of the mobility of refugees within Turkey, thereby extending and complementing Beine et al. (2019). We exploit geolocalized call detail records provided by Salah et al. (2018) within the Data for Refugees Turkey (D4R) challenge. More specifically, we look at the location of 100,000 randomly selected mobile transactions (involving
50,000 refugees and 50,000 non-refugees) recorded by cell towers to define likely decisions to move across 26 regions in Turkey. Computing bilateral migration flows at quarterly frequency and at regional level, we apply a gravity model to understand the main determinants of refugee movements. We contrast our findings regarding the determinants of mobility with those of non-refugees in Turkey that can be seen as a placebo analysis. Our empirical findings suggest that distance, levels of GDP at origin and at destination, and network effects likely confer a statistically significant effect on refugees’ mobility decisions. We find that distance matters more for refugees than for non-refugees, in line with some stylized facts previously documented World Bank (2018). Non-refugee population moves not only more but also longer distances than the refugee population. Moreover, we find that for non-refugees, income acts as a pull factor at destination only while for refugees, a low income at origin also acts as a push factor.
We further extend the standard gravity model by considering an additional set of determinants of refugee mobility that captures the social and political conditions in the host and the origin region. The integration of refugees is a major challenge for many countries especially for a country like Turkey which hosts more than three million refugees. As such, regional conditions as reflected in the news about violence, protests, provision of aid and asylum grants can act as push or pull factors. Analytically, we find that humanitarian aid and asylum grants are discouraging refugees from migrating.
Beyond the relevance of our study for relief operations, our contribution is threefold. First, we contribute to an emerging literature exploiting mobile phone data to characterize human mobility in emergency situations. Given their elusive status, there are no reliable data such as administrative data or censuses capturing the internal mobility of refugees. Existing studies relying on phone data have focused on mobility responses to natural disasters (e. g. Blumenstock et al., 2016) and predicting disease propagation (e. g. Wesolowski et al., 2012).1 The mobile phone data allows to overcome the lack of data on population displacement and to analyze mobility patterns among refugees (and non-refugees to benchmark our results).
Second, the economic literature has widely focused on the gravity model to model migration decisions (Ravenstein, 1985, 1989). Despite its simplicity, the gravity model has shown impressive 1This strand of the literature builds upon advancements over the last two decades on the use of new technologies
such as remote sensing, geographical information systems, and global positioning systems to study mobility patterns in non-emergency contexts (Deville et al., 2014).
predictive power, making it an essential tool for forecasting exercises between and within countries (Crozet, 2004; Mayda, 2010; Garcia et al., 2015; Beine et al., 2016). The gravity model has identified as the main determinants of migration the differentials in employment opportunities and income per capita between the areas of origin and destination, together with the geographical and cultural distance, as proxies for higher migration costs. Migrant networks are also identified as reducing the cost of migration (Beine et al., 2011). However, the applicability of the gravity model to forcibly displaced people is limited to international movements of asylum-seekers to OECD countries (Hatton, 2009, 2016, 2017). Overall, it seems that the same set of factors explains the movements of economic migrants and refugees across countries, albeit with different intensities. In particular, geographical and political factors have stronger weight for refugees or asylum-seekers compared to economic ones. Such conclusion is confirmed in the cross-sectional analysis of the gravity model proposed by the World Bank (2018). The applicability of the gravity model to forced displacement shows that the forced nature of population movement should not hide the potential agency played by forcibly displaced people in their migration decision (Ib´anez, 2014; Maystadt et al., 2019). However, the cross-country nature of this literature is limited in shedding light on the determinants of mobility in complex emergencies. To the best of our knowledge, we are the first ones to apply the gravity model to the mobility of forcibly displaced populations within a recipient country in conjunction with highly disaggregated phone data that allows to track people in a consistent way.
Last, we shed light on non-standard determinants of migration by further enriching the phone data with news media at the regional level. We therefore contribute to another strand of the literature that has augmented the gravity model of migration to political factors such as the generosity of the welfare state (Razin and Wahba, 2015), the restrictive nature of the migration policies at destination (Mayda, 2010), or the occurrence of terrorism and civil war (Naud´e, 2010; Dreher et al., 2011). Recently, Arif (2019) studies a wide range of factors among 103 source and destination countries between 1990 and 2000 and stresses the importance of institutional factors (e. g. economic freedom) as push and pull factors. Even within countries, such non-economic factors play a role in migrants’ choice of destination within countries (Brauw and Giles, 2006; McKinnish, 2007). Our use of news-related events underlines the importance of social and political conditions for the vulnerable population. The policy implications are direct as we can trace
mobility reactions to particular events. The incidence of events can be easily associated with policies aimed to relief refugees, foster employment and political measures and hence, ensure political and social stability. Indeed, in addition to standard results of gravity model, we show that events related to asylum granting, humanitarian and economic aid are among the determinants of refugee mobility in Turkey. Violent protests do not seem to matter much in the decision to migrate by refugees.
The remainder of our paper is structured as follows. Section 2 describes the empirical strategy we use in this report. Section 3 presents the data (Section 3.1) and some descriptive statistics to help understand better the sample of our study (Section 3.2). Section 4 provides the empirical results for our main research question (Section 4.1) and shows that our findings survive various robustness tests (Section 4.2). Section 5 elaborates more on our empirical findings and studies the impact of refugee networks on their mobility (Section 5.1), mobility of non-refugees (Section 5.2) and the effect of news media on the mobility of refugees (Section 5.3). Section 6 provides some implications for policy and concludes. All tables and figures to which we refer are relegated to Section 7. Additional references are included in Section 8, the Appendix, at the end of the paper.
2
Methodology
We base our empirical strategy on the utility maximization approach, proposed by Roy (1951), and further extended by Grogger and Hanson (2011) and Beine et al. (2011). The model has been frequently applied to migration (Beine et al., 2016). It is based on agents’ decision to migrate in order to maximize their well-being, and leads to the pseudo-gravity framework, which can be readily estimated. The model predicts that migration flows can be expressed as follows:2
Modt=
eln(ydt)+sdt−φodt
Σkeln(ykt)+skt−φokt
(1)
where Modt is the expected migration flows between origin o and destination dat time t;
φodtrepresents the accessibility of locationdfor potential migrants (i. e. migration costs);ydt
2Beine et al. (2016) detail the derivation of the random utility maximization model of migration providing
represents the attractiveness of locationdin terms of utility (e. g. expected wage, ...);sdt, the
ability of locationoto send migrants (e. g. public expenditures, ...); andkstands for all locations, other than o, i. e. potential destinations. The parameters of the model can then be estimated after a logarithmic transformation.
In our application, we are estimating these parameters over a relatively short time-frame, spanning January to December 2017. We can derive the following specification:
ln(Modt) =β0ln
ydt
yot
+γ0sdt−δ0sot−φodt+εodt. (2)
where εodt=φo+ψd+πt+εodt can measure origin, destination and time fixed effects as
well as combination thereof, and an independent and identically distributed (iid) error term. In our analysis,Modt represents the bilateral mobility flow of refugees between regions of origino
and destinationdat quartert. φodt will take account of the cost of moving todfor potential
candidates to mobility in regiono. ydt andyot capture both pull and push factors in regionsd
(resp. o) and are proxied by regional income levels. Time fixed effects are introduced to correct for seasonality in migration patterns and to capture the influence of time-varying global factors. Finally, given the large number of zeros in the bilateral migration flows, relying on standard estimation techniques (e. g. OLS) would likely lead to inconsistent coefficient estimates. As widely adopted in the literature on the bilateral determinants of migration (Beine et al., 2016), we call upon Poisson regression models that relies on pseudo maximum likelihood estimates (Santos Silva and Tenreyro, 2006; Santos Silva and Tenreyro, 2011).
3
Data and Descriptive Statistics
We first describe our data in Section 3.1. Second, we provide some descriptive statistics that will help visualize and therefore better explore our sample in Section 3.2 .
3.1
Data
The D4R Challenge and Constraints. The source of our data is the D4R, a non-profit challenge with the aim of improving the living conditions of Syrian refugees currently residing in Turkey. T¨urk Telekom (TT)3, in collaboration with the Scientific and Technological Research
Council of Turkey and Bo˘gazi¸ci University, along with other academic and non–governmental organizations, organized an anonymized dataset of mobile call detail records (CDRs) of phone-calls and SMS messages of TT customers. The data collected and provided by the company cover the time period between 1st January 2017 to 31 December 2017.
The D4R provide three distinct datasets. Dataset 1 (Antenna Traffic) includes one year site-to-site traffic on an hourly basis and it provides information about the traffic between each site for a year period. A prerequisite is of course that one of the involved parties is registered with TT and in this case the information is available only for the TT customer. Information such as the total number of calls and total duration of the calls are available only in an aggregate format. This information is available both for voice calls and SMS messages. While no personal characteristics are revealed, there is information on the total number and the total duration of refugee calls and SMS by antennae.
Dataset 2 (Fine Grained Mobility) randomly chooses a group of active users (who make calls and send SMS) every two-week period and reports cell tower identifiers. This random-sampling process is repeated for the whole year period. As in Dataset 1, there is no personal information revealed, beyond the refugee or non-refugee status. The dataset provides information about the base station ID, whether the call or SMS is incoming or outgoing as well as the day and hour.
Dataset 3 (Coarse Grained Mobility) is a randomly selected dataset of 50.000 refugees and 50.000 non-refugees that is being followed throughout the whole year. To ensure privacy the data is provided with reduced spatial resolution, i. e. at the district (rather than the antenna which was the case in the other datasets) level. There is information on whether the call belongs to a refugee or not as well as the day and time of the call. This is the main dataset that we employ in our analysis in order to construct the refugee mobility measures aggregated at the regional level.
3Formerly state-owned, TT is the first integrated telecommunications operator in Turkey. Vodafone and
Turkcell are the two other operators in Turkey. As of the fourth quarter of 2016, TT, Turkcell and Vodafone have respectively a subscriber market share of 30%, 45% and 25% (T¨urk Telekom, 2019).
The D4R dataset is collected from a sample of 992,457 TT customers. 184,949 are identified as refugees and 807,508 as Turkish citizens. The D4R challenge is a unique initiative that allows to study various aspects associated with refugee mobility. However, addressing such a sensitive issue is a major challenge and maximum protection of personal data is a prerequisite. To this end the data comes with several restrictions and shortcomings. First, to ensure the anonymity of the phone users, all the above mentioned datasets are totally unrelated to each other. As such, their combined value-added lies mostly in the aggregation of the data at some unit higher than the antenna. Second, the data provider highlights that the term “refugee” is entailing to asylum seekers, migrants, and any individual that may have a “temporarily protected foreign individual” ID number in Turkey. Third, we cannot be sure if the actual caller is indeed a refugee or a non-refugee. While not much is revealed concerning the individual characteristics of the customers, we know approximately 25% of the refugee customers are identified as “female” and the remaining 75%, as “male”. It is not clear though whether this allocation represents the actual use of the phone. While they register with their refugee cards in order to connect, there is no guarantee on who is eventually using the phone. It is however more likely that refugees may use non-refugee phones rather than vice versa (refugee contracts have more limitations with respect to the number of calls they can do). Fourth, we cannot exclude noise in the exact location of the call. In some cases, the antenna location may not be precise as a line might connect to a different antenna due to the capacity of the network. Last, missing data is another concern as in some cases whole days of data may not be reported in the dataset (Salah et al., 2018).
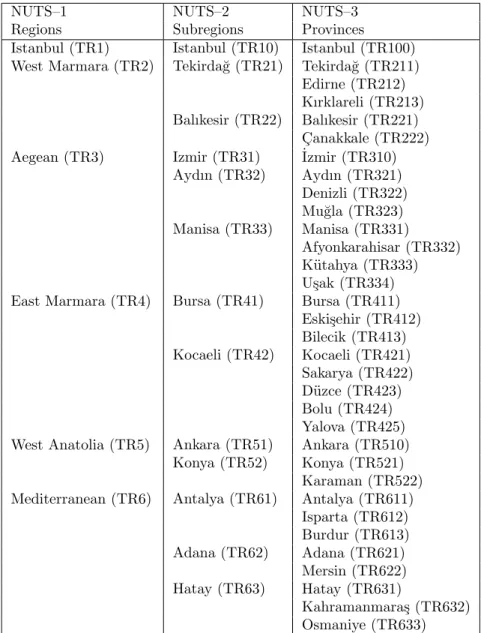
For all the above reasons and given the scope of our research, we use the Nomenclature of Territorial Units for Statistics (NUTS) by Eurostat. Similar to a large literature in regional studies applied to the EU regions (Combes and Overman, 2003; Crozet, 2004; Hirschle and Kleiner, 2014; Fischer and Pfaffermayr, 2018), we conduct our analysis at the NUTS–2 administrative level, i. e. for 26 regions in Turkey.4 More recently, Mitze (2019) finds a stronger explanatory power of local labor markets conditions during the global financial crisis at the NUTS–2 level, compared to NUTS–3 level. We also aggregate the data over time, i. e. we construct quarterly measures of mobility. This approach mitigates most of the above mentioned concerns. First, it allows us to combine information and construct measures from D4R datasets. Second, it summarizes flows to
other NUTS regions irrespectively of who is using the phone (it could thus capture movement of the whole family). And last, it resolves imprecise location concerns since the data at NUTS–2 level is very accurate. It also mitigates the concern from the absence of reporting data on a daily basis. This level of aggregation is also in line with our research question. Since we want to capture “internal migration” flows, the desirable property of our geographical unit of analysis is that it is not too small, in which case it could potentially capture commuting flows or regular social exchange patterns. As such we chose NUTS–2 which balances the trade-off between a sufficiently large unit of analysis and a large number of observations. Last, the NUTS–2 level allows us to combine our constructed measure of mobility with high quality administrative data available at quarterly level as well.5
A last concern about the D4R data is that while the sample of refugees is representative, it may not be the case for non-refugees who are sampled based on the sample of refugee customers. While it is unclear whether this sampling process generates any systematic bias in the data, we focus our analysis on the refugee population to understand the determinants of their internal migration. While we benchmark the analysis using the sample of non-refugees, we undertake this exercise only for comparison reasons. This is also in line with our research contribution, i. e. the gravity model for the refugee population, since the gravity model for natives has been extensively analyzed in the relevant literature.
Dependent Variable: Refugee Mobility. Our main variable is the measure of mobility, which we construct using Dataset 3, i. e. the dataset that follows 50,000 refugees and 50,000 non-refugees throughout the whole year. We construct migration rates at the NUTS–2 level and at a quarterly frequency. The migration rate has the formMigration Rate ‘r’ ‘i’ where‘r’ refers to the refugee (i. e. R) or non-refugee (i. e. NR) status of the observation, and‘i’ corresponds to the minimum number of calls generated from a given province to characterize the latter as the residence location (i. e. frequency filter of‘i’ calls, in our case, we set‘i’=10).6 To increase the likelihood our measure properly reflects mobility in the location of residence and not in the workplace, we restrict our analysis to calls that take place only between 8 pm to 8 am, i. e. hours
5Our results are robust to defining mobility at NUTS–1 (larger) and NUTS–3 (smaller) regional levels. We
report our results in Section 4.2.
6Under Section 5.2, we test the robustness of our analysis using a stricter mobility measure, i. e. with a
that are less likely to be working hours, following the usual approach in this literature using phone data (Blumenstock et al., 2016).
Finally, we compute mobility between quarters based on a migration rate Nij
Nii where Nij
corresponds to leavers andNii to stayers. As mobility is observed at the quarter frequency, it
represents movers between quarterst−1 andt. By construction, any explanatory variable in our analysis is therefore measured prior to the mobility at quartert.
Standard Gravity Model Determinants. We employ two main sets of determinants of mobility. First, we use the standard gravity model controls, i. e. variables that relate to the attractiveness (resp. repulsiveness) of regiond(resp. o) for prospective refugees, the so-called pull (resp. push) factors.
At the NUTS–2 level we have systematic regional GDP data also available at the quarterly level. Host and origin regional GDP constitute standard push or pull factors according to the gravity literature. We obtain data on regional GDP from the Turkish Statistical Institute (TUIK).
Proximity between pairs of NUTS–2 regions is measured using geodesic distances, i. e. the length of the shortest curve between two points along the surface of a mathematical model of the earth, based on the centroid coordinates.7 Distance here captures practical difficulties of moving across these regions.
Refugee Networks. Networks at the destination province also play a key role in reducing migration and assimilation costs (Beine et al., 2011). Networks constitute an essential pull factor as they are likely to provide information or financial support to newcomers (Munshi, 2003; Beaman, 2012; Dagnelie et al., 2018). In the absence of official measures for refugee networks at the region-quarter level, we proxy such existing networks and their size by the relative number of calls from refugees. We construct this variable from Dataset 1 provided by Salah et al. (2018) where we compute the number of calls from refugees over the number of total calls per NUTS–2 region in a given quarter.
News Media. While the first set of controls is related to the standard gravity model, we further extend our model to figure out other potential determinants that are of particular interest to the case of refugees. We expect refugees to be a vulnerable group and to be hardly integrated
7The centroid coordinates are based on the WGS 1984 datum and we rely on Vincenty (1975) equations to
in most areas. As such, the broader social situation in the region where they live is very likely to affect their decision to relocate. While regional conditions may as well affect natives’ decision to migrate internally, they are expected to be more “immune” to these conditions on average as they have deeper roots and can resort to alternative solutions.
To capture the implications of social conditions at the regional level we explore an additional set of explanatory variables. We use the Global Database of Events, Language and Tone (GDELT) dataset, a world-wide news media platform that is available for over 30 years, in over 100 languages and is updated daily to construct a number of indices related to the incidence of news that could directly or indirectly concern the refugee population (GDELT, 2019). The database consists of over a quarter billion geo-referenced event records in over 300 categories. The platform is open for research and analysis. It uses the Conflict And Mediation Event Observations (CAMEO) system where a code corresponds to a type of event and is defined in a three-level taxonomy. Each observation provides information in several layers. For instance, every observation has information about the location, the involved actors, the impact of the event, the type of action, to mention a few of the available categories. Another element available in GDELT that is essential for our analysis is the tone of the news, i. e. whether it has a negative or a positive connotation for the refugee population. Since the same type of news may have a different effect depending on the tone, we also aggregate the news based on the tone.
With respect to location, each observation provides latitude and longitude, thus the data are being reported at a very fine level. Using the geographic information system (GIS), we are able to construct our events variables at the NUTS–2 level, in line with our main analysis. Moreover, the news coverage also has time variation at a fine level and we can thus construct the same measures at the quarterly level between January 2017 and December 2017. Using the EVENT Record Exporter tool8 provided by GDELT, we first obtain all events that took place in 2017 in Turkey. GDELT reports 768,751 such observations. Of those events, 245,249 are reported to have occurred at a national level and 36,378 were not being assigned a specific location. We therefore exclude those observations.
8The EVENT Record Exporter allows to export small subsets of data from the GDELT Event Database that
match the search criteria. By specifying a set of criteria for the event type and actors involved, along with an optional date range, the system will search the entire GDELT Event Database for all matching entries and export matching records as a CSV file (GDELT, 2014).
GDELT provides information about several types of news. Of course, not all categories are relevant for the scope of our analysis. We thus create variables for news that are relevant to the refugee population. In particular we have chosen the following categories: violent protest; economic aid; humanitarian aid and asylum grants. In GDELT, an event is given an id GlobalEventID
and there exists a variableEventBaseCode which shows to which category this particular event belongs to.
Analytically, the aid variables in our dataset indicate news that either are humanitarian or economic and are provided in NUTS–2 region d(resp. o) at quarter q. Aid is crucial as it eliminates or at least partially alleviates financial concerns. In terms of interpretation, events related to humanitarian and economic aid are also related to the literature showing that welfare benefits may attract or retain potential migrants (Razin and Wahba, 2015). Political factors have also been found to matter in other contexts. For instance, violent events have been found to constitute important push and pull factors for international migration (Naud´e, 2010). Researchers from various disciplines have also been interested in measuring the impact of national policies on asylum seekers’ health (Steele et al., 2002; Mills, 2012; Ziersch et al., 2017). A study from Greyling (2016) finds that government assistance, culture, economic factors, crime, refugee status, reasons for leaving the home countries, time spent and number of people staying in a house in the host country are all policies that affect asylum seekers in South Africa. We therefore augment the specification with variables capturing political factors such as protest against the local authorities. Violent protests in our analysis should capture such political determinants of location choice by refugees. Last, the news for asylum grants are directly linked with policy considerations that have a direct impact on the decisions of refugees and their ability to integrate and to move freely around the country. Events related to the granting of asylum status can also be directly interpreted as a possible change in expectations (Cortes, 2014) and therefore, local integration at origin or destination. We should acknowledge that the interpretation given to these hypothesized drivers are subject to discussion and that a lack of evidence may be due to measurement errors. Nonetheless, the extension of the gravity model to political factors allows us to compare our results to a recent and growing literature on international migration.
We aggregate these 4 types of events quarterly and at the NUTS–2 level. For events categorized as economic aid, humanitarian aid and asylum grants, we focus on those with a positive tone to
ensure that selected events relate to actual provisions of aid, whereas for the events categorized as violent protests, we focus on those with a negative tone to ensure that selected events relate to protests. Imposing such restrictions, we end up with 9,808 aid events and 6,670 protest events. Among the 9,808 aid events, 2,170 relate to economic aid, 1,414 to humanitarian aid, and finally 610 to asylum grants. Among the 6,670 protest events, 315 events relate to violent protests.
3.2
Descriptive Statistics
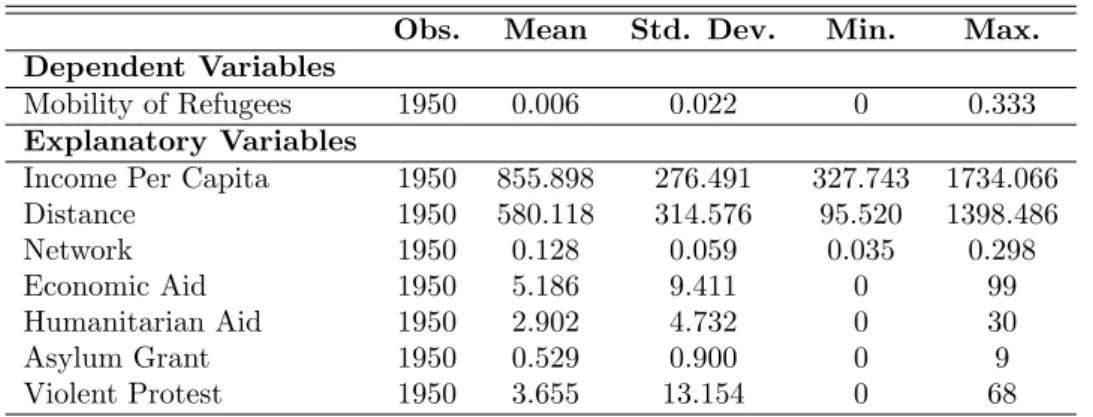
Our sample is composed of 1,950 bilateral observations for which we have information about all variables in our baseline specification (See Table 1 in Section 7).9 According to our mobility
measure, bilateral movements of refugees between NUTS–2 regions are limited, and amount to 0.6%, i. e. on average, 6 refugees per thousands moves to another NUTS–2 region from one quarter to another.
Figure 1 in Section 7 shows the presence of refugees in Turkey in 2017. More precisely, the Directorate General of Migration Management in Turkey provides yearly data on the presence of refugees at the regional level. We divide these figures by the measure of the regional distribution of refugees that we have obtained from our mobile phone data. The map indicates that administrative data overestimates the presence of refugees in Southeast Anatolia – at the Syrian border – and underestimates their presence in the northwestern (Istanbul, East Marmara and West Anatolia), Aegean and Mediterranean regions. Figure 2 in Section 7 shows the mobility of refugees in Turkey in 2017 as obtained from the D4R data. The first map corresponds to out-migration of refugees, their origin, while the second map shows in-migration of refugees, their destination. As can be seen from Figure 2, refugees tend to leave regions in the eastern part of Turkey for regions in the northwestern, Central Anatolia, Mediterranean and Istanbul.
For the levels of income at origin and destination, we use data on quarterly GDP per capita from TUIK. Numbers are reported in Turkish Lira. As can be seen from Table 1, based on our study sample, the lowest income corresponds approximately to 328 TRY and this is the income inS¸anlıurfaregion (in first quarter). The highest income is approximately 1,734 TRY in ˙Istanbul region (in third quarter). The mean income is approximately 856 TRY and this is equivalent to 9The number of observations results from pairing each NUTS–2 region with another NUTS–2 region, given the
bilateral nature of mobility. We do so for every quarter of the year 2017. Table A2 in Section 8 provides a detailed description for all the variables we use in our study.
the income inKonya region.
The shortest distance is approximately 96 kilometers and this is the distance between the
Gaziantep and Hatay regions while the longest distance is approximately 1,400 kilometers, betweenVan andTekirda˘g regions. The mean distance is approximately 580 kilometers and this is equivalent to the distance between ˙Istanbul andSamsun regions.
Figure 3 and Table 2 in Section 7 offer a comparison between the mobility of refugees and non-refugees in our sample based on the frequency of their moves and the distance they travel. Interestingly, according to our mobility measure, non-refugees move more often and further than refugees. On average, refugees travel 582 kilometers while non-refugees traveled 733 kilometers. No refugees in our sample covers a cumulated distance larger than 2,500 kilometers while cumulated distance over the total year 2017 exceeds 3,000 kilometers for some non-refugees. However, the distance of refugee and non-refugee mobility is similar for distances between 0-1000 kilometers and non-refugees move more and further for distances exceeding 1,000 kilometers. Overall, this analysis of distance for refugees and non-refugees is in line with some previous evidence, such as World Bank (2018).10
Table 1 shows that a maximum of approximately 30% of calls were refugee calls and ˙Istanbul is the region with the highest number of refugee calls, while a minimum of approximately 3% of calls were refugee calls inA˘grı region. On average 13% of the calls were refugee calls and this is equivalent to the calls received inBursa region.
Based on our sample, there was a maximum of 99 events related to the provision of economic aid and these took place inAnkara region (in first quarter); 30 events related to the provision of humanitarian aid and these took place inIstanbul region (in third quarter); 9 events related to the grants of asylums and these took place inAnkara region (in first quarter); and finally 68 events related to violent protests and these happened inAnkara region.11
10An histogram of the distance covered by refugees and non-refugees is shown in Table A1 in Section 8. 11Table A3 in Section 8 shows the distribution of events in our sample for the whole year 2017. It can be seen
thatAnkara provided the most economic aid and granted the most asylums whereas˙Istanbulprovided the most humanitarian aid in Turkey in 2017. Violent protests have mainly occurred in regions ofAnkaraand ˙Istanbul.
4
Main Results and Robustness
This section presents our main empirical results. In Section 4.1, we discuss the results from our benchmark specification while Section 4.2 displays results from a number of robustness tests.
4.1
Benchmark Results
Our benchmark analysis is based on a classical gravity model. Using equation 2 in Section 3, we can write our empirical specification:
ln(Modt) =β0+β1lnyot+β2lnydt+β3lnφod+δt+δo+δd+εodt (3)
whereModt is our measure of quarterly refugee mobility and we look at the effects of quarterly
income at originyot, at destinationydtand distanceφodacross NUTS–2 regions in 2017 in Turkey.
δrefers to the fixed effects.
Following the underlying pseudo-gravity model in a double log form, we use a logarithmic transform of these variables. We report robust standard errors to ensure the accuracy of inference.
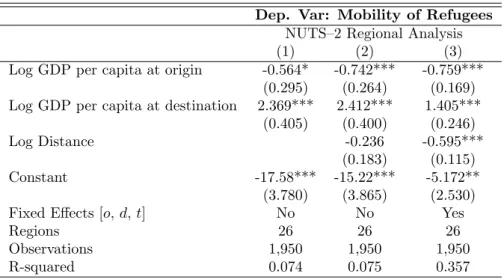
Table 3 in Section 7 shows our benchmark results. In Column (1), we introduce the effect of income at origin and at destination. In Column (2), we add the effect of distance across NUTS–2 regions in Turkey. Finally, in Column (3) we supplement our estimation withorigin,destination
andtimefixed effects. The specification under Column (3) is our benchmark and shows that a low income at origin acts as a push factor while a high income at destination acts as a pull factor, as predicted by the theory of gravity model of migration. Distance has an expected negative effect on the mobility of refugees.
A 10% increase in the GDP per capita at origin decreases the likelihood to migrate of refugees by roughly 8% while a 10% increase in the GDP per capita at destination increases the likelihood to migrate of refugees by roughly 14%, both with a significance at 1%. A 10% increase in the distance to be covered decreases the likelihood to migrate of refugees by roughly 6% with a significance at 1%. It is interesting to note that these elasticities are in line with previous estimates of the literature using gravity models on migration. For instance, Beine et al. (2011) get comparable estimates of -0.613 and -0.341, respectively, although of lower magnitude for
international mobility.
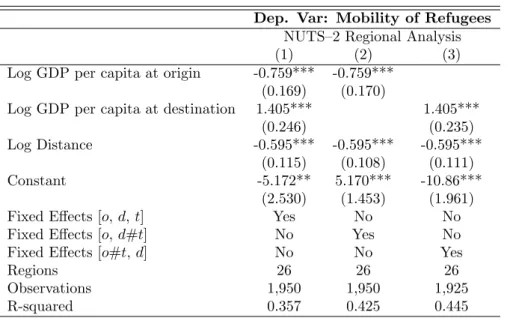
Table 4 in Section 7 highlights results with more general fixed effects. Column (1) of Table 4 is our benchmark. Column (2) displays results withorigin anddestination-timefixed effects. This would account for any time varying destination feature such as regional specific hospitality policies, regional specific labor market condition among others. Column (3) shows results with
destinationandorigin-timefixed effects accounting for any type of shock at origin. These cross fixed effects allow to control for the occurrence of multilateral resistance that can lead to some bias in the estimates of parameters in gravity models (Bertoli and Moraga, 2013). As can be seen from Table 4, results remain robust to the generalization of cross sectional fixed effects interacted by time, both for the sensitivity to distance and also to income levels.
4.2
Robustness
It is desirable to conduct several robustness checks to assess the sensitivity of our results to alternative methodological choices. These are provided in Tables 5 and 6.
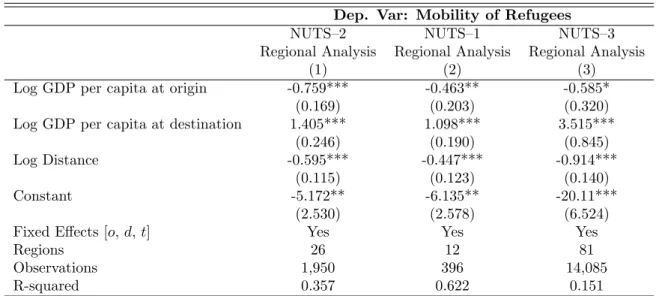
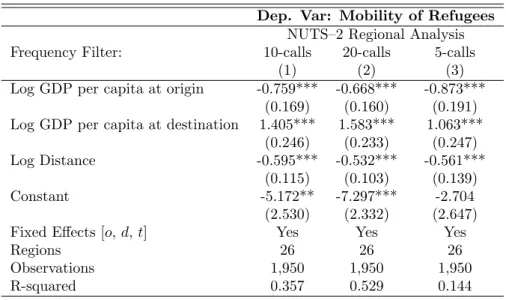
First, we look at the sensitivity to alternative choices with respect to the geographical level at which data are aggregated. Column (1) of Table 5 reproduces the estimation from Table 3 Column (3) for the sake of comparison. Columns (2) and (3) show respectively the results from conducting the analysis at a regional NUTS–1 and NUTS–3 level. There are 12 NUTS–1 regions in Turkey while NUTS–3 regions correspond to provinces and there are 81 provinces in Turkey. As can be seen from Table 5, results are in general robust to performing the analysis at different geographic aggregations. We interpret this result as a support for the absence of strong spatial dependence in our estimations.12 Columns (2) and (3) respectively indicate that a 10% increase in the GDP decreases the likelihood to migrate of refugees by roughly 5% and 6% while at destination a 10% increase in the GDP increases the likelihood to migrate by roughly 11% and 35%. At a NUTS–1 level, a 10% increase in the distance to be covered decreases the migration likelihood by roughly 5%, and 9% at a NUTS–3 level.
Table 6 contains results from taking different minimum frequency filters to compute the mobility. Column (1) of Table 6 is our benchmark. In Column (2), refugee mobility is computed 12Geographers refer to this issue as the Modifiable Areal Unit Problem (MAUP), which results from relying on
such that at least 5 calls in a given NUTS–2 region are taken to define the latter as the origin of an individual, i. e. any individual characterized by less than 5 calls is dropped from our sample. In Column (3), refugee mobility is computed such that at least 20 calls in a given NUTS–2 region are taken to define the latter as the origin of an individual.
As can be seen from Table 6, results remain robust to having a more flexible approach as under Column (2) or a more restrictive approach as under Column (3).
5
Discussion
In this section, we first extend the benchmark results by allowing the impact of refugee networks on their mobility (Section 5.1). We then compare these results with those based on the mobility of non-refugees (Section 5.2), which also provides some kind of placebo analysis. Finally, we consider the impact of news media on refugee mobility (Section 5.3).
5.1
The Impact of Refugee Networks on Their Mobility
The literature on the determinants of international migration has emphasized the role of networks in raising the attractiveness of some destinations (Beine et al., 2011). In this section, we consider the effect of refugee networks. We therefore extend our gravity equation:
ln(Modt) =β0+β1lnyot+β2lnydt+β3lnφod+β4lnNdtR+δt+δo+δd+εodt (4)
where NR
dtrepresents the refugee network.
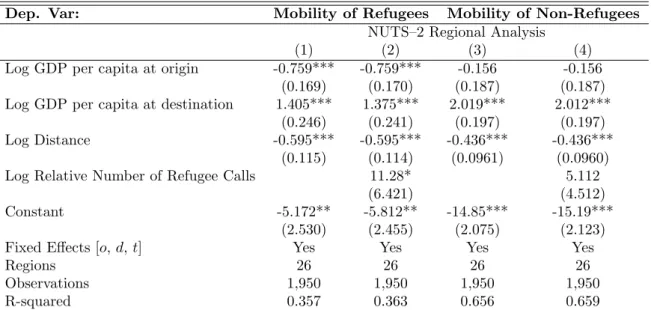
The impact of refugee networks on their mobility is shown in Table 7 of Section 8. Again, Column (1) provides the previous estimates for the sake of comparison. In Column (2) we introduce the relative number of refugee calls as a proxy for refugee networks. Refugee networks at destination have an expected positive impact on the mobility of refugees. A 1% increase in the network increases the likelihood to migrate of refugees by roughly 11% with a significance at 10%. These results should be nevertheless taken with caution since they do not account for the endogeneity issue at stake in this type of estimation. Since we do not have an instrument of the network that is likely to be orthogonal to error term or to the unobserved time-varying
dyadic component of the refugee flows, the estimate should not be seen as causal. The interesting feature is that the introduction of the network show that the estimate of the sensitivity to the income at origin and at destination is robust.
5.2
The Case of Non-Refugees
The case of non-refugees is interesting as it sheds some light on the robustness of our previous results. First, in line with the higher sensitivity to distance of unskilled immigrants with respect to other groups in the population, we should observe a lower sensitivity to distance for non-refugees or natives. Second, this estimation provides a kind of placebo analysis for the impact of network. If properly measured, our network variable should not be correlated with the mobility of non-refugees.
The case of the mobility for non-refugees is shown in Column (3) of Table 7. It can be seen from comparing columns (1) and (3) that income at origin does not constitute a push factor for non-refugees while income at destination is a stronger pull factor. A 10% increase in the GDP at destination increases the likelihood to migrate of non-refugees by 20% with a significance at 1%. Interestingly, distance seem to matter more for refugees than non-refugees, which is once again in line with the evidence brought by the World Bank (2018). Column (4) of Table 7 shows the result of the impact of refugee networks on the mobility of non-refugees. As expected, this result is insignificant.
5.3
The Impact of News Media on Refugee Mobility
We rewrite our specification adding event variables:
ln(Modt) =β0+β1lnyot+β2lnydt+β3lnφod+β6Eot+β7Edt+δt+δo+δd+εodt (5)
where events at origin and at destination are denoted as follows: Eot andEdt.
Table 8 in Section 7 displays results of the impact of news media on the mobility of refugees in Turkey. Column (1) is our benchmark. Columns (2) to (5) respectively add economic aid at origin and at destination, humanitarian aid at origin and at destination, asylum grants at origin and at destination and violent protests at origin and at destination. All columns includeorigin,
destinationandtimefixed effects. All these regressions also include levels of income, at origin and at destination, and distance.
As can be seen from Column (3) of Table 8, an increase by one standard deviation in the number of events reporting the provision of humanitarian aid (5) for the average region (for a population about 3 million) would decrease the likelihood to emigrate by about 3 percentage points with a significance at 10%. Therefore, it seems that the provision of aid in Turkey does allow people to settle in some location and reduces the need to find alternative ones. The evidence runs against a social magnet effect in which refugees would favor destinations with higher levels of aid.
6
Policy Implications and Conclusion
In this paper, we look at the determinants of the internal mobility of refugees in Turkey. A good understanding of the patterns of refugees is key for the provision of aid and support by the authorities. It is also important for the sake of predicting concentrations of these refugees in some areas as they can induce some reactions within the population.
The existing literature on the mobility of refugees is scarce, especially due to the absence of reliable data that track the movements of this category of immigrants. Due to the temporary nature of their status and the massive lack of registration to the hosting authorities, one cannot rely on traditional measures of mobility based on administrative data. This calls for alternative ways of measuring movements of refugees. In this paper, we use a unique dataset of mobile phone data to measure internal movements of refugees across Turkish regions. An additional appealing feature is that we can compute similar measures for non-refugees, which allows to make useful comparisons between the two categories.
This big data approach allows us to conduct a traditional gravity approach applied to migration and to identify the main determinants of their movements as well as to compare these to the non-refugee population. We find that refugees are highly sensitive to distance, in line with the literature on economic migration showing that this sensitivity is increasing in the skill level of immigrants. Refugees tend also to move more often, but on shorter distances.
leave poor areas and are attracted by high-income regions. This contrasts with the patterns of non-refugees who do not display any sensitivity to income at origin. Finally, we find that refugees are sensitive to humanitarian aid and asylum grants. An increase of the provision of these services tends to decrease their probability of moving out of their current location. In contrast, we do not find any evidence of a social magnet effect through which refugees would favor locations providing higher levels of these services.
7
Tables and Figures
Table 1: Summary Statistics of the Variables.
Obs. Mean Std. Dev. Min. Max.
Dependent Variables
Mobility of Refugees 1950 0.006 0.022 0 0.333 Explanatory Variables
Income Per Capita 1950 855.898 276.491 327.743 1734.066 Distance 1950 580.118 314.576 95.520 1398.486 Network 1950 0.128 0.059 0.035 0.298 Economic Aid 1950 5.186 9.411 0 99 Humanitarian Aid 1950 2.902 4.732 0 30 Asylum Grant 1950 0.529 0.900 0 9 Violent Protest 1950 3.655 13.154 0 68
Figure 1: The Presence of Refugees in T u rk ey in 2017: Administrativ e Data v ersus D4R Data.
Figure 2: Mobilit y of Refugees in T urk ey in 2017: Out-Migration v ersus In-Migration of Refugees.
Figure 3: Distance Covered by Refugees and Non-Refugees.
Table 2: Average Traveled Distance and Number of Moves of Refugees and Non-Refugees.
Refugees Non-Refugees Average Traveled Distance (km/movers) 581,7 733,2
Number of Moves 0 21645 30197
1 1006 806
2 225 645
Table 3: Benchmark Analysis:
The Impact of Gravity Model Determinants on Refugee Mobility in Turkey. Dep. Var: Mobility of Refugees
NUTS–2 Regional Analysis
(1) (2) (3)
Log GDP per capita at origin -0.564* -0.742*** -0.759*** (0.295) (0.264) (0.169) Log GDP per capita at destination 2.369*** 2.412*** 1.405***
(0.405) (0.400) (0.246)
Log Distance -0.236 -0.595***
(0.183) (0.115)
Constant -17.58*** -15.22*** -5.172**
(3.780) (3.865) (2.530)
Fixed Effects [o,d,t] No No Yes
Regions 26 26 26
Observations 1,950 1,950 1,950
R-squared 0.074 0.075 0.357
Summary: This table presents the estimates from our benchmark specification and establishes the effect of the classical gravity model determinants on refugee mobility in Turkey. In Column (1) we introduce the logarithm of GDP per capita at origin and at destination. In Column (2) we introduce the logarithm of distance. Finally, in Column (3) we introduceorigin,destinationandtime[o,d,t] fixed effects and obtain coefficients of our empirical specification 3. The specification in Column (3) is our benchmark.
Notes: (i) Our dependent variable is measured by a quarterly migration rateNNij
ii, whereNij
corresponds to leavers andNiito stayers, and which is of the formMigration Rate ‘r’ ‘i’where
‘r’refers to the refugee (resp. non-refugee) status of the observation, and‘i’corresponds to the minimum number of incoming and outgoing calls generated from a given region (i. e. NUTS–2) between 8 pm and 8 am to characterize the latter as the residence location of an individual (i. e. frequency filter of 10 calls); (ii) Robust standard errors are reported in parentheses; (iii) *** denotes statistical significance at the 1 percent level (p <0.01), ** at the 5 percent level (p <0.05), and * at the 10 percent level (p <0.10), all for two-sided hypothesis tests.
Table 4: Robustness Tests on Benchmark Specification.
Dep. Var: Mobility of Refugees NUTS–2 Regional Analysis
(1) (2) (3)
Log GDP per capita at origin -0.759*** -0.759*** (0.169) (0.170)
Log GDP per capita at destination 1.405*** 1.405***
(0.246) (0.235)
Log Distance -0.595*** -0.595*** -0.595*** (0.115) (0.108) (0.111)
Constant -5.172** 5.170*** -10.86***
(2.530) (1.453) (1.961)
Fixed Effects [o,d,t] Yes No No
Fixed Effects [o,d#t] No Yes No
Fixed Effects [o#t,d] No No Yes
Regions 26 26 26
Observations 1,950 1,950 1,925
R-squared 0.357 0.425 0.445
Summary: This table presents the results of robustness tests that are conducted on our benchmark specification. The specification in Column (1) is our benchmark. In Column (2) we replaceorigin,destinationandtimefixed effects [o,d,t] byoriginanddestination#time [o,d#t] fixed effects. In Column (3) we replaceorigin,destinationandtime[o,d,t] fixed effects byorigin#timeanddestination[o#t,d] fixed effects.
Notes: (i) Our dependent variable is measured by a quarterly migration rateNij
Nii, whereNij
corresponds to leavers andNiito stayers, and which is of the formMigration Rate ‘r’ ‘i’where
‘r’refers to the refugee (resp. non-refugee) status of the observation, and‘i’corresponds to the minimum number of incoming and outgoing calls generated from a given region (i. e. NUTS–2) between 8 pm and 8 am to characterize the latter as the residence location of an individual (i. e. frequency filter of 10 calls); (ii) Robust standard errors are reported in parentheses; (iii) *** denotes statistical significance at the 1 percent level (p <0.01), ** at the 5 percent level (p <0.05), and * at the 10 percent level (p <0.10), all for two-sided hypothesis tests.
Table 5: Robustness Tests on the Level of Regional Analysis. Dep. Var: Mobility of Refugees
NUTS–2 NUTS–1 NUTS–3
Regional Analysis Regional Analysis Regional Analysis
(1) (2) (3)
Log GDP per capita at origin -0.759*** -0.463** -0.585*
(0.169) (0.203) (0.320)
Log GDP per capita at destination 1.405*** 1.098*** 3.515***
(0.246) (0.190) (0.845)
Log Distance -0.595*** -0.447*** -0.914***
(0.115) (0.123) (0.140)
Constant -5.172** -6.135** -20.11***
(2.530) (2.578) (6.524)
Fixed Effects [o,d,t] Yes Yes Yes
Regions 26 12 81
Observations 1,950 396 14,085
R-squared 0.357 0.622 0.151
Summary: This table presents the results of robustness tests that are conducted on the level of regional analysis. The specification in Column (1) is our benchmark. In Column (2) we conduct the analysis at a NUTS–1 regional level. In Column (3) we conduct the analysis at a NUTS–3 regional level.
Notes: (i) Our dependent variable is measured by a quarterly migration rate Nij
Nii, whereNijcorresponds to leavers
andNiito stayers, and which is of the formMigration Rate ‘r’ ‘i’where‘r’ refers to the refugee (resp. non-refugee) status of the observation, and‘i’corresponds to the minimum number of incoming and outgoing calls generated from a given region (i. e. NUTS–2 level) between 8 pm and 8 am to characterize the latter as the residence location of an individual (i. e. frequency filter of 10 calls); (ii) Robust standard errors are reported in parentheses; (iii) *** denotes statistical significance at the 1 percent level (p <0.01), ** at the 5 percent level (p <0.05), and * at the 10 percent level (p <0.10), all for two-sided hypothesis tests.
Table 6: Robustness Tests on the Measure of Refugee Mobility. Dep. Var: Mobility of Refugees
NUTS–2 Regional Analysis Frequency Filter: 10-calls 20-calls 5-calls
(1) (2) (3)
Log GDP per capita at origin -0.759*** -0.668*** -0.873*** (0.169) (0.160) (0.191) Log GDP per capita at destination 1.405*** 1.583*** 1.063***
(0.246) (0.233) (0.247) Log Distance -0.595*** -0.532*** -0.561***
(0.115) (0.103) (0.139)
Constant -5.172** -7.297*** -2.704
(2.530) (2.332) (2.647)
Fixed Effects [o,d,t] Yes Yes Yes
Regions 26 26 26
Observations 1,950 1,950 1,950
R-squared 0.357 0.529 0.144
Summary: This table presents the results of robustness tests that are conducted on the measure of refugee mobility in Turkey. The specification in Column (1) is our benchmark. In Column (2) we take a minimum number of 5 incoming and outgoing calls to characterize an individual’s residence location, i. e. a frequency filter of 5 calls. In Column (3) we take a minimum number of 20 incoming and outgoing calls to characterize an individual’s residence location, i. e. a frequency filter of 20 calls.
Notes: (i) Our dependent variable is measured by a quarterly migration rateNij
Nii, whereNij
corresponds to leavers andNiito stayers, and which is of the formMigration Rate ‘r’ ‘i’where
‘r’refers to the refugee (resp. non-refugee) status of the observation, and‘i’corresponds to the minimum number of incoming and outgoing calls generated from a given region (i. e. NUTS–2 level) between 8 pm and 8 am to characterize the latter as the residence location of an individual (i. e. frequency filter of 10 calls); (ii) Robust standard errors are reported in parentheses; (iii) *** denotes statistical significance at the 1 percent level (p <0.01), ** at the 5 percent level (p <0.05), and * at the 10 percent level (p <0.10), all for two-sided hypothesis tests.
Table 7: The Impact of Refugee Networks and the Case of Non-Refugee Mobility.
Dep. Var: Mobility of Refugees Mobility of Non-Refugees
NUTS–2 Regional Analysis
(1) (2) (3) (4)
Log GDP per capita at origin -0.759*** -0.759*** -0.156 -0.156 (0.169) (0.170) (0.187) (0.187) Log GDP per capita at destination 1.405*** 1.375*** 2.019*** 2.012***
(0.246) (0.241) (0.197) (0.197)
Log Distance -0.595*** -0.595*** -0.436*** -0.436***
(0.115) (0.114) (0.0961) (0.0960)
Log Relative Number of Refugee Calls 11.28* 5.112
(6.421) (4.512)
Constant -5.172** -5.812** -14.85*** -15.19***
(2.530) (2.455) (2.075) (2.123)
Fixed Effects [o,d,t] Yes Yes Yes Yes
Regions 26 26 26 26
Observations 1,950 1,950 1,950 1,950
R-squared 0.357 0.363 0.656 0.659
Summary: This table presents the results of the discussion on the impact of refugee networks and the case of non-refugee mobility. The specification in Column (1) is our benchmark. In Column (2) we introduce the logarithm of the relative number of refugee calls as a proxy for refugee networks and obtain coefficients of our empirical specification 4. In Column (3) we look at the mobility of non-refugees. In Column (4) we add the logarithm of the relative number of refugee calls as a proxy for refugee networks to the specification in Column (3), the case of non-refugee mobility.
Notes: (i) Our dependent variable is measured by a quarterly migration rateNij
Nii, whereNijcorresponds to leavers
andNiito stayers, and which is of the formMigration Rate ‘r’ ‘i’ where‘r’ refers to the refugee (resp. non-refugee) status of the observation, and‘i’ corresponds to the minimum number of incoming and outgoing calls generated from a given region (i. e. NUTS–2 level) between 8 pm and 8 am to characterize the latter as the residence location of an individual (i. e. frequency filter of 10 calls); (ii) Robust standard errors are reported in parentheses; (iii) *** denotes statistical significance at the 1 percent level (p <0.01), ** at the 5 percent level (p <0.05), and * at the 10 percent level (p <0.10), all for two-sided hypothesis tests.
Table 8: The Impact of News Events on the Mobility of Refugees. Dep. Var: Mobility of Refugees
NUTS–2 Regional Analysis
(1) (2) (3) (4) (5)
Log GDP per capita at origin -0.759*** -1.043*** -0.726*** -0.636*** -0.673*** (0.169) (0.263) (0.171) (0.170) (0.188) Log GDP per capita at destination 1.405*** 1.377*** 1.375*** 1.361*** 1.313***
(0.246) (0.251) (0.244) (0.248) (0.270) Log Distance -0.595*** -0.592*** -0.589*** -0.586*** -0.599***
(0.115) (0.115) (0.114) (0.115) (0.115) Economic aid per capita at origin 182.6
(131.7) Economic aid per capita at destination 11.00
(40.05)
Humanitarian aid per capita at origin -208.3* (110.2) Humanitarian aid per capita at destination 71.75
(100.5)
Asylum grants per capita at origin -1,307***
(434.8)
Asylum grants per capita at destination 280.7
(420.5)
Violent Protests per capita at origin -118.8
(123.8)
Violent Protests per capita at destination 129.7
(142.4)
Constant -5.172** -3.377 -5.143** -5.699** -5.105*
(2.530) (2.858) (2.527) (2.514) (2.684)
Fixed Effects [o,d,t] Yes Yes Yes Yes Yes
Regions 26 26 26 26 26
Observations 1,950 1,950 1,950 1,950 1,950
R-squared 0.357 0.359 0.364 0.366 0.364
Summary: This table presents the results of discussion on the impact of news events on refugee mobility. The specification in Column (1) is our benchmark. From Column (2) to Column (5) we respectively add events on economic aid, humanitarian aid, grant asylums and violent protests. We obtain coefficients of our empirical specification 5.
Notes: (i) Our dependent variable is measured by a quarterly migration rateNij
Nii, whereNij corresponds to leavers andNii
to stayers, and which is of the formMigration Rate ‘r’ ‘i’ where‘r’refers to the refugee (resp. non-refugee) status of the observation, and‘i’ corresponds to the minimum number of incoming and outgoing calls generated from a given region (i. e. NUTS–2 level) between 8 pm and 8 am to characterize the latter as the residence location of an individual (i. e. frequency filter of 10 calls); (ii) Robust standard errors are reported in parentheses; (iii) *** denotes statistical significance at the 1 percent level (p <0.01), ** at the 5 percent level (p <0.05), and * at the 10 percent level (p <0.10), all for two-sided hypothesis tests.
References
Arif, I. (2019). The Determinants of International Migration: Unbundling the Role of Economic, Political, and Social Institutions. The World Economy.
Beaman, A. L. (2012). Social Networks and the Dynamics of Labour Market Outcomes: Evidence from Refugees Resettled in the U.S. Review of Economic Studies, 79:128–161.
Beine, M., Bertinelli, L., C¨omertpay, R., Litina, A., Maystadt, J.-F., and Zou, B. (2019). Chapter 22. Refugee Mobility: Evidence from Phone Data in Turkey. In Salah, A.A., Pentland, A., Lepri, B., Letouze, E. (Eds.),. Guide to Mobile Data Analytics in Refugee Scenarios, pages 433–449.
Beine, M., Bertoli, S., and Moraga, J. F.-H. (2016). A Practitioners’ Guide to Gravity Models of International Migration. The World Economy, 39(4):496–512.
Beine, M., Docquier, F., and Ozden, C. (2011). Diasporas. Journal of Development Economics, 95:30–41.
Bertoli, S. and Moraga, J. F.-H. (2013). Multilateral resistance to migration. Journal of Development Economics, 102:79–100.
Blumenstock, J., Eagle, N., and Fafchamps, M. (2016). Airtime Transfers and Mobile Communi-cations: Evidence in the Aftermath of Natural Disasters. Journal of Development Economics, 120:157–181.
Bose, P. S. (2013). Building Sustainable Communities: Immigrants and Mobility in Vermont.
Research in Transportation Business & Management, 7:81–90.
Bose, P. S. (2014). Refugees in Vermont: Mobility and Acculturation in a New Immigrant Destination. Journal of Transport Geography, 36:151–159.
Brauw, A. and Giles, J. (2006). Migrant Opportunity and the Educational Attainment of Youth in Rural China. Journal of Human Resources, 52.
Ceritoglu, E., Yunculer, H. B. G., Torun, H., and Tumen, S. (2017). The Impact of Syrian Refugees on Natives’ Labor Market Outcomes in Turkey : Evidence from a Quasi-Experimental Design. Working Papers 1705, Research and Monetary Policy Department, Central Bank of the Republic of Turkey.
European Union. Handbook of Regional and Urban Economics, 4:2845–2909.
Cortes, K. E. (2014). Are Refugees Different from Economic Immigrants? Some Empirical Evidence on the Heterogeneity of Immigrant Groups in the United States. The Review of Economics and Statistics, 86(2):465–480.
Crozet, M. (2004). Do Migrants Follow Market Potentials? An Estimation of a New Economic Geography Model. Journal of Economic geography, 4(1):439–458.
Dagnelie, O., Mayda, A., and Maystadt, J.-F. (2018). The Labor Market Integration of Refugees in the United States: Do Entrepreneurs in the Network Help? European Economic Review, 111.
Deville, P., Linard, C., Martin, S., Gilbert, M., Stevens, F. R., Gaughan, A. E., Blondel, V. D., and Tatem, A. J. (2014). Dynamic Population Mapping Using Mobile Phone Data. Proceedings of the National Academy of Sciences, 111(45):15888–15893.
Dreher, A., Krieger, T., and Meierrieks, D. (2011). Hit and (They Will) Run: The Impact of Terrorism on Migration. Economics Letters, 113:42–46.
Fischer, L. B. and Pfaffermayr, M. (2018). The More the Merrier? Migration and Convergence among European Regions. Regional Science and Urban Economics, 72(C):103–114.
Garcia, A. J., Pindoliay, D. K., Lopiano, K. K., and Tatemzz, A. J. (2015). Modeling Internal Migration Flows in Sub-Saharan Africa Using Census Microdata. Migration Studies, 3(1):89– 110.
GDELT (2014). Event Record Exporter. Retrieved from http://analysis.gdeltproject.org/module-event-exporter.html.
GDELT (2019). GDELT Project. Retrieved from https://www.gdeltproject.org/.
Godøy, A. (2017). Local Labor Markets and Earnings of Refugee Immigrants.Empirical Economics, 52(1):31–58.
Greyling, T. (2016). The Expected Well-Being of Urban Refugees and Asylum-Seekers in Johannesburg. South African Journal of Economic and Management Sciences (SAJEMS), 19:232–248.
Gr¨onqvist, H., Johansson, P., and Niknami, S. (2012). Income Inequality and Health: Lessons from a Refugee Residential Assignment Program. Working Paper Series 2012:11, IFAU - Institute for Evaluation of Labour Market and Education Policy.
Grogger, J. and Hanson, G. H. (2011). Income Maximization and the Selection and Sorting of International Migrants. Journal of Development Economics, 95(1):42–57.
Hatton, T. (2009). The Rise and Fall of Asylum: What Happened and Why? Economic Journal, 119(535):183–213.
Hatton, T. J. (2016). Refugees, Asylum Seekers, and Policy in OECD Countries. American Economic Review, 106(5):441–445.
Hatton, T. J. (2017). Refugees and Asylum Seekers, The Crisis in Europe and The Future of Policy. Economic Policy, 32(91):447–496.
Hirschle, J. and Kleiner, T.-M. (2014). Regional Cultures Attracting Interregional Migrants.
Urban Studies, 51(16):3348–3364.
Ib´anez, A. M. (2014). Growth in Forced Displacement: Cross-Country, Sub-National and Household Evidence on Potential Determinants. In Lucas, R. E., editor,International Handbook on Migration and Economic Development, Chapters, chapter 13, pages 350–387. Edward Elgar Publishing.
Mayda, A. M. (2010). International Migration: A Panel Data Analysis of the Determinants of Bilateral Flows. Journal of Population Economics, 23(4):1249–1274.
Maystadt, J.-F., Hirvonen, K., Mabiso, A., and Vandercasteelen, J. (2019). Impacts of Hosting Forced Migrants in Poor Countries. Annual Review of Resource Economics, 11(1):439–459. McKinnish, T. (2007). Welfare-Induced Migration at State Borders: New Evidence from
Micro-Data. Journal of Public Economics, 91(3-4):437–450.
Mills, K. (2012). Under the Radar: Impact of Policies of Localism on Substance Misuse Services for Refugee and Asylum Seeking Communities. International Social Work, 55:662–674. Mitze, T. (2019). The Migration Response to Local labour Market Shocks: Evidence from EU
Regions during the Global Economic Crisis. Oxford Bulletin of Economics and Statistics, 81(2):271–298.
Munshi, K. (2003). Networks in the Modern Economy: Mexican Migrants in the U. S. Labor Market. The Quarterly Journal of Economics, 118:549–599.
Naud´e, W. (2010). The Determinants of Migration from Sub-Saharan African Countries. Journal of African Economies, 19:330–356.
48(2):167–235.
Ravenstein, E. G. (1989). The Laws of Migration – Second Paper. Journal of the Royal Statistical Society, 52(2):241–305.
Razin, A. and Wahba, J. (2015). Welfare Magnet Hypothesis, Fiscal Burden, and Immigration Skill Selectivity. The Scandinavian Journal of Economics, 117(2):369–402.
Roy, A. D. (1951). Some Thoughts on the Distribution of Earnings. Oxford Economic Papers, 3(2):135–146.
Salah, A. A., Pentland, A., Lepri, B., Letouz´e, E., Vinck, P., de Montjoye, Y.-A., Dong, X., and Dagdelen, ¨O. (2018). Data for Refugees: The D4R Challenge on Mobility of Syrian Refugees in Turkey. ArXiv, abs/1807.00523.
Santos Silva, J. and Tenreyro, S. (2006). The Log of Gravity. The Review of Economics and Statistics, 88(4):641–658.
Santos Silva, J. and Tenreyro, S. (2011). Further Simulation Evidence on the Performance of the Poisson Pseudo-Maximum Likelihood Estimator. Economics Letters, 112(2):220–222.
Steele, L., Lemieux-Charles, L., Clark, J. P., and Glazier, R. H. (2002). The Impact of Policy Changes on the Health of Recent Immigrants and Refugees in the Inner City: A Qualitative Study of Service Providers’ Perspectives.Canadian Journal of Public Health / Revue Canadienne de Sant´e Publique, 93(2):118–122.
T¨urk Telekom (2019). Turk Telekom At A First Glance. Retrieved from https://www.turktelekom.com.tr/en/aboutus/pages/turk-telekom-at-a-first-glance.aspx. Tumen, S. (2016). The Economic Impact of Syrian Refugees on Host Countries:
Quasi-experimental Evidence from Turkey. American Economic Review, 106(5):456–460.
UNHCR (2019a). Syria Regional Refugee Response. Retrieved from https://data2.unhcr.org/en/situations/syria/location/113.
UNHCR (2019b). UNHCR Turkey 2019 Operational Highlights. Retrieved from http://reporting.unhcr.org/node/27380.
Vincenty, T. (1975). Direct and Inverse Solutions of Geodesics on the Ellipsoid with Application of Nested Equations. Survey Review, 23:88–93.
Wesolowski, A., Eagle, N., Tatem, A. J., Smith, D. L., Noor, A. M., Snow, R. W., and Buckee, C. O. (2012). Quantifying the Impact of Human Mobility on Malaria. Science, 338:267–270.
World Bank (2018). Moving for Prosperity: Global Migration and Labor Markets. Policy Research Report. Washington, DC: World Bank.
Ziersch, A., Walsh, M., Due, C., and Duivesteyn, E. (2017). Exploring the Relationship between Housing and Health for Refugees and Asylum Seekers in South Australia: A Qualitative Study.
8
Appendix
Table A1: NUTS Statistical Regions of Turkey.
NUTS–1 NUTS–2 NUTS–3
Regions Subregions Provinces
Istanbul (TR1) Istanbul (TR10) Istanbul (TR100) West Marmara (TR2) Tekirda˘g (TR21) Tekirda˘g (TR211)
Edirne (TR212) Kırklareli (TR213) Balıkesir (TR22) Balıkesir (TR221)
C¸ anakkale (TR222) Aegean (TR3) Izmir (TR31) ˙Izmir (TR310)
Aydın (TR32) Aydın (TR321) Denizli (TR322) Mu˘gla (TR323) Manisa (TR33) Manisa (TR331) Afyonkarahisar (TR332) K¨utahya (TR333) U¸sak (TR334) East Marmara (TR4) Bursa (TR41) Bursa (TR411)
Eski¸sehir (TR412) Bilecik (TR413) Kocaeli (TR42) Kocaeli (TR421) Sakarya (TR422) D¨uzce (TR423) Bolu (TR424) Yalova (TR425) West Anatolia (TR5) Ankara (TR51) Ankara (TR510)
Konya (TR52) Konya (TR521) Karaman (TR522) Mediterranean (TR6) Antalya (TR61) Antalya (TR611)
Isparta (TR612) Burdur (TR613) Adana (TR62) Adana (TR621) Mersin (TR622) Hatay (TR63) Hatay (TR631) Kahramanmara¸s (TR632) Osmaniye (TR633)
Central Anatolia (TR7) Kırıkkale (TR71) Kırıkkale (TR711) Aksaray (TR712) Ni˘gde (TR713) Nev¸sehir (TR714) Kır¸sehir (TR715) Kayseri (TR72) Kayseri (TR721) Sivas (TR722) Yozgat (TR723) West Black Sea (TR8) Zonguldak (TR81) Zonguldak (TR811)
Karab¨uk (TR812) Bartın (TR813) Kastamonu (TR82) Kastamonu (TR821) C¸ ankırı (TR822) Sinop (TR823) Samsun (TR83) Samsun (TR831) Tokat (TR832) C¸ orum (TR833) Amasya (TR834) East Black Sea (TR9) Trabzon (TR90) Trabzon (TR901)
Ordu (TR902) Giresun (TR903) Rize (TR904) Artvin (TR905) G¨um¨u¸shane (TR906) Northeast Anatolia (TRA) Erzurum (TRA1) Erzurum (TRA11)
Erzincan (TRA12) Bayburt (TRA13) A˘grı (TRA2) A˘grı (TRA21)
Kars (TRA22) I˘gdır (TRA23) Ardahan (TRA24) Central East Anatolia (TRB) Malatya (TRB1) Malatya (TRB11)
Elazı˘g (TRB12) Bing¨ol (TRB13) Tunceli (TRB14) Van (TRB2) Van (TRB21) Mu¸s (TRB22) Bitlis (TRB23) Hakkˆari (TRB24) Southeast Anatolia (TRC) Gaziantep (TRC1) Gaziantep (TRC11)
Adıyaman (TRC12) Kilis (TRC13) S¸anlıurfa (TRC2) S¸anlıurfa (TRC21) Diyarbakır (TRC22) Mardin (TRC3) Mardin (TRC31) Batman (TRC32) S¸ırnak (TRC33) Siirt (TRC34)