10.1101/gr.164418.113
Access the most recent version at doi:
2014 24: 1285-1295 originally published online May 8, 2014
Genome Res.
Vladimir B. Teif, Daria A. Beshnova, Yevhen Vainshtein, et al.
differential CTCF binding during stem cell development
Nucleosome repositioning links DNA (de)methylation and
Material
Supplemental
http://genome.cshlp.org/content/suppl/2014/06/05/gr.164418.113.DC1.html
References
http://genome.cshlp.org/content/24/8/1285.full.html#ref-list-1
This article cites 69 articles, 22 of which can be accessed free at:
License
Commons
Creative
.
http://creativecommons.org/licenses/by-nc/4.0/
described at
a Creative Commons License (Attribution-NonCommercial 4.0 International), as
). After six months, it is available under
http://genome.cshlp.org/site/misc/terms.xhtml
first six months after the full-issue publication date (see
This article is distributed exclusively by Cold Spring Harbor Laboratory Press for the
Service
Email Alerting
click here.
top right corner of the article or
Receive free email alerts when new articles cite this article - sign up in the box at the
http://genome.cshlp.org/subscriptions
go to:
Genome Research
Nucleosome repositioning links DNA (de)methylation
and differential CTCF binding during stem cell
development
Vladimir B. Teif,
1Daria A. Beshnova,
1Yevhen Vainshtein,
2Caroline Marth,
1Jan-Philipp Mallm,
1Thomas H
€
ofer,
2and Karsten Rippe
11
Research Group Genome Organization and Function, Deutsches Krebsforschungszentrum (DKFZ) and BioQuant, 69120 Heidelberg,
Germany;
2Division Theoretical Systems Biology, Deutsches Krebsforschungszentrum (DKFZ) and BioQuant, 69120 Heidelberg,
Germany
During differentiation of embryonic stem cells, chromatin reorganizes to establish cell type-specific expression programs.
Here, we have dissected the linkages between DNA methylation (5mC), hydroxymethylation (5hmC), nucleosome
reposi-tioning, and binding of the transcription factor CTCF during this process. By integrating MNase-seq and ChIP-seq
experi-ments in mouse embryonic stem cells (ESC) and their differentiated counterparts with biophysical modeling, we found that
the interplay between these factors depends on their genomic context. The mostly unmethylated CpG islands have reduced
nucleosome occupancy and are enriched in cell type-independent binding sites for CTCF. The few remaining methylated
CpG dinucleotides are preferentially associated with nucleosomes. In contrast, outside of CpG islands most CpGs are
methylated, and the average methylation density oscillates so that it is highest in the linker region between nucleosomes.
Outside CpG islands, binding of TET1, an enzyme that converts 5mC to 5hmC, is associated with labile, MNase-sensitive
nucleosomes. Such nucleosomes are poised for eviction in ESCs and become stably bound in differentiated cells where the
TET1 and 5hmC levels go down. This process regulates a class of CTCF binding sites outside CpG islands that are occupied by
CTCF in ESCs but lose the protein during differentiation. We rationalize this cell type-dependent targeting of CTCF with
a quantitative biophysical model of competitive binding with the histone octamer, depending on the TET1, 5hmC, and 5mC
state.
[Supplemental material is available for this article.]
DNA cytosine modifications such as methylation (5mC) and hydroxymethylation (5hmC) are important determinants of cell differentiation (Reddington et al. 2013; Smith and Meissner 2013). The site-specific locations of these DNA modifications have been linked to disease development through nucleosome positioning (Portela et al. 2013), transcription factor (TF) binding (Stadler et al. 2011), and differential gene expression (Reddington et al. 2013; Smith and Meissner 2013). For the relation of 5mC positions and genomic nucleosome arrangement, conflicting conclusions have been reported since this question was first addressed in the 1970s (Razin and Cedar 1977). Recent studies using high-throughput se-quencing have found 5mCs to reside preferentially either inside nucleosomes (Chodavarapu et al. 2010; Li et al. 2012; Collings et al. 2013) or in the linker DNA regions between nucleosomes (Felle et al. 2011; Kelly et al. 2012). In addition, it is an open question as to how cytosine hydroxymethylation (5hmC) (Williams et al. 2011; Xu et al. 2011; Spruijt et al. 2013; Sun et al. 2013) and formylation (5fC) (Raiber et al. 2012; Shen et al. 2013; Song et al. 2013) relate to nucleosome positions. Furthermore, DNA methylation and nu-cleosome positioning appear to be linked with TF binding and gene expression in a complex manner. For some proteins that can specifically recognize either methylated (Baubec et al. 2013) or unmethylated CpG DNA dinucleotides (Thomson et al. 2010), a direct link between the DNA methylation status and binding is
well established. Many other TFs do not contain a dedicated CpG recognition domain, but CpGs are present in their DNA consensus motifs, which can lead to DNA methylation-dependent binding (Hu et al. 2013b). The majority of TF consensus sequence motifs (not necessarily bound by TFs) are hypermethylated in vivo (Choy et al. 2010), and demethylation of these sites can promote TF binding (Wiench et al. 2011). Alternatively, TF binding could be an upstream, methylation-independent event responsible for recruit-ing enzymes, which then change the methylation state (Stadler et al. 2011). An exemplary case for the complex interplay between DNA methylation and TF binding is the transcription factor CTCF. It recognizes its DNA target via a highly conserved zinc finger protein domain. CTCF demarcates boundaries between chromatin domains and is involved in the regulation of gene expression via establishing specific 3D chromatin structures through DNA loop formation (Merkenschlager and Odom 2013; Van Bortle and Corces 2013). About 40% of the several thousands of potential cell type-specific CTCF binding sites in the human genome were linked to changes in DNA methylation (Wang et al. 2012). On the other hand, it was concluded that in most cases, differential DNA meth-ylation is not a cause but rather a consequence of CTCF binding (Stadler et al. 2011; Feldmann et al. 2013). Recent reports showed that changes of CTCF binding during cell differentiation occur
Ó2014 Teif et al. This article is distributed exclusively by Cold Spring Harbor Laboratory Press for the first six months after the full-issue publication date (see http://genome.cshlp.org/site/misc/terms.xhtml). After six months, it is avail-able under a Creative Commons License (Attribution-NonCommercial 4.0 In-ternational), as described at http://creativecommons.org/licenses/by-nc/4.0/.
Corresponding authors: [email protected], [email protected]
Article published online before print. Article, supplemental material, and pub-lication date are at http://www.genome.org/cgi/doi/10.1101/gr.164418.113.
mostly at weaker CTCF sites (Plasschaert et al. 2013) and lead to functionally important variations in the chromatin states (Kasowski et al. 2013). However, it remains unclear what drives the selection of sites within the many weak CTCF motifs throughout the genome.
Here, we set out to dissect how nucleosome positioning, DNA (de)methylation and cell type-specific binding of CTCF are linked. To this end, we conducted MNase-seq experiments in mouse embryonic stem cells (ESCs), differentiated mouse neural progenitor cells (NPCs), and embryonic fibroblasts (MEFs). We applied a novel procedure of mapping nucleosome occupancy at three different levels of MNase digestion, yielding an average DNA fragment length from;180 to
;150 bp. Nucleosome maps detected at low levels of MNase digestion contain a higher fraction of labile nucleosomes that are lost upon moderate and high MNase digestion. In this manner, we obtained not only static regions of nucleosome depletion and enrichment as done previously (Teif et al. 2012), but were able to identify labile nucleo-somes and correlate their positions with published high-resolution data with respect to DNA methylation (Stadler et al. 2011), CTCF binding (Shen et al. 2012), TET1 enrichment (Williams et al. 2011), hydroxymethylation (Yu et al. 2012), and formylation (Raiber et al. 2012), as well as the pattern of H3K4me3 and H3K9me3 histone modifications also determined in this study. Based on the experi-mental data and associated bioinformatical analysis, we developed a biophysical model, which allowed us to rationalize the 5mC/ 5hmC-dependent competition for DNA-binding between CTCF and the histone octamer during stem cell development.
Results
DNA methylation in relation to nucleosomes depends
on the chromatin context
To elucidate the 5mC distribution with respect to nucleosomes, we calculated the occurrence of methylated and unmethylated CpGs along each of the nucleosomal DNA fragments that we determined in mouse ESCs using paired-end sequencing (Fig. 1). CpGs were classified as being in- or outside of a CpG cluster using the algorithm of Hackenberg et al. (2006), which reports 125,000 CpG clusters or CpG islands (CGIs) for the mouse genome. We obtained qualita-tively similar results when CpGs were classified into being in- or outside of CpG clusters as defined by the algorithm of Wu et al. (2010), which reports 75,000 CGIs for the mouse genome (data not shown). The 16,000 ‘‘classical’’ CGIs included in the UCSC Genome Browser for the mouse mm9 assembly would mostly appear as a subset of the CpG clusters defined above.
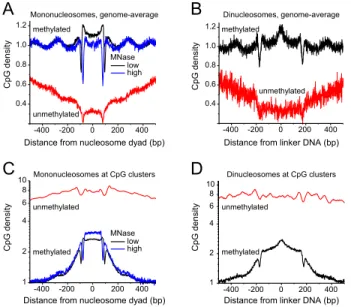
Figure 1A shows the average pattern of the distribution of methylated and unmethylated CpGs along the nucleosome, cal-culated for all genomic nucleosomes, which are mostly located outside of CGIs. DNA methylation was minimal at the middle of the nucleosome (close to the nucleosome dyad), and smoothly increased toward the ends of the nucleosomes up to the maximum methylation level between nucleosomes. This pattern holds true for both low and high levels of chromatin digestion with MNase (black and blue curves in Fig. 1A). Furthermore, the same pattern was confirmed by mapping the CpG occurrence along the dinu-cleosome using a purified dinudinu-cleosome chromatin fraction obtained by moderate MNase digestion, where the linker between two nucle-osomes remained intact (Fig. 1B). The 5mC pattern followed the total CpG content, since most CpGs are methylated (Supplemental Fig. S1). This suggests that the relation of nucleosome positioning and DNA methylation is to some extent hard-wired in the DNA sequence. Both mono- and dinucleosome fractions were characterized by strong
oscillations of 5mCs with the period equal to the nucleosome repeat length. These 5mC oscillations were in counter-phase with the nu-cleosome density (Supplemental Fig. S1C). The borders of both the nucleosome and dinucleosome DNA fragments were characterized by sharp dips in the 5mC density, which is likely to reflect the AT pref-erence of MNase digestion (Fig. 1A,B). However, in the region that flanked the isolated DNA fragment, the 5mC oscillations persisted and thus represent the unperturbed genomic distribution (Fig. 1A). Furthermore, in dinucleosomes, the DNA linker in the middle be-tween two nucleosomes had an;20% increased DNA methylation level (Fig. 1B). Since this linker region remained intact during dinu-cleosome DNA extraction, the 5mC enrichment in this region cannot be a result of MNase sequence preferences.
The characteristic oscillating DNA methylation pattern appeared to be specific for nucleosomes outside CGIs (Supple-mental Fig. S1D). Inside CGIs, the opposite trend was observed (Fig. 1C,D). The sparsely methylated CpGs in these regions were preferentially associated with nucleosomes with a flat average DNA methylation profile. Thus, the local nucleosome/5mC distribution was dependent on the genomic context, e.g., inside CGIs or not, which resolves the seeming controversy that existed in the litera-ture with respect to this issue (Chodavarapu et al. 2010; Felle et al. 2011; Kelly et al. 2012; Li et al. 2012; Collings et al. 2013).
Occupancy of CTCF binding sites within ESCs is determined
by DNA sequence
Having identified the basic features of the interplay between nu-cleosomes and DNA methylation, we set out to dissect how these
Figure 1. DNA methylation patterns relative to nucleosomes. (A) Aver-age CpG density of methylated (>50% 5mC) and unmethylated (<10% 5mC) mononucleosome sequences in ESCs for the complete genome. Most of the sequences reside outside of CGIs because the latter represent only a fraction of;1% of the total pool of sequences mapped by MNase-seq. (Black line) DNA methylation along the nucleosomes obtained at low MNase digestion; (blue line) high MNase digestion. The nucleosome dyad is the middle of the nucleosomal DNA fragment. (B) Same as in panelAbut for the dinucleosome fraction. The linker is defined as the middle of the dinucleosome. (C) CpG density for mononucleosomes and associated linker DNA inside CGIs. Putative CGIs were taken from the coordinates of 125,303 CpG clusters defined by the proximity of neighboring CpGs with the CpGcluster2 algorithm (Hackenberg et al. 2006). (D) Same as in panelC but for the dinucleosome fraction.
affect the binding of the CTCF transcription factor in ESCs. The
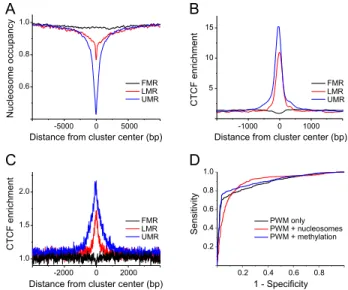
;40,000 sites bound by CTCF in ESCs were classified according to Stadler et al. into those within fully methylated regions (FMRs, characteristic for random genomic locations far from enhancers or promoters), low-methylated regions (LMRs, characteristic for en-hancers), and unmethylated regions (UMRs, characteristic for active promoters) (Stadler et al. 2011). Figure 2A shows large differences in nucleosome density for large-scale clusters of DNA methylation. FMRs displayed a genome-average nucleosome density, LMRs had an;30% lower nucleosome density, and UMRs were nucleosome-depleted by;60%. We then calculated average CTCF enrichment profiles for these three regions based on ChIP-seq data from the Mouse ENCODE Project (Shen et al. 2012). CTCF occupancies were about average in FMR regions, but were elevated in LMRs (10-fold CTCF enrichment) and UMRs (15-fold CTCF enrichment) (Fig. 2B). To test whether CTCF binding in these regions was determined by nucleosome occupancy and/or DNA methylation, we calculated DNA sequence-specific CTCF occupancy profiles for each of the several thousands of regions identified as FMR, LMR, and UMR with our previously introducedTFnucsoftware (Methods; Teif and Rippe 2012; Teif et al. 2013).TFnucallows the studying of different sce-narios of TF binding, taking as input protein concentrations, posi-tion-specific weight matrices (PWM), and nucleosome occupancy profiles. Following previous work (Goh et al. 2010), the CTCF binding constant was corrected by a factor of 1.5 nuc_occup,with nuc_occupbeing the experimentally determined nucleosome oc-cupancy. The effect of DNA methylation on the binding constant was quantified in the same manner using the experimental 5mC density averaged in a 200-bp window in ESCs (Stadler et al. 2011). The CTCF binding occupancy as calculated from the PWM with-out accounting for nucleosomes and DNA methylation (Fig. 2C) predicted the experimental CTCF binding profiles at FMRs, LMRs, and UMRs (Fig. 2B). Since FMR regions are rather large (on average
;50 kb), there is no distinct peak of CTCF occupancy in the middle of FMRs, although these comprise many strong CTCF sites. Three different models were compared based on their corre-sponding receiver-operator curves (ROC), with the quality of the model being reflected by the area under the curve (AUC). One model takes into account only the PWM, while in the two others, the PWM was combined either with DNA methylation or with nucleosome occupancy (Fig. 2D). In the latter models, we assumed a linear effect of DNA methylation and nucleosome occupancy on the CTCF binding constant predicted from the PWM (see Methods). The predicted CTCF binding from the pure PWM model that considered only the DNA sequence was very good (AUC= 0.89) and confirmed the expectation that the ChIP-seq peak height represents binding site occupancy. Neither the introduc-tion of DNA methylaintroduc-tion, nor including the presence of nucleo-somes significantly improved the predictions, with AUC=0.90 in both cases.
DNA methylation alone is a poor predictor of differential
CTCF binding between ESCs and differentiated cells
A significant change of the global CTCF binding profile is observed when comparing ESCs, neural progenitor cells, and mouse embry-onic fibroblasts. Since these cells have identical genomes, CTCF binding differences cannot be explained by the DNA sequence. Can they be explained by cell type-specific differences in DNA methyl-ation as was previously proposed (Wang et al. 2012)? To answer this question, we compared three groups of CTCF sites classified according to the peak calling performed by the Mouse ENCODE
Consortium (Shen et al. 2012) (see Methods): constitutive sites that were occupied by CTCF both in ESCs and MEFs (termed ‘‘ESC and MEF’’), variable sites where CTCF occupancy in MEFs decreased at least twofold in comparison with ESCs (‘‘ESC not MEF’’), and a class of relatively weak sites for which ChIP-seq peaks were identified only in MEFs (‘‘MEF not ESC’’). In a subsequent analysis of the raw seq data in ESCs or in MEFs, we detected essentially all ChIP-seq peaks in both data sets. However, the peak heights were different for a large set of binding sites between ESCs and MEFs. Thus, CTCF binding had significant differences in occupancy between cell types but not in an all-or-none manner. The ‘‘ESC and MEF’’ occupancy data were normalized to unity (100%) for the constitutively occu-pied sites as defined by sites that were present in both ESCs and MEFs, with an occupancy of;50-fold above the background within a given cell type. The ‘‘ESC not MEF’’ sites comprised those sites for which the average occupancy decreased from 75% in ESCs to 20% in MEFs. The ‘‘MEF not ESC’’ class showed only;5% change of oc-cupancy, from;15% occupancy in MEFs to;10% occupancy in ESCs, and represents sites which are weak in both ESCs and in MEFs. Thus, the most significant changes of CTCF binding during ESC to MEF differentiation originated from a loss of CTCF at a fraction of the ESC binding sites, i.e., the ‘‘ESC not MEF’’ class. To rule out the possibility that the ‘‘MEF not ESC’’ and ‘‘ESC not MEF’’ sites are false-positives of the ChIP-seq experiment, we compared these data sets with the recently determined ChIA-PET coordinates of CTCF-mediated chromatin loops in ESCs (Handoko et al. 2011). We found that a similar percentage of;50% of sites from the ChIP-seq data sets overlapped with the ChIA-PET data.
Figure 2. CTCF binding in ESCs can be explained solely by the DNA sequence. (A) Average nucleosome occupancy profiles for genomic gions with different levels of DNA methylation. For fully methylated re-gions (FMR), the occupancy remains flat as compared to genome-average levels. Low methylated regions (LMR) and unmethylated regions (UMR) were nucleosome-depleted by;30% and;60%, respectively. (B) Aver-age CTCF enrichment calculated from ChIP-seq data for the three different classes of 5mC density. (C) Average CTCF enrichment predicted for the same regions based on the DNA sequence preferences given by the TRANSFAC PWM, without taking into account nucleosomes and DNA methylation. (D) Receiver operator curves calculated for theTFnucmodel, taking into account only the CTCF weight matrix without nucleosomes and DNA methylation (black). In addition to PWM, competition with nucleosomes (red) or DNA methylation (blue) was considered. The area under the curve (AUC) reflects both the sensitivity and specificity and thus determines the goodness of the model.
Figure 3A shows that the average 5mC density oscillated around all CTCF sites. Constitutive sites were characterized by a pronounced depletion of 5mCs in the interval of;100 bp upstream of and downstream from the bound CTCF, while variable and weak CTCF sites displayed a 5mC enrichment peak in this region. Similar oscillations were observed for the average 5hmC density (Fig. 3B). The nucleosome patterns around CTCF sites showed oscillations in counter-phase with 5mCs (Supplemental Fig. S4C,D). This oscilla-tory behavior was, in general, consistent with recent reports (Kelly et al. 2012; Sun et al. 2013) and with the oscillation pattern that we found in the genome-wide analysis outside of CpG islands (Fig. 1A,B).
Importantly, the 5mC density in ESCs determined by bisulfite sequencing (Stadler et al. 2011) was not depleted in the middle of the ‘‘ESC not MEF’’ CTCF sites, as one would expect if 5mCs inhibit CTCF binding (Fig. 3A). In a lower-resolution DNA methylation data set measured using MeDIP in ESCs (Wilson et al. 2012), the 5mC density averaged over windows of;300 bp revealed a de-pletion around ‘‘ESC not MEF’’ sites, similar to the constitutive ‘‘ESC and MEF’’ sites (Supplemental Fig. S4A). However, this simple relation found in ESCs was lost in MEFs (Supplemental Fig. S4B). Unlike ESCs, MEFs did not reveal a dip in 5mC enrichment at constitutive CTCF sites with the MeDIP data set (Wilson et al. 2012). This complicated relation was further dissected by our analysis of the high-resolution 5mC data in NPCs (Stadler et al. 2011), com-bined with the recently published CTCF ChIP-seq data set in NPCs (Fig. 3C,D; Phillips-Cremins et al. 2013). For the ‘‘ESC not NPC’’ binding sites, DNA methylation levels had a peak in both cell types. In contrast, the ‘‘NPC not ESC’’ class of sites was characterized by the 5mC depletion in both cell types, independently of whether CTCF was bound or not. From the above analysis, we conclude that DNA methylation anti-correlates with CTCF binding in many cases, but it is not sufficient to predict differential CTCF binding.
TET1 binding and 5mC/5hmC conversion outside of CpG
clusters correlate with labile nucleosomes
To further dissect the interplay of DNA (de)methylation, nucleo-some positioning, and CTCF binding, we analyzed how the nu-cleosome stability near CTCF binding sites was affected by TET1, an enzyme that converts 5mC to 5hmC. The TET1 binding profile in ESCs was derived from ChIP-seq data (Williams et al. 2011), and 5hmC patterns in ESCs were obtained from TET-assisted bisulfite mapping (Yu et al. 2012). Interestingly,;10% of TET1 ChIP-seq
Figure 3. Distribution of 5mC and 5hmC around CTCF sites in ESCs, NPCs, and MEFs. (A) 5mC density calculated around constitutive (‘‘ESC and MEF’’), variable (‘‘ESC not MEF’’), and weak (‘‘MEF not ESC’’) CTCF sites in ESCs from the published CTCF ChIP-seq data (Shen et al. 2012). (B) Same as panelAbut for the hydroxymethylation modification at CpGs. (C) 5mC density in ESCs at ‘‘ESC and NPC,’’ ‘‘ESC not NPC,’’ and ‘‘NPC not ESC’’ CTCF sites calculated with CTCF ChIP-seq data in ESCs (Shen et al. 2012) and NPCs (Phillips-Cremins et al. 2013). (D) Same as panelCbut for 5mC density in NPCs.
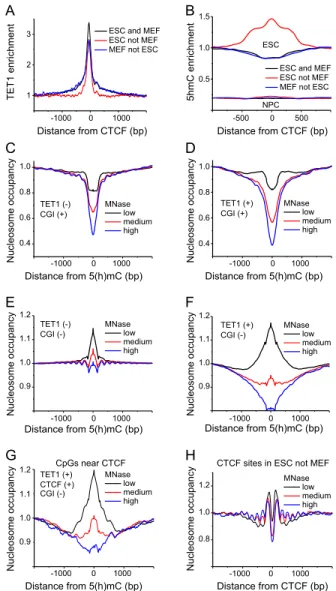
Figure 4. TET1 binding outside CGIs is linked with labile MNase-sensitive nucleosomes. (A) Average TET1 enrichment calculated from ChIP-seq data in ESCs (Williams et al. 2011) around CTCF binding sites (Shen et al. 2012). (B) Enrichment of 5hmC calculated from hMeDIP data in ESCs and NPCs (Tan et al. 2013) around CTCF binding sites (Shen et al. 2012; Phillips-Cremins et al. 2013). (C) Average nucleosome occupancy profiles around 5(h)mC in the absence of TET1 within CGIs for low (black line), medium (red line), and high (blue line) MNase digestion in ESCs. Note that bisulfite sequencing does not distinguish between 5mC and 5hmC. (D) Same as panelCbut for 5(h)mC regions enriched with TET1. (E) Nucleosome occupancy at 5(h)mC without TET1 outside of CGIs. Same color-coding as in panelC. (F) Same as panelEbut for 5(h)mC regions with TET1. (G) Same as in panelFbut only for (hydroxy)methylated CpGs that were within a 500 bp distance of bound CTCF. (H) Nucleo-some occupancy around CTCF sites and occupied by CTCF in ESCs but not in MEFs. Same color-coding as in panelC.
peaks overlapped with CTCF binding, resulting in TET1 enrich-ment for all classes of CTCF binding sites (Fig. 4A). While the level of DNA methylation changed only moderately at CTCF sites dur-ing stem cell development, the level of hydroxymethylation is dramatically different between ESCs and NPCs in general and around CTCF binding sites in particular (Fig. 4B). It is noted that the DNA methylation data used in Figure 4 C–G were determined by bisulfite sequencing (Stadler et al. 2011) and thus do not dis-tinguish between cytosine methylation or hydroxmethylation. While in general the amount of 5hmC is only 5%–10% of the 5mC level in mouse embryonic stem cells, it is enriched at sites where TET1 is bound (Pastor et al. 2013). This is indicated here by using the designation 5(h)mC in the context of Figure 4. To evaluate the effect of TET1 on nucleosome stability, we performed an analysis of our three separate chromatin preparations for ESCs with dif-ferent levels of MNase, each comprising;150 million paired-end mononucleosomal sequencing reads. Stable nucleosomes appear as being rather independent of MNase digestion levels, while unstable nucleosomes are lost at pronounced MNase treatment. For 5(h)mCs inside CGIs, the nucleosome occupancy profiles obtained with different levels of MNase digestion converged to almost the same pattern with the characteristic nucleosome depletion in the middle (Fig. 4C,D). In contrast, nucleosome occupancy profiles around 5(h)mCs outside of CGIs showed a strong dependence on the degree of MNase digestion at TET1 sites (Fig. 4E,F). This pattern was also observed for unmethylated CpGs inside CGIs (Supplemental Fig. S7). In the presence of TET1, the nucleosome pattern of these CpGs outside of CGIs was represented by MNase-sensitive hot-spots. Labile nucleosomes seen at low MNase levels were lost at higher MNase digestion (Fig. 4F). The same pattern was observed at (hydroxy)methylated CpGs near CTCF binding sites associated with TET1 (Fig. 4G). Importantly, only 6% of variable (‘‘ESC not MEF’’) CTCF sites overlapped with CpG clusters, whereas this value was 21% for constitutive (‘‘ESC and MEF’’) and 27% for weak (‘‘MEF not ESC’’) CTCF sites. Thus, TET1-associated labile nucleosomes were enriched at variable CTCF sites (Fig. 4H), suggesting that this is linked to differential CTCF binding.
The conclusion that TET1-bound CpGs outside CGIs are characterized by labile nucleosomes was further corroborated by the corresponding heat maps of nucleosome occupancy around bound TET1 (Fig. 5A,B): Nucleosome maps obtained at low levels of MNase digestion were enriched with nucleosomes containing TET1 bind-ing sites, while for high MNase digestion, nucleosomes became depleted at the same sites. Labile nucleosomes could be linked to the enrichment of H2A.Z (encoded byH2afz) (Supplemental Fig. S3A) and the active chromatin mark H3K4me3 (Supplemental Fig. S3B). In contrast, the inactive heterochromatin mark H3K9me3 was enriched at highly methylated CpGs and depleted at unmethylated/ low-methylated CpGs (Supplemental Fig. S3C).
To further dissect the fate of nucleosomes at the sites un-dergoing 5mC/5hmC conversion, 5hmC sites were stratified according to their hydroxymethylation level of>90%,>50%, and
>25% obtained from the TET-assisted bisulfite mapping data (Yu et al. 2012). When increasing 5hmC levels, the nucleosome oc-cupancy at the 5hmC site changed from a slight enrichment to a strong depletion (Fig. 5C). This indicates that the process of 5mC/ 5hmC conversion is coupled to nucleosome eviction. Upon cell differentiation, the high ESC 5hmC levels decrease (Tan et al. 2013). This is accompanied by an increase of nucleosome occu-pancy, as shown in Figure 5D for sites with>50% 5hmC in ESCs. MEFs have the lowest 5hmC content and the strongest nucleo-some peak at those sites that were covered by labile nucleonucleo-somes
when hydroxymethylated in ESCs. Conversion of 5hmC to 5fC did not show this trend (Supplemental Fig. S8), but one should be cautious due to a lower resolution of the 5fC data set obtained using enzymatic rather than chemical mapping (Raiber et al. 2012). Thus, nucleosomes outside of CpG clusters can be destabi-lized by the TET1-mediated 5mC to 5hmC conversion in ESCs or stabilized as 5hmC is being removed during cell differentiation to regulate accessibility for CTCF at these sites.
Changes of CTCF binding during embryonic stem cell
differentiation can be predicted from a quantitative model
that accounts for competition with nucleosomes
To describe the relation between variable CTCF binding and TET1-dependent nucleosome rearrangements quantitatively, we de-veloped a biophysical model for predicting genome-wide CTCF occupancy in ESCs and MEFs. To this end, we compared the av-erage experimental CTCF occupancy profiles calculated from the raw ChIP-seq data (Fig. 6A; Shen et al. 2012) to the theoretically predicted CTCF binding profiles calculated by ourTFnucsoftware (Methods). CTCF binding profiles calculated from its DNA sequence affinities without taking into account nucleosomes were similar to those experimentally found in ESCs (Supplemental Fig. S5A), con-sistent with the sensitivity/specificity analysis shown in Figure 2D. However, in MEFs, variable CTCF sites showed a loss of CTCF and a concomitant nucleosome occupancy increase, as represented for an exemplary genomic region in Supplemental Figure S5B. Without taking into account nucleosomes, theTFnucalgorithm predicted CTCF binding sites well in ESCs (AUC =0.89) but not in MEFs (AUC=0.77) (Supplemental Fig. S5C). We then calculated the pre-dicted CTCF occupancy profiles for each of the three classes of CTCF binding sites (‘‘ESC and MEF,’’ ‘‘ESC not MEF,’’ ‘‘MEF not ESC’’), taking into account competition with binding of the histone octamer. This allowed us to reproduce the experimental occupancy profiles (Fig. 6B). CTCF occupancy of constitutive and weak sites remained roughly the same in both cell types. However, for variable sites, CTCF occupancy decreased from 80% to 40%, in excellent agreement with the experimentally found decrease in Figure 6A. Thus, the change of CTCF occupancy in the variable CTCF sites can be rationalized by taking into account CTCF competition with binding of the histone octamer. Note that a simple decrease of CTCF expression in differentiated cells of;4-fold in MEFs vs. ESC (Teif et al. 2012) would not reproduce the finding that only variable ‘‘ESC not MEF’’ but not weak ‘‘MEF not ESC’’ sites became depleted of nucleosomes upon cell differentiation.
The DNA sequence motifs of constitutive and variable ‘‘ESC not MEF’’ sites were very similar (Fig. 6C), but the CpG content in an;1-kb region around these sites was different (Fig. 6D). The CpG content around variable ‘‘ESC not MEF’’ CTCF sites was the smallest in comparison with the ‘‘ESC and MEF’’ and ‘‘MEF not ESC’’ sites (Fig. 6D). The loss of CpG enrichment in the region from 100 to 500 bp from the center of variable CTCF sites in comparison with constitutive ones (P< 10 280) indicates that
these sites were mostly not inside CpG islands. Indeed, variable CTCF sites were predominantly found in FMR regions (87%). For comparison, constitutive CTCF sites were frequently found atcis -regulatory regions, with 14% in LMRs, 27% in UMRs, and only 59% in FMRs. This explains why constitutive CTCF sites at pro-moter/enhancer regions remain mainly unchanged during cell development, while variable CTCF sites located in the distal ge-nomic regions outside of CGIs are differentially bound due to chromatin reorganization.
The low stability of nucleosomes at variable CTCF sites ap-pears to also involve active nucleosome translocation and other changes of the underlying chromatin states that contribute to nucleosome positioning as inferred from the following findings: (1) Bound CTCFs colocalized with chromatin remodelers such as CHD4 (also known as Mi-2beta), which as part of the NURD complex, can translocate nucleosomes and also recognize 5mC via associated MBD2 and MBD3 subunits (Supplemental Fig. S6B). Interestingly, variable ‘‘ESC not MEF’’ CTCF sites were character-ized by the largest enrichment of CHD4 in ESCs, suggesting that this subset of sites undergoes the largest nucleosome turnover; (2) nucleosomes positioned at a variable CTCF site in MEFs preferably carried an H3K4me3 modification (Supplemental Fig. S4F); and (3) weak ‘‘MEF not ESC’’ CTCF sites covered by nucleosomes were DNA-methylated (Supplemental Fig. S4A,B) and enriched with the PRC2 subunit SUZ12 (Supplemental Fig. S6A; Hu et al. 2013a).
Thus, our results provide an explanation for differential CTCF binding between ESCs and MEFs for the ‘‘ESC not MEF’’ class of
sites. At these loci, a TET1-dependent 5mC/5hmC conversion, possibly in con-junction with active chromatin remod-eling, creates MNase-sensitive labile nu-cleosomes in ESCs. These nunu-cleosomes can be displaced by CTCF according to the quantitative competitive binding de-scription introduced above. Upon cell differentiation, the levels of 5hmC and TET1 decrease, as these sites become DNA-methylated and adopt additional changes of their chromatin state. These processes result in higher nucleosome occupancy at the variable CTCF binding sites in MEFs, which is represented by a higher DNA binding affinity of the his-tone octamer in our calculations. In turn, the binding competition between CTCF and the histone octamer is shifted toward the histone octamer, and CTCF becomes depleted from these loci in MEFs.
Discussion
In order to dissect the interplay between DNA methylation, nucleosome position-ing, and CTCF bindposition-ing, we performed an integrative, genome-wide analysis. We mapped nucleosome positions by MNase digestion and paired-end sequencing for mononucleosome and dinucleosome sam-ples extracted from mouse embryonic stem cells (ESCs) and their differentiated counterparts. These experiments were performed at different degrees of MNase digestion, which allowed us to determine MNase-sensitive chromatin remodeling hotspots in addition to the previously de-termined static nucleosome landscapes (Teif et al. 2012). By integrating these data, we resolved a puzzling controversy with respect to in vivo preferences of DNA methylation between or inside nucleo-somes (Chodavarapu et al. 2010; Felle et al. 2011; Kelly et al. 2012; Li et al. 2012; Collings et al. 2013). According to our analysis, unmethylated DNA regions were characterized by an
;30% lower average nucleosome density on the kb length scale and are typically inside CGIs (Supplemental Fig. S2). Most CGIs are unmethylated, but for the minority of methylated CGIs, the nu-cleosome was associated with the region(s) containing 5mC (Fig. 1D). The remaining part of the genome outside of CpG islands has a very different relative distribution of 5mC and nucleosomes: The average 5mC density oscillates in such a way that it is minimal in the nucleosome center and increases toward the ends of the nucleo-some, reaching its maximum in the linker regions between nucle-osomes (Fig. 1). Interestingly, the CpG density around nucleosome centers also undergoes regular oscillations with the period equal to the nucleosome repeat length (Supplemental Fig. S1). This type of 5mC oscillations revealed here in mouse has also been reported for plants (Cokus et al. 2008) and recently for several other eukaryotes (Huff and Zilberman 2014) and adds a new layer of the genomic code complexity. The oscillations of both CpGs and 5mC density
Figure 5. Nucleosome occupancy around TET1 binding sites and in relation to 5hmC levels. (A) Average nucleosome occupancy (toppanel) and k-means cluster plots showing nucleosome occupancy around each of 92,888 TET1 ChIP-seq peaks in ESCs (Yu et al. 2012) at low MNase digestion (bottom panel). (B) Same as panelAbut for high MNase digestion. (C) Aggregate plot of nucleosome occupancy around 5hmC sites in ESCs (Yu et al. 2012) grouped according to their 5hmC levels as>25% 5hmC (black line),>50% 5hmC (red line), and>90% 5hmC (blue line). Upon increasing the 5hmC level, the nucleosome density changed from slight enrichment to nucleosome depletion, which corresponds to the nucleosome removal at a subset of these sites. (D) Changes of the nucleosome occupancy during cell development (ESCs, NPCs, and MEFs) around hydroxymethylated sites in ESCs (>50% 5hmC).
were anti-correlated with nucleosome occupancy outside of CGIs. The conclusions obtained with the mononucleosome fraction were confirmed for the dinucleosome fraction extracted after moderate MNase digestion, which showed an;20% 5mC enrichment in the linker regions between nucleosomes (Fig. 1B). Inasmuch as DNA methylation in the linker region is recognized by methyl-binding proteins, it could contribute to enriching a dinucleosome particle during the MNase digestion step. Such a complex consisting of a 5mC-recognizing protein binding to the linker DNA between two nucleosomes might be important for the formation of heterochro-matic regions (Bulut-Karslioglu et al. 2012) and intron/exon recog-nition during the cotranscriptional splicing (Gelfman et al. 2013).
With respect to the CTCF binding site selection in a single cell type (ESC), we showed that CTCF binding preferences are pri-marily due to the DNA sequence and can be well predicted based on the DNA sequence alone (Fig. 2; Supplemental Fig. S5). Al-though DNA methylation and nucleosome positions did correlate with CTCF binding in ESCs, this was rather a downstream effect of CTCF binding, consistent with previous observations (Stadler et al. 2011; Feldmann et al. 2013). Interestingly, the DNA methylation state was previously used by Stadler et al. to improve CTCF binding prediction from;40% to;50% of the binding site variability (Stadler et al. 2011). In our calculations performed for ESCs, the incorporation of the knowledge of DNA methylation led to only a marginal improvement with respect to the pure PWM model (from 89% to 90% in Fig. 2D). Possibly, our model for CTCF binding in ESCs was initially better optimized in the absence of DNA methylation information (AUC=0.89), so that including
5mC hardly had an effect. In support of this conclusion, a recent study on the effect of TF binding site mutations in lymphoma patients also reported that the DNA sequence has a causative effect for the epigenetic changes around CTCF sites when a single cell state is considered (McVicker et al. 2013).
In our analysis, the changes of CTCF binding during stem cell differen-tiation could be predicted when nucleo-some repositioning was taken into account (Fig. 6). The biophysical model accounting for CTCF competition with nucleosomes quantitatively reproduced the differences between the constitutive and variable sites (Fig. 6B). This conclusion is in line with recent studies showing that, at least for some TFs, their occupancy predictions can be improved by taking into account the competition with histones for DNA binding (Narlikar et al. 2007; Gordan et al. 2009; Raveh-Sadka et al. 2009; Wasson and Hartemink 2009; Goh et al. 2010; Locke et al. 2010; John et al. 2011; Kaplan et al. 2011; Li et al. 2011; Zhou and O’Shea 2011; Lickwar et al. 2012; He et al. 2013).
Interestingly, it follows from our analysis that ESCs and MEFs are quanti-tatively different with respect to the CTCF-nucleosome competition. In ESCs, the TFnuc algorithm predicted CTCF binding sites well without taking into account nucleosomes. It failed to do so in MEFs (Supplemental Fig. S5C), where nucleosome rearrangement impeded CTCF binding to the variable sites (Fig. 6B; Supplemental Fig. S5B). This suggests that ESCs have more dynamic chromatin, where CTCF can displace nu-cleosomes more easily. Such a global difference in chromatin dy-namics is consistent with the general notion of ESC chromatin as being more ‘‘open’’ in comparison with differentiated cells (Gaspar-Maia et al. 2011; Biran and Meshorer 2012). Our study suggests a novel mechanistic explanation to rationalize this effect, in addition to the previously identified differences of CTCF binding during ESC differentiation, as depicted in Figure 7. CTCF binding inside CGIs is mostly invariant and determined by the DNA sequence (Fig. 7A). It comprises strong constitutive CTCF sites that remain unmethylated and occupied by CTCF both in ESCs and MEFs. The weak sites in these regions are mostly not bound by CTCF in both cell types. However, outside of CpG islands, binding of TET creates remod-eling hotspots with labile MNase-sensitive nucleosomes in ESCs (Figs. 4, 5). These nucleosomes are prone to become evicted upon 5mC conversion to 5hmC (Fig. 5C) or become stabilized upon 5hmC removal during cell differentiation. Thus, TET1-dependent 5mC/5hmC conversion opens up chromatin and creates labile nucleosomes that can be subsequently displaced by CTCF in ESCs, as depicted in Figure 7B. On the other hand, in differenti-ated cells, 5hmC and TET1 levels decrease and no longer support CTCF competition with the nucleosome at the variable sites that lose CTCF during differentiation.
Are there other factors in addition to nucleosomes that might influence the selection of CTCF binding sites during stem
Figure 6. Quantitative model to predict CTCF occupancy changes due to competition with nucle-osomes. (A) Experimentally observed occupancy of CTCF binding sites in ESCs and MEFs derived from ChIP-seq peak heights (Shen et al. 2012). Three subsets of CTCF sites can be distinguished: constitutive sites bound in both cell types (ESC and MEF), variable sites predominantly bound by CTCF in ESCs (ESC not MEF), and weak sites which are slightly more strongly bound in differentiated cells (MEF not ESC). (B) Predicted CTCF binding site occupancy in ESCs and MEFs when accounting for nucleosome posi-tioning for the three binding site classes shown in panelA. (C) Conservation score of CTCF DNA binding sequence motifs for constitutive, variable, and weak binding sites. (D) Average CpG density at CTCF sites. The variable sites in the ‘‘ESC not MEF’’ class are located preferentially outside of CGIs.
cell development? We have tested proteins whose ChIP-seq data for ESCs are currently available in the literature, and found several potential CTCF binding partners including MECP2 (Baubec et al. 2013), MBD1 (Baubec et al. 2013), YY1 (Vella et al. 2012), and cohesin (Supplemental Fig. S6C; Kagey et al. 2010), which colocalized with CTCF. However, they all showed stron-ger enrichments around constitutive versus variable CTCF sites, which could not explain CTCF binding variability. For proteins whose ChIP-seq data are not available in ESCs, we ap-plied a bioinformatics analysis suggested recently (Luu et al. 2013), and indeed found several of their 5mC-sensitive motifs enriched around the ‘‘ESC not MEF’’ and ‘‘ESC and MEF’’ sites. Interestingly, the significance of this enrichment for GATA1, FOXO4, and TCF3, as given by P-values calculated using the TRAP algorithm (Roider et al. 2007), was consistently several orders of magnitude stronger for ‘‘ESC not MEF’’ vs. ‘‘ESC and MEF.’’ This might suggest that additional complex mecha-nisms can be at play, involving many TFs whose concentra-tions change during the cell development. For CTCF, our data suggest that the TET1/5hmC/5mC-dependent nucleosome repositioning remains the main mechanism that drives its
dif-ferential binding site selection during stem cell development. The novel linkage between these factors and DNA binding site accessibility could be relevant also for other TFs during stem cell differentiation or ligand-activated TF binding (John et al. 2011).
Methods
MNase-seq
MNase-seq experiments for analysis of mononucleosomes and dinucleosomes were conducted as described previously (Teif et al. 2012). Briefly, embryonic stem cells from 129P2/Ola mice were cultured in ESGRO complete medium (Millipore), harvested, and resuspended in low-salt buffer (10 mM Hepes, pH 8, 10 mM KCl, 0.5 mM DTT) at 4°C. After disruption of the cells with a douncer, the nuclei were collected by centrifugation and washed once with the MNase Buffer (10 mM Tris-HCl, pH 7.5, 10 mM CaCl2),
resus-pended in the MNase Buffer, and digested with 0.5 units MNase per microliter (Fermentas) and incubation for 6–11 min at 37°C. The MNase digestion was stopped by putting the samples on ice and adding EDTA to a concentration of 10 mM. After digestion with 0.1
µgµl 1RNase A (Fermentas) and removal of protein by phenol and chloroform extraction, the DNA was ethanol-precipitated, and the resulting DNA pellet was dissolved in H2O. DNA fragments
corre-sponding to mononucleosomes or dinucleosomes were separated on a 2% agarose gel using an E-Gel electrophoresis system (Life Technologies). The libraries for sequencing were prepared according to the standard Illumina protocol. High-throughput paired-end se-quencing of 50-bp read length was performed on the Illumina HiSeq 2000 platform at the DKFZ sequencing core facility in Heidelberg, Germany. We obtained ;150 million nucleosome positions per sequencing reaction and used in the final analysis two biological replicate experiments for each cell condition.
Chromatin immunoprecipitation
ChIP-seq experiments were conducted as described previously (Teif et al. 2012). For each sample, 13106cells were cross-linked with 1% PFA, and cell nuclei were prepared using a swelling buffer (25 mM Hepes, pH 7.8, 1 mM MgCl2, 10 mM KCl, 0.1% NP-40, 1 mM DTT).
Chromatin was sheared to mononucleosomal fragments. After IgG preclearance, the sheared chromatin was incubated with 4µg of either H3K9me3 (Abcam ab8898) or H3K4me3 (Abcam ab8580) antibody overnight. After washes with sonication (10 mM Tris-HCl, pH 8.0, 200 mM NaCl, 1 mM EDTA, 0.5% N-lauroylsarcosine, 0.1% Na-deoxycholate), high-salt-buffer (50 mM Hepes, pH 7.9, 500 mM NaCl, 1mM EDTA, 1% Triton X-100, 0.1% Na-deoxycholate, 0.1% SDS), lithium buffer (20 mM Tris-HCl, pH 8.0, 1 mM EDTA, 250 mM LiCl, 0.5% NP-40, 0.5% Na-deoxycholate) and 10 mM Tris-HCl, chromatin was eluted from the protein G magnetic beads and the crosslink was reversed overnight. After RNase A and proteinase K digestion, DNA was purified and cloned in a barcoded sequencing library for the Illumina HiSeq 2000 sequencing platform (single reads of 50-bp length).
CTCF binding site classification
The initial distinction between the classes of CTCF binding sites in ESCs and MEFs was done based on the peak calling performed previously (Shen et al. 2012), and the following intersection of the areas of the peaks extended to 1000 bp using the ‘‘intersectBED’’ function of the BEDTools program (Quinlan and Hall 2010). As a result, three classes of sites were identified: ‘‘ESC and MEF,’’
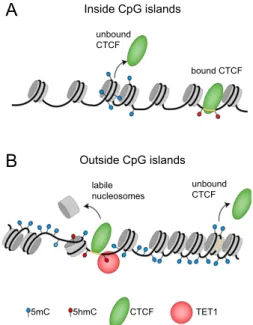
Figure 7. Model rationalizing the linkages between 5mC, 5hmC, TET1-, and CTCF-binding with nucleosome positioning inside and out-side of CpG islands. (A) Inside CpG islands, most CpGs are unmethylated and have low nucleosome occupancy. The small fraction of CpGs in CGIs that are methylated has a nucleosome positioned preferably within the DNA methylation sites. CTCF binding inside CGIs is mostly invariant and determined by the DNA sequence: Strong constitutive CTCF sites stay unmethylated and bound by CTCF and its cobinders during the cell development, while weak sites in these regions are mostly not bound by CTCF in both ESCs and differentiated cells. (B) Outside of CGIs, the ge-nomic DNA is mostly methylated at CpGs. In relation to nucleosome positioning, the following features were found: DNA methylation density is lowest in the middle of the nucleosome, smoothly increases toward the nucleosome entry/exit, and reaches a maximum between nucleosomes. In these regions, TET1 binding creates MNase-sensitive labile nucleo-somes, which are being removed/translocated during the process of 5mC to 5hmC conversion. Variable CTCF sites are found preferentially outside CGIs, where active, TET1-dependent hydroxymethylation and associated nucleosome repositioning promotes CTCF binding. As CpGs in these regions change to a methylated state during stem cell differ-entiation, the formation of stably bound nucleosomes leads to a loss of CTCF at these sites.
‘‘ESC not MEF,’’ and ‘‘MEF not ESC.’’ CTCF occupancy was nor-malized to have the average value for ‘‘ESC and MEF’’ sites equal to unity, which was denoted as 100% occupancy. Filtering of the ‘‘ESC and MEF’’ and ‘‘MEF not ESC’’ sites was performed to exclude sites which have>10% of CTCF occupancy but were not found as peaks in the initial ENCODE peak calling. The resulting ‘‘MEF not ESC’’ class appeared to represent sites which are weak both in MEFs and ESCs. In the case of NPCs, we did peak calling of the raw ChIP-seq data from Phillips-Cremins et al. (2013) using MACS (Zhang et al. 2008) and then applied the same procedure as above.
Calculation of experimental aggregate profiles
All data sets used in this study were preprocessed with Perl scripts as follows: For paired-end MNase-seq, coordinates of each read start and end were used, while for ChIP-seq analysis, reads were extended by the average DNA fragment length. In the case of bisulfite sequencing, individual CpG coordinates from a pre-viously published data set (Stadler et al. 2011) were used for the calculation of two types of coverage files corresponding to unmethylated CpGs (methylation<10%), and methylated CpGs (methylation>50%). At the next step, aggregate plots were cal-culated by summing up all occupancy maps of the individual regions around a given feature. For example, in the case of the calculation of nucleosome occupancy around CpGs (Fig. 1), all annotated mouse CpGs were used for the analysis. When 5mC and CpG patterns were calculated around nucleosome dyads, the midpoints of all paired-end mono- or dinucleosome reads were used in the analysis. To facilitate calculations shown in Figure 1, A and B, we used only reads from chromosome 19. Including re-gions from other chromosomes did not change the results. Due to the large number of genomic regions averaged in the aggregate plots, the differences between all plotted curves are statistically significant. For example, in Figure 4A, the TET1 peak around ‘‘ESC not MEF’’ sites is more narrow than the peak around ‘‘ESC and MEF’’ sites, withP=0.0097 [two-tailedt-test calculated for the ChIP-seq signal averaged with a 10-bp step in the window ( 800;
300) from the peak center].
Calculation of protein-DNA binding from DNA sequence
CTCF binding maps were calculated with the softwareTFnucthat implements the approach described in our previous works (Teif and Rippe 2012; Teif et al. 2013). The program takes as input the DNA sequence, concentrations, and sequence-specific binding constants for transcription factors, as well as cell type-specific nucleosome coverage, and computes binding maps (binding prob-ability distributions) for a given set of proteins to a defined DNA region as introduced elsewhere (Teif 2007, 2010). Average CTCF binding profiles were calculated by summing up binding maps for all individual genomic regions (FMR, LMR, UMR regions in the case of Figure 3C, and regions around CTCF binding sites in the case of Figure 6, B and D). The estimation of sequence-specific binding affinitiesK(CTCF) is based on the known proportionality between PWM scores and the binding probability of a TF to DNA (Roider et al. 2007). The PWM for CTCF was previously determined from ChIP-seq data by Chen et al. (2008), and the latter data set did not overlap with the data set from the Mouse ENCODE Project used in our study (Shen et al. 2012). The parameterization of our model was implemented in analogy to the TRAP algorithm (Roider et al. 2007), using 300 random genomic regions and requiring the best Pearson’s pairwise correlation coefficient of predicted CTCF binding probabilities with the experimental occupancies from the Mouse ENCODE Project data (Shen et al. 2012). The
following optimal parameters were used as input in theTFnuc
program: binding constant K(CTCF) =109 M 1, concentration [CTCF]=10 6M, the energy mismatch parameterl=1.5. To
fa-cilitate comparison with previous results, the effect of nucleosome occupancy on CTCF binding was introduced as described pre-viously (Goh et al. 2010) in the formK(CTCF)modif=K(CTCF)3
1.5 nuc_occup, wherenuc_occupis the nucleosome occupancy at a
given position taken from MNase-seq experiments.
Published data sets used in the calculations
The following published data sets have been used in the calcula-tions: GSE40951 (mononucleosomes in ESCs and MEFs, MNase-seq); GSE30206 (5mC in ESCs and NPCs, Bis-MNase-seq); GSM882244 (5hmC in ESCs, Tet-assisted Bis-seq); GSE27468 (5mC in ESCs and MEFs, MeDIP); GSE39237 (H2A.Z in ESCs, ChIP-seq); GSM687289 (Mi-2b in ESCs, ChIP-seq); GSM1002268 (5hmC in ESCs and NPCs, hMeDIP); GSE24843 (TET1 in ESCs, ChIP-seq); GSE36203 (CTCF in NPCs, ChIP-seq); GSM918743 (CTCF in ESCs, ChIP-seq); GSM918748 (CTCF in MEFs, ChIP-seq); GSM970527 (SUZ12 in ESCs); GSE22557 (cohesin in ESCs). A detailed list of the data sources is provided in Supplemental Table S1F.
Data access
MNase-seq and ChIP-seq data produced in the current study have been submitted to the NCBI Gene Expression Omnibus (GEO; http:// www.ncbi.nlm.nih.gov/geo/) under accession number GSE56938.
Acknowledgments
We thank Dirk Sch€ubeler for stimulating discussions and sharing unpublished data, and Dario Beraldi, Yin Shen, Michael Stadler, and Gareth Wilson for help and explanations about their pub-lished data sets. Part of this work was funded within the project EpiGenSys by the German Federal Ministry of Education and Re-search (BMBF) as a partner of the ERASysBio+ initiative in the EU FP7 ERA-NET Plus program (0315712A). Computational resources and data storage were provided via grants from the BMBF (01IG07015G, Services@MediGRID) and the German Research Foundation (DFG INST 295/27-1). V.B.T. acknowledges the support from the Heidelberg Center for Modeling and Simulation in the Biosciences (BIOMS) and a DKFZ Intramural Grant.
References
Baubec T, Ivanek R, Lienert F, Schubeler D. 2013. Methylation-dependent and -independent genomic targeting principles of the MBD protein family.Cell153:480–492.
Biran A, Meshorer E. 2012. Concise review: chromatin and genome organization in reprogramming.Stem Cells30:1793–1799.
Bulut-Karslioglu A, Perrera V, Scaranaro M, de la Rosa-Velazquez IA, van de Nobelen S, Shukeir N, Popow J, Gerle B, Opravil S, Pagani M, et al. 2012. A transcription factor-based mechanism for mouse heterochromatin formation.Nat Struct Mol Biol19:1023–1030.
Chen X, Xu H, Yuan P, Fang F, Huss M, Vega VB, Wong E, Orlov YL, Zhang W, Jiang J, et al. 2008. Integration of external signaling pathways with the core transcriptional network in embryonic stem cells.Cell133:1106–1117. Chodavarapu RK, Feng S, Bernatavichute YV, Chen PY, Stroud H, Yu Y,
Hetzel JA, Kuo F, Kim J, Cokus SJ, et al. 2010. Relationship between nucleosome positioning and DNA methylation.Nature466:388–392. Choy MK, Movassagh M, Goh HG, Bennett MR, Down TA, Foo RS. 2010.
Genome-wide conserved consensus transcription factor binding motifs are hyper-methylated.BMC Genomics11:519.
Cokus SJ, Feng S, Zhang X, Chen Z, Merriman B, Haudenschild CD, Pradhan S, Nelson SF, Pellegrini M, Jacobsen SE. 2008. Shotgun bisulphite sequencing of theArabidopsisgenome reveals DNA methylation patterning.Nature452:215–219.
Collings CK, Waddell PJ, Anderson JN. 2013. Effects of DNA methylation on nucleosome stability.Nucleic Acids Res41:2918–2931.
Feldmann A, Ivanek R, Murr R, Gaidatzis D, Burger L, Schubeler D. 2013. Transcription factor occupancy can mediate active turnover of DNA methylation at regulatory regions.PLoS Genet9:e1003994. Felle M, Hoffmeister H, Rothammer J, Fuchs A, Exler JH, Langst G. 2011.
Nucleosomes protect DNA from DNA methylation in vivo and in vitro. Nucleic Acids Res39:6956–6969.
Gaspar-Maia A, Alajem A, Meshorer E, Ramalho-Santos M. 2011. Open chromatin in pluripotency and reprogramming.Nat Rev Mol Cell Biol12:
36–47.
Gelfman S, Cohen N, Yearim A, Ast G. 2013. DNA-methylation effect on cotranscriptional splicing is dependent on GC architecture of the exon-intron structure.Genome Res23:789–799.
Goh WS, Orlov Y, Li J, Clarke ND. 2010. Blurring of high-resolution data shows that the effect of intrinsic nucleosome occupancy on transcription factor binding is mostly regional, not local.PLoS Comput Biol6:e1000649.
Gordan R, Hartemink AJ, Bulyk ML. 2009. Distinguishing direct versus indirect transcription factor-DNA interactions.Genome Res19:2090–2100. Hackenberg M, Previti C, Luque-Escamilla PL, Carpena P, Martinez-Aroza J,
Oliver JL. 2006. CpGcluster: a distance-based algorithm for CpG-island detection.BMC Bioinformatics7:446.
Handoko L, Xu H, Li G, Ngan CY, Chew E, Schnapp M, Lee CW, Ye C, Ping JL, Mulawadi F, et al. 2011. CTCF-mediated functional chromatin interactome in pluripotent cells.Nat Genet43:630–638. He X, Chatterjee R, John S, Bravo H, Sathyanarayana BK, Biddie SC,
Fitzgerald PC, Stamatoyannopoulos JA, Hager GL, Vinson C. 2013. Contribution of nucleosome binding preferences and co-occurring DNA sequences to transcription factor binding.BMC Genomics14:428. Hu G, Cui K, Northrup D, Liu C, Wang C, Tang Q, Ge K, Levens D,
Crane-Robinson C, Zhao K. 2013a. H2A.Z facilitates access of active and repressive complexes to chromatin in embryonic stem cell self-renewal and differentiation.Cell Stem Cell12:180–192.
Hu S, Wan J, Su Y, Song Q, Zeng Y, Nguyen HN, Shin J, Cox E, Rho HS, Woodard C, et al. 2013b. DNA methylation presents distinct binding sites for human transcription factors.eLife2:e00726.
Huff JT, Zilberman D. 2014. Dnmt1-independent CG methylation contributes to nucleosome positioning in diverse eukaryotes.Cell156: 1286–1297.
John S, Sabo PJ, Thurman RE, Sung MH, Biddie SC, Johnson TA, Hager GL, Stamatoyannopoulos JA. 2011. Chromatin accessibility pre-determines glucocorticoid receptor binding patterns.Nat Genet43:264–268. Kagey MH, Newman JJ, Bilodeau S, Zhan Y, Orlando DA, van Berkum NL,
Ebmeier CC, Goossens J, Rahl PB, Levine SS, et al. 2010. Mediator and cohesin connect gene expression and chromatin architecture.Nature
467:430–435.
Kaplan T, Li XY, Sabo PJ, Thomas S, Stamatoyannopoulos JA, Biggin MD, Eisen MB. 2011. Quantitative models of the mechanisms that control genome-wide patterns of transcription factor binding during early Drosophiladevelopment.PLoS Genet7:e1001290.
Kasowski M, Kyriazopoulou-Panagiotopoulou S, Grubert F, Zaugg JB, Kundaje A, Liu Y, Boyle AP, Zhang QC, Zakharia F, Spacek DV, et al. 2013. Extensive variation in chromatin states across humans.Science342:
750–752.
Kelly TK, Liu Y, Lay FD, Liang G, Berman BP, Jones PA. 2012. Genome-wide mapping of nucleosome positioning and DNA methylation within individual DNA molecules.Genome Res22:2497–2506.
Li XY, Thomas S, Sabo PJ, Eisen MB, Stamatoyannopoulos JA, Biggin MD. 2011. The role of chromatin accessibility in directing the widespread, overlapping patterns ofDrosophilatranscription factor binding.Genome Biol12:R34.
Li Z, Gadue P, Chen K, Jiao Y, Tuteja G, Schug J, Li W, Kaestner KH. 2012. Foxa2 and H2A.Z mediate nucleosome depletion during embryonic stem cell differentiation.Cell151:1608–1616.
Lickwar CR, Mueller F, Hanlon SE, McNally JG, Lieb JD. 2012. Genome-wide protein-DNA binding dynamics suggest a molecular clutch for transcription factor function.Nature484:251–255.
Locke G, Tolkunov D, Moqtaderi Z, Struhl K, Morozov AV. 2010. High-throughput sequencing reveals a simple model of nucleosome energetics.Proc Natl Acad Sci107:20998–21003.
Luu PL, Scholer HR, Arauzo-Bravo MJ. 2013. Disclosing the crosstalk among DNA methylation, transcription factors, and histone marks in human pluripotent cells through discovery of DNA methylation motifs.Genome Res23:2013–2029.
McVicker G, van de Geijn B, Degner JF, Cain CE, Banovich NE, Raj A, Lewellen N, Myrthil M, Gilad Y, Pritchard JK. 2013. Identification of genetic variants that affect histone modifications in human cells.Science
342:747–749.
Merkenschlager M, Odom DT. 2013. CTCF and cohesin: linking gene regulatory elements with their targets.Cell152:1285–1297.
Narlikar L, Gordan R, Hartemink AJ. 2007. A nucleosome-guided map of transcription factor binding sites in yeast.PLoS Comput Biol3:e215. Pastor WA, Aravind L, Rao A. 2013. TETonic shift: biological roles of TET
proteins in DNA demethylation and transcription.Nat Rev Mol Cell Biol
14:341–356.
Phillips-Cremins JE, Sauria ME, Sanyal A, Gerasimova TI, Lajoie BR, Bell JS, Ong CT, Hookway TA, Guo C, Sun Y, et al. 2013. Architectural protein subclasses shape 3D organization of genomes during lineage commitment.Cell153:1281–1295.
Plasschaert RN, Vigneau S, Tempera I, Gupta R, Maksimoska J, Everett L, Davuluri R, Mamorstein R, Lieberman PM, Schultz D, et al. 2013. CTCF binding site sequence differences are associated with unique regulatory and functional trends during embryonic stem cell differentiation. Nucleic Acids Res42:774–789.
Portela A, Liz J, Nogales V, Setien F, Villanueva A, Esteller M. 2013. DNA methylation determines nucleosome occupancy in the 59-CpG islands of tumor suppressor genes.Oncogene32:5421–5428.
Quinlan AR, Hall IM. 2010. BEDTools: a flexible suite of utilities for comparing genomic features.Bioinformatics26:841–842.
Raiber EA, Beraldi D, Ficz G, Burgess HE, Branco MR, Murat P, Oxley D, Booth MJ, Reik W, Balasubramanian S. 2012. Genome-wide distribution of 5-formylcytosine in embryonic stem cells is associated with transcription and depends on thymine DNA glycosylase.Genome Biol13:R69. Raveh-Sadka T, Levo M, Segal E. 2009. Incorporating nucleosomes into
thermodynamic models of transcription regulation.Genome Res19:
1480–1496.
Razin A, Cedar H. 1977. Distribution of 5-methylcytosine in chromatin.Proc Natl Acad Sci74:2725–2728.
Reddington JP, Pennings S, Meehan RR. 2013. Non-canonical functions of the DNA methylome in gene regulation.Biochem J451:13–23. Roider HG, Kanhere A, Manke T, Vingron M. 2007. Predicting transcription
factor affinities to DNA from a biophysical model.Bioinformatics23:
134–141.
Shen Y, Yue F, McCleary DF, Ye Z, Edsall L, Kuan S, Wagner U, Dixon J, Lee L, Lobanenkov VV, et al. 2012. A map of thecis-regulatory sequences in the mouse genome.Nature488:116–120.
Shen L, Wu H, Diep D, Yamaguchi S, D’Alessio AC, Fung HL, Zhang K, Zhang Y. 2013. Genome-wide analysis reveals TET- and TDG-dependent 5-methylcytosine oxidation dynamics.Cell153:692–706. Smith ZD, Meissner A. 2013. DNA methylation: roles in mammalian
development.Nat Rev Genet14:204–220.
Song CX, Szulwach KE, Dai Q, Fu Y, Mao SQ, Lin L, Street C, Li Y, Poidevin M, Wu H, et al. 2013. Genome-wide profiling of 5-formylcytosine reveals its roles in epigenetic priming.Cell153:678–691.
Spruijt CG, Gnerlich F, Smits AH, Pfaffeneder T, Jansen PW, Bauer C, Munzel M, Wagner M, Muller M, Khan F, et al. 2013. Dynamic readers for 5-(hydroxy)methylcytosine and its oxidized derivatives.Cell152:1146– 1159.
Stadler MB, Murr R, Burger L, Ivanek R, Lienert F, Scholer A, van Nimwegen E, Wirbelauer C, Oakeley EJ, Gaidatzis D, et al. 2011. DNA-binding factors shape the mouse methylome at distal regulatory regions.Nature
480:490–495.
Sun Z, Terragni J, Borgaro JG, Liu Y, Yu L, Guan S, Wang H, Sun D, Cheng X, Zhu Z, et al. 2013. High-resolution enzymatic mapping of genomic 5-hydroxymethylcytosine in mouse embryonic stem cells.Cell Reports3:
567–576.
Tan L, Xiong L, Xu W, Wu F, Huang N, Xu Y, Kong L, Zheng L, Schwartz L, Shi Y, et al. 2013. Genome-wide comparison of DNA hydroxymethylation in mouse embryonic stem cells and neural progenitor cells by a new comparative hMeDIP-seq method.Nucleic Acids Res41:e84.
Teif VB. 2007. General transfer matrix formalism to calculate DNA-protein-drug binding in gene regulation: application to ORoperator of phagel. Nucleic Acids Res35:e80.
Teif VB. 2010. Predicting gene-regulation functions: lessons from temperate bacteriophages.Biophys J98:1247–1256.
Teif VB, Rippe K. 2012. Calculating transcription factor binding maps for chromatin.Brief Bioinform13:187–201.
Teif VB, Vainstein E, Marth K, Mallm J-P, Caudron-Herger M, H€ofer T, Rippe K. 2012. Genome-wide nucleosome positioning during embryonic stem cell development.Nat Struct Mol Biol19:1185–1192.
Teif VB, Erdel F, Beshnova DA, Vainshtein Y, Mallm JP, Rippe K. 2013. Taking into account nucleosomes for predicting gene expression.Methods62:
26–38.
Thomson JP, Skene PJ, Selfridge J, Clouaire T, Guy J, Webb S, Kerr AR, Deaton A, Andrews R, James KD, et al. 2010. CpG islands influence chromatin structure via the CpG-binding proteinCfp1.Nature464:1082–1086. Van Bortle K, Corces VG. 2013. The role of chromatin insulators in nuclear
architecture and genome function.Curr Opin Genet Dev23:212–218. Vella P, Barozzi I, Cuomo A, Bonaldi T, Pasini D. 2012. Yin Yang 1 extends
theMyc-related transcription factors network in embryonic stem cells. Nucleic Acids Res40:3403–3418.
Wang H, Maurano MT, Qu H, Varley KE, Gertz J, Pauli F, Lee K, Canfield T, Weaver M, Sandstrom R, et al. 2012. Widespread plasticity in CTCF occupancy linked to DNA methylation.Genome Res22:1680–1688. Wasson T, Hartemink AJ. 2009. An ensemble model of competitive
multi-factor binding of the genome.Genome Res19:2101–2112.
Wiench M, John S, Baek S, Johnson TA, Sung MH, Escobar T, Simmons CA, Pearce KH, Biddie SC, Sabo PJ, et al. 2011. DNA methylation status predicts cell type-specific enhancer activity.EMBO J30:3028– 3039.
Williams K, Christensen J, Pedersen MT, Johansen JV, Cloos PA, Rappsilber J, Helin K. 2011. TET1 and hydroxymethylcytosine in transcription and DNA methylation fidelity.Nature473:343–348.
Wilson GA, Dhami P, Feber A, Cortazar D, Suzuki Y, Schulz R, Schar P, Beck S. 2012. Resources for methylome analysis suitable for gene knockout studies of potential epigenome modifiers.GigaScience1:3.
Wu H, Caffo B, Jaffee HA, Irizarry RA, Feinberg AP. 2010. Redefining CpG islands using hidden Markov models.Biostatistics11:499–514.
Xu Y, Wu F, Tan L, Kong L, Xiong L, Deng J, Barbera AJ, Zheng L, Zhang H, Huang S, et al. 2011. Genome-wide regulation of 5hmC, 5mC, and gene expression by Tet1 hydroxylase in mouse embryonic stem cells.Mol Cell
42:451–464.
Yu M, Hon GC, Szulwach KE, Song CX, Zhang L, Kim A, Li X, Dai Q, Shen Y, Park B, et al. 2012. Base-resolution analysis of 5-hydroxymethylcytosine in the mammalian genome.Cell149:1368–1380.
Zhang Y, Liu T, Meyer CA, Eeckhoute J, Johnson DS, Bernstein BE, Nusbaum C, Myers RM, Brown M, Li W, et al. 2008. Model-based analysis of ChIP-Seq (MACS).Genome Biol9:R137.
Zhou X, O’Shea EK. 2011. Integrated approaches reveal determinants of genome-wide binding and function of the transcription factor Pho4. Mol Cell42:826–836.