Usability Log Analysis for Healthcare Devices with Software Process
Mining
Atthia Abrar
Helsinki 06.02.2020
UNIVERSITY OF HELSINKI Department of Computer Science
Tiedekunta/Osasto − Fakultet/Sektion –Faculty/Section
Faculty of Mathematics and Natural Sciences
Laitos − Institution − Department
Department of Computer Science
Tekijä − Författare − Author
Atthia Abrar
Työn nimi − Arbetets titel − Title
Usability Log Analysis for Healthcare Devices with Software Process Mining
Oppiaine − Läroämne − Subject
Computer Science
Työn laji − Arbetets art − Level
Aika − Datum − Month and year
06.02.2020
Sivumäärä − Sidoantal − Number of pages
63 pages + 22 appendix pages
Tiivistelmä − Referat − Abstract
With the new trends in advanced healthcare equipment and innovation, the healthcare industry is now focused more on efficiency and improving quality. Devices record events in event log files that represent the program or application's actual usage. The log file of the event is like an operation history which shows what occurred in the program. Since devices have the log of real-time events, real-time processes can be tracked, and data analysed from different aspects. The details about the event log file can be used to create a process model and analyse the data to know its strengths and weaknesses.
This thesis aimed to develop a tool for usability analysis used for GE healthcare. The design science approach has been used as an overall research method. To achieve the research goal, ideas was taken from already developed process mining algorithms and used in making algorithms that solves the problem of software process mining. In this thesis, already used process mining algorithm techniques were examined that can be used to answer the problem of software process mining. Software process mining was used to analyse the deployed software behaviour.
The study focused on making the process discovery algorithm along with structured algorithm. The outcome of the thesis was the tool that was used by the GE Healthcare to do the usability analysis on log files. The tool produces the events in the form of flow chart diagram.
Avainsanat – Nyckelord − Keywords
usability analysis, event log, software process mining, alpha algorithm, fuzzy mining algorithm, heuristic mining algorithm, process discovery
Säilytyspaikka − Förvaringställe − Where deposited
Contents
1. Introduction ... 1
1.1 Background and Motivation ... 1
1.2 About GE Healthcare ... 2 1.3 Research Problem ... 2 1.4 Reserach Goal ... 3 1.5 Reserach Questions ... 3 1.6 Reserach Scope ... 3 1.7 Reserach Approach ... 4 1.8 Thesis Outline ... 4 2. Theoretical Framework... 6 2.1 Event Logs ... 6 2.2 Process Mining ... 6 2.2.1 Process Discovery ... 8 2.2.2 Conformance Checking ... 9 2.2.3 Model Enhancement ... 10
2.3 Software Process Mining ... 10
2.4 Algorithms ... 10
2.4.1 α -algorithm ... 11
2.4.2 Heuristic Mining Algorithm ... 14
2.4.3 Fuzzy Mining Algorithm ... 15
3. Methodology and Research Design ... 17
3.1 Design Science ... 17
3.2 Design Science Research Methodology ... 19
3.2.1 Business Needs ... 21
3.2.2 IS Research ... 22
3.2.3 Applicable Knowledge ... 24
3.3 Overall Research Design ... 24
4. Research Results ... 26
4.1 Process Mining Methodology ... 26
4.2 Technology used to Develop Log Analyzer Tool ... 26
4.3 Structure Algorithm Development ... 27
4.3.1 Carescaer Patient Monitor Analysis ... 28
4.3.2 Event log Message Pattern Recognition ... 29
4.3.3 Database Table for Menu Information ... 30
4.3.4 Database Table for Condition ... 30
4.3.5 Pseudocode of Structure Algorithm ... 33
4.5 Database Structure Development ... 35 4.5.1 tblcases ... 35 4.5.2 tbldata ... 35 4.5.3 tblstructureddata ... 36 4.5.4 tblactivities ... 36 4.5.5 tblmenuinfo ... 37 4.5.6 tblconditions ... 37
4.6 Log Analyzer Tool Features ... 38
4.6.1 Import File ... 38 4.6.2 Data Statistics ... 39 4.6.3 Structure Data ... 42 4.6.4 Activities View ... 42 4.6.5 Activities Statictics ... 44 4.6.6 Condition ... 46 4.6.7 Menu Information ... 46 4.6.8 Configuration ... 47
4.6.9 Backup & Restore Database ... 48
4.6.10 Guide for using the Tool ... 48
5. Evaluation ... 49
5.1 Settings ... 49
5.2 Experimental Results ... 49
5.2.1 Exceptions ... 49
5.2.2 Results ... 50
5.3 Feedback form Usability Team ... 58
5.4 Assessment of Research Design ... 59
6. Discussion and Conclusion ... 61
6.1 Main Findings ... 61
6.2 Limitations ... 62
1.
Introduction
In this chapter background and motivation of the research is presented. Furthermore, this chapter also discusses the research problem, research goal, research questions, research scope and research methodology. At the end this chapter present the skeleton of the thesis and briefly explain the next chapters and its content.
1.1
Background and Motivation
Now-a-days information systems are recording information about the processes in the form of event log files. Systems like ERP (Enterprise Resource Planning), CRM (Cus-tomer relationship management), SCM (Supply Chain management), PDM (Product Data Management) and WFM (Workflow Management) are example of systems, which are recording actual data of the events that are taking place [GRWU08]. Moreover, Embed-ded Systems (ESs) like copier machines, imaging devices, scanners etc. has also started recording the events. Healthcare industry is now more attentive on recoding the actual usage of devices.
With the new trends of advanced healthcare equipment and innovation, healthcare indus-try is now more focused on performance and quality improvement. Devices can record events in the event log files, which has the reflection of actual usage of the software or application. The event log file is like a history of activities which shows what happened in the system. As devices have the real-time event log, it is possible to monitor real time processes and analyse the data from various aspects. The event log file information can be used to derive a process model and analyse the data to learn its strengths and weakness. A proper and intelligent log analysis can help organization in increasing the reliability and usability of deployed devices. Log analysis can also help to monitor the real-life pro-cesses systematically.
Healthcare industry emphasis more on efficiency and effectiveness of their medical equipment and control their expenses by giving quality service at low cost. In this situa-tion, it is very important to analyse and evaluate the existing systems. Here software pro-cess mining technique can be applied to extract the propro-cess models from the event log files [WBJL03]. These process models give you insights of the reality and actual usage.
1.2
About GE Healthcare
GE Healthcare is one of the largest industries having expertise in medical imaging, med-ical diagnostics, patient monitoring systems, drug discovery and biopharmaceutmed-ical man-ufacturing technologies. GE Healthcare is a unit of General Electric Company (NYSE:GE), and is headquartered in Chicago, USA. GE Healthcare is serving healthcare professionals and their patients in more than 100 countries.
GE has developed in Finland for more than 45 years. GE headquartered in Vallila, Hel-sinki Finland is one of GE's leading patient monitoring product development and market-ing centres. Vallila campus designed and developed the solutions related to anaesthesia administration and health information systems. Vallila is also GE Healthcare's domestic sales, marketing, maintenance and service operations.
GE Healthcare employs around 800 people, of whom 250 works in production. Health Innovation Village, start-ups, as well as several medium-sized companies are also part of Vallila campus, in addition to our campus they are total of about 200 people.
GE's premises in Vallila generates ultrasound equipment, patient monitoring solutions in hospitals, clinical information systems and IT solutions, as well as provides services and maintenance. With GE Healthcare extensive medical imaging and information systems, clinical diagnostics, patient monitoring systems, drug development, production technol-ogies to produce biological drugs and a variety of solutions to improve performance helps their customers provide better care to more people around the world at lower cost. GE Healthcare don’t have the access to the real hospital and patient data, they can get the real data from hospital on demand for debugging and fixing issues and bugs.
1.3
Research Problem
GE Healthcare’s equipment in hospitals are recording real time usage of the devices in the event log files named clinical log files. Currently GE Healthcare has usability test process with test users for usability analysis. In those usability tests, they make the videos of the users while using the application and observe their behaviour. There is a need to have the analysis on the log files with the actual events coming from the hospitals to improve usability and reliability of devices. They don’t have the usability analysis on the real-time data under different circumstances. Real time data analysis will help them ana-lyse the data more frequently and assist them to understand which feature of the device is
operating well and which need improvements. Perhaps they have the picture of device usage more clear and real.
1.4
Reserach Goal
The goal of the research proposed in this thesis was to develop a tool for GE healthcare, which allows them to do the usability analysis on event log’s file data, Additionally, the tool also present useful information about the errors and failures in the GE Healthcare applications.
1.5
Reserach Questions
The research problem was performing the usability analysis on the data extracted from the event log files. To address the research problem following research questions were proposed:
RQ1 How process mining technique can be used to analyse healthcare log file data?
RQ2 What was already used process mining algorithms?
RQ3 How the algorithms can be applied in software process mining for usability analysis?
1.6
Reserach Scope
To prevent the research from getting too broad, scope of the research is encircled here. The main idea of thesis was to develop a tool for GE Healthcare to perform the usability analysis on data in event log files. GE healthcare produces multiple log files to record the events, this thesis research focuses only on clinical log files. Information needed to be extracted from the clinical log files are:
• Actual usage of devices
• List of features that are being used • Data Statistics
The tool should transform the log data into graphical and presentable form. The tool should give the possibility to the user to see the data and do the analysis on different features e.g. errors, alarms etc. The tool also gives the facility to export reports of the
data.
1.7
Reserach Approach
The theoretical part of this research is based on the literature review. With the literature review answers of the “What is/are” questions were found. This was served as a guideline to further answer the research questions and do the study. The main study in the theoreti-cal part was about the process mining and software process mining. I also learnt about the existing algorithms used in software process mining technique.
After the outcome of theoretical part, the current GE Healthcare patient monitor’s soft-ware and clinical log files was analysed. This was done with the help of discussion with different people who developed them and from the documentation of the software and their processes. Next, the requirements were gathered from the usability team to find out what they need and expect in the tool to analyse from the clinical log files.
I also developed the algorithms by getting ideas from the existing algorithms to fulfils the requirements of the GE Healthcare tool. As GE Healthcare have some special require-ments for the tool so I developed a new algorithm for software process mining by taking the ideas and features from the existing algorithms.
The main idea of this thesis research is to develop the tool for GE Healthcare to do the usability analysis. So, the research was done via design science approach per the Hevner et al. [HMP04]. Design science research approach can be done via several ways, either you can create an artefact by improving and extending the design science knowledge base or by developing and evaluating the design science research methodology as per Hevner et al. [HMP04]. For my thesis, the research lies clearly in creating the design artefact. For evaluation, I asked the ability team to work on the tool and evaluate that. This helped to check whether tool fulfils the requirements. Also, other people who can use the tool also check the tool for their usage and information extraction. Additionally, it was ensured that when there is a need of further improvements and changes the code and algorithm is flexible to add new changes.
1.8
Thesis Outline
detailed theoretical knowledge of event logs, process mining techniques and already de-veloped algorithms. These are necessary to understand this thesis. Section 3 provides the details of methodology used in thesis research which is design science and describe its mapping on the research problem. Section 4 focuses on results of the developed artefact. Section 5 gives you the evaluation of the developed artefact. In Section 6 there is discus-sion about the research development and concludiscus-sion.
2.
Theoretical Framework
2.1
Event Logs
Event logs are the essential part of process mining. Event logs file consist of number of events in it. Event log contains information about the events in the specific process. Event logs files are stored in various format like text file, xml format, database etc. But the attributes an event contains is almost the same with every event log files.
An event is defined as an activity, generated by the information system. An event is al-ways unique instance. There is alal-ways a sequential relation between event’s occurrence. Event consists of many attributes. These attributes are; timestamp of the event i.e. when the event is occurred, originator of the event i.e. who generated or executed the event or from where event is generated.
Table 2.1 : Event log example
Event ID Timestamp Message Originator
1 15-02-2016 11:18:02 Data Inserted Data View 2 15-02-2016 11:20:15 Print Request Data View 3 15-02-2016 11:21:20 Enter Credential Verification View 4 15-02-2016 11:21:54 Verified Verification View 5 15-02-2016 11:22:10 Prining Data View 6 15-02-2016 11:24:04 Printing Success Data View 7 15-02-2016 11:26:32 Close Form Data View
Event log in Table 2.1 represents the example of data in an event log file. The first column event id is a unique event id column. Second column is the timestamp on which the event is generated. Third column have the activity being executed at that time and fourth column is the corresponding place from where the event is generated, that is the specific view of the software.
2.2
Process Mining
Business process mining or in short form process mining is an evolving research area. The main purpose of process mining is to bring new ways of analysing and improving the business processes by giving the big picture of processes using event logs. Process mining aims to develop understanding of processes behaviour so that the decision makers can analyse them and try to find ways to improve processes behaviour. Process mining gets the information from event log files, which are recorded by the organization’s information
system [SS14]. Process mining always starts by collecting information about the pro-cesses as they take place instead of making the process design.
Process mining highlights the problems of most the organization that they do not have the
knowledge of what is going on in the organization. There is always a gap between the what is supposed to be happen with the deployed application and what happen.
Process mining deals with process modelling, process analysis, business intelligence and data mining. There are two ways that process mining can be used by any organization. First way is that process mining is used as a tool to fetch data from event logs and process it for providing information about the actual usage of procedures. One of the main aspects of process mining is to discover control flow, i.e. construct the process model automati-cally by looking at the real activities and apply dependencies between them. Second way is comparing the actual process with the predefined process to find the differences and loopholes in organization’s procedures. If there is already a process model, then process mining can be used to find the differences between the existing model and new discovered model and extend the model with additional information to highlight bottle neck between processes. Process mining helps people to identify how the procedures work for the ap-plication, and to compare the predefined process with the actual process [SS14]. Figure 2.1 shows the process mining types along with the structure of processing mining, that
how it works. Process mining types will be discussed in detail in later section.
Process mining can be characterised into three phases. These phases are pre-processing, processing and post-processing. In the pre-processing phase, event log file is read and scanned, and relation between the activities are inferred. In the processing phase, mining algorithm applied, log data and ordering relation serves as input. The post-processing phase output the discovered process model into graphical representation [MDAW04].
Process mining has three basic types: discovery, conformance, and extension. Figure 2.2 shows the process mining types in terms of input and output. In discovery part a process model is derived from the observed event log files, and petri net model is constructed based on observed behaviour from the log files. In conformance part the observed model is checked against the already developed model from the predefined process and find out the deviations. In extension part the predefined model is extended by using the facts of conformance and deviation with the observed model. This helps to get the better model with real time usage [MSSAB08].
2.2.1
Process Discovery
The main purpose of process discovery is to identify the model from the event log. In process discovery, different algorithms can be applied to produce process model. Mostly the models are represented in petri net form. The mined model after applying the process
discovery techniques are showed in Figure 2.3. Some common constructs used in mined model are sequence, splits, joins, loops, non-free choice, invisible tasks, duplicate tasks.
2.2.2
Conformance Checking
Process discovery is the starting point of process mining. After process discovery the deeper analysis is possible with the help of produced model. In conformance checking the real model is developed by hand and is compared with the observed model generated from event log. The conformance checking has two angles about the results, first angle I that model is wrong and doesn’t have the real behaviour, and second angle is event log is wrong and in real life the events are different, means reality differs from desired model.
2.2.3
Model Enhancement
Process models can be improved and extended with the help of observed process from the event log files. Different analysis on observed behaviour can help to find the bottle-neck. This helps the organization to correct their process per the analysis [A12].
2.3
Software Process Mining
Process mining technique is not used so far for analysing the deployed application and software behaviour. We use the term software process mining to construct the process specification from the event log files as they occurred and extracting the structure of the process from the real executions.
Process mining technique can be applied in the software [RMLA14]. When a system or application is used, and utilized, the system records the user interaction into the log files. With the help of process mining technique, we can derive the user interface flow models, and this gives the real usage of the application and helps improve the usability of the software.
The focus of software process mining is user workflow. Companies and organizations always face challenges while analysing the user behaviour and user workflow for their innovative software projects. Usability and user acceptance are complicated and thus re-quire the robust solution for usability analysis [OB91]. The focus of this thesis research is on software process mining.
2.4
Algorithms
There are various number of algorithms that are used in process mining. But I will discuss the highly used algorithms. There are two largely used tools named ProM toolkit (www.promtools.org/) and Fluxicon - Disco (https://fluxicon.com/disco/). These frame-works most commonly use fuzzy mining and heuristic mining algorithms to fulfil the needs of the user. Fluxicon - Disco basically used fuzzy mining algorithm. On the other hand, ProM toolkit contain more than 600 plugins and it also have wide selection of min-ing techniques. Generally utilized techniques include fuzzy minmin-ing and heuristic minmin-ing. These algorithms are used in process discovery and called control-flow mining algorithms [A16].
2.4.1
α -algorithm
Alpha mining algorithm reads log files and get activities from it to infer the ordering relations. Based on ordering relations alpha mining algorithm build petri net diagram. The core step of this algorithm is ordering relation [PM16]. By looking at the example of log file in Table 2.2, it can be identified that the case 1 has task sequence of ABCD, case 2 has ACBD, case 3 has ABCD, case 4 has ACBD and case 5 has EF. So, the possible sequences in this log files are ABCD, ACBD and EF.
Case 1 Task A Case 2 Task A Case 3 Task A Case 3 Task B Case 1 Task B Case 1 Task C Case 2 Task C Case 4 Task A Case 2 Task B Case 2 Task D Case 5 Task E Case 4 Task C Case 1 Task D Case 3 Task C Case 3 Task D Case 4 Task B Case 5 Task F Case 4 Task D
In alpha algorithm, there are some relation that should be followed when making the petri net diagram. These are as follow:
• Direct Succession: x > y if for some cases x is directly followed by y. For our sample case (Table 2.2) A > B, A > C, B > C, B > D, C > B and E > F.
• Causality: x → y if x > y and not y > x. For our sample case (Table 2.2) A → B, A → C. B → D, C → D and E → F. Consider the case x → y, its notation is shown in Figure 2.4 in column a.
• Parallel: x || y if x > y and y > x. For our sample case (Table 2.2) B || C and C || B. Consider the case x → y, x → z and y || z, its notation is shown in Figure 2.4 in column b. The other case with x → z, y → z and x || y, its notation is shown in Figure 2.4 in column c.
• Choice: x # y if not x > y and not y > x. For our example case (Table 2.2) A →D. Consider the case x → y, x → z and y # z, its notation is shown in Figure 2.4 in column d. The other case with x → z, y → z and x # y, its notation is shown in Figure 2.4 in column e.
So, the petri net diagram based on the sample case (Table 2.2) is shown in Figure 2.5 using the notations discussed above, here the start node is specified with a circle with black hole and the end state as hollow circle.
Figure 2.6 shows the formalization of alpha algorithm. The overview of the alpha algo-rithm at high level is as follows [PM16]:
Step 1: Define all the events occurred in the event log. Step 2: Define all the possible start events.
Step 3: Define all the possible end events.
Step 4: Calculate possible sets A and B such that all events within A and within B are independent of each other and all events in A should be causally related to events in B. Step 5: Drop the non-maximum sets from the sets obtained in Step 4.
Step 6: Create places for all derived Sets and add start + end state.
Step 7: Draw the connections between places created according to the sets. Step 8: Return the petri net.
Figure 2.5: Petri net diagram [PM16]
2.4.2
Heuristic Mining Algorithm
Heuristic mining algorithm is an improvement of alpha algorithm. It differs in three as-pects from the alpha algorithm, firstly it considers the frequency of the events, secondly it is able to detect short loops, and lastly it detects the skipping of single activities [PM16]. The heuristic miner algorithm can be expressed in the following steps [PM16]:
1. Read a log file.
2. Get the set of tasks/events.
3. Infer the ordering relations based on their frequencies. 4. Build the net based on inferred relations.
5. Output the net.
Steps 1 and 2 are simple and so is the 4rth and 5th. The main step of the algorithm is 3rd which states that we need to create ordering relations based on the frequencies. To better understand this let’s take a simple example.
1. Sequence a,b,c,d is repeated 6 times 2. Sequence a,c,d,b is repeated 2 times 3. Sequence a,b,d,c is repeated 12 times 4. Sequence a,d,c,b is repeated 4 times
As a first step it builds a directly follows frequency matrix i.e. directly follows a > b (a is directly followed by b). |𝑎 > 𝑏| is the number of times a > b occurs in the log. Matrix created using the following information will be shown in Table 2.3.
A b C D
A 18 2 4
B 6 12
C 4 8
D 2 16
By looking into the sequences 1 and 3 we see that |a > b| value is 18. The rest of the matrix is filled using the same technique. For the second step it creates the dependency matrix whose formula is as followed:
|=>| = |𝑎 > 𝑏| − |𝑏 > 𝑎| |𝑎 > 𝑏| + |𝑏 > 𝑎| + 1
It’s a simple calculation formula where we will use information from the frequency matrix to fill out our dependency matrix shown in Table 2.4.
a b C D
A 0.95 0.66 0.8
B -0.95 0.18 0.67
C -0.66 -0.18 -0.32
D -0.8 -0.67 0.32
Let’s try to fill a to b and b to a place in the matrix. Values for |a>b| is 18 and |b>a| is 0 based on the frequency matrix. So,
a to b => 18−0
18+0+1 = 0.95
b to a => 0−18
0+18+1 = -0.95
Similarly, other places of the matrix can be filled accordingly. The values we will get will be in range of -1 and 1. Positive value means that the relation is strong and negative means the relation is weak. Using the information of the above two matrices the petri net can be created.
2.4.3
Fuzzy Mining Algorithm
The above-mentioned algorithms are good to find processes within structured log data files or processes, they provide you impressive results when the process in consideration is well structured and are enforced to be systematic. But these algorithms failed when the
process under discussion is not well structured.
When applied to unstructured data the result they produce is entirely correct, but output is a mess and termed that as “spaghetti models” [GCW07]. The problem is that the messy output is hard to understand, and the amount of information displayed on the page is useless to the reader as it shows too much information. Hence, in order to cope this prob-lem, the mining algorithm which is considering less structured data should provide a high-level view with abstractions for the reader to understand it at a higher high-level. This will be of importance for the end users as they will be able to get out of it instead of just a messy network like output where there is no prominent pattern to identify.
Günther et al. [GCW07] identified two elementary metrics Significance and Correlation that can be used to create such an output. They specified that frequency could be to meas-ure the significance of events. As the events occurring more are for smeas-ure significant and should be given high priority. For correlation they defined it as how closely related two events following one another are, which can be measured based on different techniques that will vary on the given problem. Following these two metrics the simplification pro-cess developed by Günther et al. [GCW07] is:
• Highly significant behaviour is preserved as it is in the model.
• Less significant and highly correlated behaviour is aggregated (combined) in a cluster.
• Less significant and low correlated behaviour is abstracted (removed) from the model.
To Conclude, it is important to note that Fuzzy Mining does not create a petri net but instead creates a graph based on the above-mentioned points that can be characterized as high-level graph.
3.
Methodology and Research Design
In this chapter design of the research is elaborated. This chapter first provide the brief description of the design science research approach. Next this chapter describe the meth-ods used for solving the problem of this thesis. Further this chapter provide the methmeth-ods used for validation the artefact.
3.1
Design Science
Design science approach is originally from the domain of engineering and has gained attention in information systems (IS) research [KGM12]. Nunamaker et al. [NJCP90] present the idea that systems development could produce the valuable results in the field of information systems (IS), if considers and view it as research methodology. Nunamaker et al. [NJCP90] have also presented the process of systems development research with the processes consist of construct a conceptual framework, develop a system architecture, analyse and design system, build the prototype, and observe and evaluate system. Orlikowski et al. [OB91] research work shows the study of information technology, or-ganization’s research approaches and most of their research focus is on differentiating the design science research with behavioural science (also known as natural science) and so-cial science. In March et al. [MS95] research, they combine the knowledge of natural science research with design research and proposed a framework with activities half taken
from natural science research and half taken from design research. Figure 3.1 shows the research framework by March et al. [MS95]. The framework is not very innovative but
unpolished and indefinite as it represents the characteristics of the early researches of design science articles.
After this, a lot of work has been published that defines the paradigm of design science research in information systems. These researches include ontology of design science and including the artefact in design science by Orlikowski et al. [OI01], Benbasat et al. [BZ03], Iivari et al. [I07], Baskerville et al [PBV08]. There are also other researches that focuses on methodology of design science to create and evaluate design with some pro-posed methods Hevner et al. [HMP04] and Sein et al. [SHPRL11].
Hevner et al. [HMP04] continues the idea of March et al. [MS95] and combine the natural science research with design science research. Hevner et al. [HMP04] takes the theory from Silver et al. [SMB95] to add up in the research. So far, several design science re-search frameworks have been proposed and existed. These frameworks have several phases and each phase has some set of milestones to achieve. Most of them are with iter-ative approach with several cycles of design process.
To understand the context of this thesis research, five steps taken from Takeda et al. [TVY90] methodology is provided to present the development of project in a natural way. These steps are shown in Figure 3.2.
Awareness of problem came through the discussions with the GE Healthcare personnel and with academic supervisor. It was identified that most of the people in GE healthcare uses the clinical log files for different purposes and it is difficult for them to analyse the data and find out the required messages from the clinical log files. GE Healthcare keen to have a tool that gives the statistics on overall data of clinical log file as well as provide the usability analysis. The outcome of this process step was an agreement with GE Healthcare and candidate for a master thesis work sponsored by GE Healthcare.
In the suggestion process step, there was ideas of tools on how to present the clinical log file in human readable form to understand the data better and quickly. This step required the understanding of clinical log files in depth and finding out ways to present the features in tool. The output of this process step was a thesis description that list down the features of the tool that was going to be in the tool.
Development and evaluation process step contain the empirical work done for this thesis. The output of this process was artefact in the form of tool that fulfils the requirements of the data statistics and usability analysis of clinical log files. The output of the evaluation
process step was assessment of the tool based on recommended criteria.
Finally, the conclusions along with research process description, artefact, results and eval-uation was embodied in this thesis publication.
3.2
Design Science Research Methodology
For this thesis end users were interviewed to understand the current tools used in GE Healthcare, and perceive the domain knowledge as well to better understand their busi-ness needs, processes and end user’s expectations. For this purpose, a framework is needed that would take care of the research part also. Unfortunately, the design research process by Takeda et al. [TVY90] and design Science research framework by March et al. [MS95] did not offer this dilemma. That is why the framework by Hevner et al. [HMP04] is used.
To provide the usability analysis using the clinical log files, it is very important to under-stand what form a suitable solution might take and how it would be used in practice. The primarily concern of this thesis was producing a tool useful to practitioners of GE Healthcare as well as the researchers.
The specific model of design science selected to use in this thesis research is that pre-sented by Hevner et al. [HMP04]. This model is selected because it is well-developed, also latest and published in the top journal of Information Systems. This makes it as of high quality, accepted by researchers and likely to be a reference source for several future projects. It also presents several guidelines for critically evaluating design science re-search.
Figure 3.3 shows the design science model proposed by Hevner et al. [HMP04]. This model explicitly has two modes which is develop/build and justify/evaluate. These modes are linked with business needs (relevance) and application knowledge (rigor). As Hevner et al. [HMP04] argue, IS research needs to be rigorous to provide an “addition to the knowledge base”, and relevance allows for “application in the appropriate environment”. This thesis proceeds with identifying the key elements from the model, and then applying these elements into thesis research.
Figure 3.4 presents the thesis research mapping on Hevner et al. [HMP04] framework of design science research. The figure shows the artefact to be developed, evaluation, foun-dations in the knowledge base, and applied methodologies. The main pattern of this framework approach is to understand the requirements and needs first, then develop arte-fact and evaluate them.
3.2.1
Business Needs
The mapping of design science framework begins with business needs. Business needs ensures that the design science research meets the goals of relevance. Per the Hevner et al. [HMP04] business needs are assessed within the context of organizational strategies, structures, culture and existing business processes. Therefore, for understanding the ness needs for the usability analysis tool, there is a need to look out the elements of busi-ness in the design science model.
3.2.1.1
People
From the thesis research problem, it is clear that target people and audience are the usa-bility teams and the teams using the clinical log files. Information from the usausa-bility team was collected that how they were doing the usability analysis and what were their expec-tations as well. Also, the other teams and persons who were using the clinical log files, it was good to ask them and know what information they were using from the clinical log files and how they were extracting them.
3.2.1.2
Organization
In this research thesis, I got the strategies from the organization about the usability anal-ysis. Without the proper knowledge, it was not possible to produce the tool in the desired form. There should also be the analysis on the clinical log files. How they were created, how messages are logged, pattern of messages, time of messages and how I would extract the information from them.
3.2.1.3
Technology
From the technology point of view, clinical log files were saved into the carescape patient monitors and would be extracted if the hospital gave permission or if there was any errors or bugs while using the patient monitors. GE healthcare save those data got from the hospital in their network drives with permissible person using them. I used those clinical log files for the tool.
3.2.2
IS Research
For a work body to count as design science it must produce and evaluate a novel artefact Hevner et al. [HMP04]. The research thesis seeks to achieve the artefact by developing a new tool which will take the clinical log file as an input and do the usability analysis.
3.2.2.1
Develop/Build
The artefact that is produced for this thesis was a system which has the functionality of importing the clinical log file into your local system database. It also gives some data statistics on the log file messages and gives you the user activities chart for usability pur-pose. The things covered into the development of artefact was as follows:
• Conceptualization of clinical log file
• Understanding the carescape patient monitor software • Develop event log structure algorithm
• Develop process discovery algorithm • Develop log analyzer tool
3.2.2.2
Justify/Evaluate
To ensure that the artefact is useful for organization’s targeted people and as well as for knowledge base, it should go under rigorous evaluation and justification. The artefact not only provide the numerical results, but it also gives the user confidence that the output is valid. The goals of this thesis research evaluation are as follows:
• Tool should be applicable and work with the hospital clinical log files with real data.
• Test the performance of tool in term of time taking to run the algorithms. • Test the tool in terms of correctness of data and activities model.
All the evaluation methods describe by Hevner et al. [HMP04] was considered for eval-uation the tool developed for the thesis research. Table 3.1 shows the evaleval-uation methods used to evaluate this research thesis artefact. In the Table 3.1 discussion is given about which evaluation method is used in thesis artefact evaluation.
Table 3.1: Evaluation methods
Evaluation Method
Description Discussion
Observational Case Study: Study artefact in depth in business environment
This is applicable for my re-search thesis because the real hospital data will be used and inserted in the tool to monitor its behaviour.
Experimental Controlled Experiment: Study arte-fact in controlled environment for qualities
(e.g., usability)
This is applicable for my re-search thesis because the tool will be given to the usability team for the analysis and they will report the results after ex-perimentation.
Simulation - Execute artefact with artificial data
This is applicable for my re-search thesis because for initial testing purpose I will use the in-house development data to test my algorithms functional-ity.
Testing Functional (Black Box) Testing: Exe-cute artefact interfaces to discover failures and identify defects
This is applicable for my re-search thesis. End Users will be the ones testing the functional-ity and reporting their results and feedback.
Structural (White Box) Testing: Per-form coverage testing of some met-ric (e.g. Execution paths) in the arte-fact implementation
This is applicable for my re-search thesis. I will be the one responsible to test my applica-tion with valid and invalid in-puts to verify the outin-puts.
3.2.3
Applicable Knowledge
In design science research methodology, to complete the artefact the research gets the knowledge from the existing knowledge base. This information can be from anywhere; it can be from previous work and papers as well.
3.2.3.1
Foundations
In the foundation part of the design science research, the idea of process mining algorithm research is taken from the previous work. As they were applicable for my thesis problem, but they were not fully utilized per the GE Healthcare scenarios because their require-ments and business needs were different. Therefore, those algorithms were studied, and new algorithms was developed for the thesis research artefact.
There were also some tools already developed in the field of process mining. Those tools were studied, and observation is done on how they were representing the event log files in human readable form. After the tool’s algorithms were studied, development of the functionality of making the clinical log file’s user activities is done which was represented in user readable form.
3.2.3.2
Methodology
The next area to focus was the design science research method usage and the semi-struc-ture interview. That is studied from previous researches which shows that how to conduct them and sae is done for this thesis.
3.3
Overall Research Design
research design for this thesis.
1 Literature Review: The first phase consists of gathering the knowledge form the domain of process mining literature. For this thesis research was carried from scholarly journals, conference proceedings, technical reports, and semi-nar papers.
2 Interviews: The next phase is understanding the business needs of GE healthcare. Therefore, some interviews were conducted with the usability teams and the persons who were working and generating the log files to fully understand everything. All the conversations were face-to-face.
3 Conceptual Study and Development: In this phase concepts were built about what was going to be in the tool and then start developing it per the plan.
4 Evaluation: In the last, tool was evaluated by testing the functionality using the in-house clinical log files as well as with the real hospital clinical log files.
4.
Research Results
In this chapter the solution of the research problem is presented.
4.1
Process Mining Methodology
Process discovery method was used to show the workflow of the clinical event log files in the tool. Process discovery method and algorithms are already discussed in chapter 2 with detail. Process mining has three parts, discovery, conformance checking and en-hancement. For this thesis research, only the process discovery method is used to find the workflow of the clinical event log file and do the usability analysis.
While analysing the clinical event log files of GE healthcare, it was identified that it did not had any structure that identified the cases uniquely. Algorithms that was discussed in section 2.4 take the event log file in some structure form, in which the processes were uniquely identified. There was a need of algorithm that first make the structure of the event log files. After that process discovery algorithm was developed and applied on structured data.
Two algorithms were developed in this thesis; one was structure algorithm and the second was discovery algorithm. In the following section the algorithms are discussed in detail how they were created, and the pseudo code of the algorithms are provided.
4.2
Technology used to Develop Log Analyzer Tool
As the thesis research follows the design science research methodology. There should be a tool to fulfils the research problem in the form of artefact. To develop the tool, following technology was used:
• MS Visual Studio 2015: MS Visual Studio 2015 with C# was used to develop the tool. The tool was a window-based application which runs on windows.
• Infragistics for Windows Forms: This is a third-party tool used in MS Visual Stu-dio to represents the data in different types of charts.
• Mind Fusion Diagramming for Windows Forms: This is a third-party tool used in MS Visual Studio to represents the activities flow diagrams.
database and then show them into the Log Analyzer Tool (name of the artefact developed for this thesis).
4.3
Structure Algorithm Development
Structure algorithm was developed to identify the processes and their sub processes. The clinical pattern had a unique log number, date and time, message type, message, generated from, and thread. Without identifying the processes and sub process thee process discov-ery algorithm cannot be applied and developed. The raw clinical event log files should be converted to the pattern which contains a case id (which uniquely identified the process and its steps) and other required columns. So that the algorithm identifies that case 1 process has two steps; case 2 process has four steps and so on.
For this purpose, it was necessary to look at the carescape patient monitor and analyse the menu and sub menus and identified what message was generated in the event log file
when the specific menu or submenu is clicked. By doing this the pattern of message gen-erated in the event log file is analysed. Figure 4.1 shows the clinical event log file.
As thesis research majorly focused on usability analysis, thus the focus of getting the only user clicked messages from event log files. GE clinical event log files contains different types of messages which include errors, information, alarms, users etc. The focus was on <USR> type messages. The raw clinical log files converted to a pattern with case ID look like Table 4.1.
4.3.1
Carescaer Patient Monitor Analysis
Figure 4.2 shows the carescape patient monitor software. In Figure 4.2 the bottom part contains the user menus which have submenus as well. The right side of the figure is the
Table 4.1: Event log with case id
parameter window where all the shortcuts of monitor functionality is displayed. It also has shortcut to the specific menu.
As the focus is on user messages, it is identified that the pattern for all the menus in the bottom and the parameter window on the right side should be checked. It is obvious that whenever something from these areas are clicked a process has started and previous should be ended as everything worked in sequence. There are menus which has sub menus and some of the menus have just stand-alone functionality and it doesn’t have any sub menus. For this a table was created in the database to identify that which menu was single and which menu was extended. The parameter window button on the right side was also considered as menu because these were also the shortcuts of some menus. The table structure of menu information is discussed in section 4.3.3.
4.3.2
Event log Message Pattern Recognition
For identifying the message pattern generated when any menu is clicked, there is a need to check and analyse the messages and find out what is common in main menus and sub
menus. Let’s take the example of “Alarm Setup” in bottom of the menu strip of carescape patient monitor. Figure 4.3 shows the Alarm Setup Submenu. And Figure 4.4 shows what message was generated in the event log file when the menu was clicked. The message is highlighted in the figure. The message is “Alarm Setup:MainMenuScr1” and when Close
button was clicked, “Close:Alarm Limits:Alarms Setup” message is generated. It looks like for all the menus in the bottom the pattern of the main menu message is name of the menu, then a colon and after that keyword that identified it was clicked from main menu screen area which is “MainMenuScr1”. Same thing goes with the parameter window area except it has the keyword as “Horizontal Screen 1” and “Vertical Screen 1”. So, it is extracted that if we take the keywords “MainMenuScr1”, “Horizontal Screen 1”, “Vertical Screen 1” as a process start activity and previous process close activity because in this scenario activities do not run in parallel, so previous activity must close before new ac-tivity start.
4.3.3
Database Table for Menu Information
To make the algorithm dynamic it’s better to have a table in the database that have all the information of menus. User can add new menus and change the names as the software revolve and changes done into the carescape patient monitor software. The structure of the database table looks like in Figure 4.5. For fields description see Appendix A.
4.3.4
Database Table for Condition
During testing it was seen that there were some menus whose click were not logged into the log file, considering those an exception and to cater this problem a table was created to save such conditions in the Condition table. User can add the condition to let the algo-rithm know that this is the start of the process. The structure of the database table looks like in Figure 4.6. For fields description see Appendix A.
Look at the message in Figure 4.7 to understand how to add condition. Figure 4.7 shows the log entry for USR type message. The highlighted message is parsed which is "NIBP Start:MainMenuScr1" as shown in Figure 4.8.
Figure 4.5: Database table for Menu Information
Figure 4.6: Database table for Condition
In this case, we know that all the messages which has "MainMenuScr1" keyword are the message from the parameter window of carescape patient monitor, and thus are the main messages to start the new activity or process. So, this is added into our condition list. Now look at the message again, the message must further split on the bases of ":" sign to get the exact MainmenuScr1 keyword. If string is split, the indexer starts with 0. So, while adding the new condition the condition Indexer is "1", the message is "MainMenuScr1".
Look at the messages in Figure 4.9 to understand the scenario of multiple condition. In Figure 4.9 the purple highlighted text is the log entry for USR type message. It has been checked that for some reasons the carescape patient monitor software was not logging the shortcut patient many click. This Close:Patient:Admit/Discharge is after that shortcut click which was not logged. So, it should be made as activity start as there is no other option. The message is parsed and the indexer for multiple condition as 0,1 is added as
now there is a need of two AND conditions like "Where message1 = "Close" AND mes-sage2 = "Patient"". In the Condition message the messages is added with comma sepa-rated, and condition type is added as Multiple.
Figure 4.8: Parse log entry
4.3.5
Pseudocode of Structure Algorithm
The structure algorithm was used to create the proper sequence of log data that could be used for creating the activities.
1 2 3 4 5 6 7 8 9 10 11 12 13 14 15 16 17 18 19 20 21 22
procedure make_structure(messages: array)
begin
integer structurecount, oldstruct = 0 for each row on the messages
messagesplit = split message by (':') if (splitstring length > 1)
if (check in conditions table if message is a start process)
status = check_process_status(Single or Extended) from menu table structurecount = structurecount + 1;
add structurecount and message info in tbl_structure table if (status == Extended)
oldstruct = structurecount
else
add oldstruct and message info in tbl_structure table else
if ("Silence Alarms"|| "Normal Screen") structurecount = structurecount + 1;
add structurecount and message info in tbl_structure table else
add structurecount and message info in tbl_structure table end for
end
Line 4 starts by having a loop that will traverse through all the messages. The message is then split based on delimiter colon (:) (Line 5). If the split length is greater than 1 then it is checked that if the message in consideration is a start process. In case if it’s a start process, the structure order count is added with other message info into the table ‘tbl_structure’ otherwise algorithm jumps to line 16 where there are conditions for sin-gleton messages. In line 11 there is a condition to check if process status is ‘extended’. This can be checked from menu table so that the upcoming messages can have the same structure order count that is being maintained in variable oldstruct (Line 12).
4.4
Process Discovery Algorithm Development
Process discovery algorithm was developed to make the activity flow of the user interac-tion with menus. For this algorithm, structured data from the database is used after apply-ing the structured algorithm. The data after applyapply-ing the structured algorithm looks like in Figure 4.10. In Figure 4.10 structure_order field represent the process relation. The
fields with id 1 belong with the same process. Field with id 2 belongs to the other process and so on.
For process discovery algorithm, a table was made to add the activities with their occur-rences and time. The message occuroccur-rences were calculated, its incoming and outgoing links and time taken on that activity as well. Figure 4.11 shows the table view of process discovery algorithm output. After that this table was used to view the activities in the form of activities chart in the Log Analyzer tool.
4.4.1
Pseudocode of Process Discovery Algorithm
The process discovery algorithm is used to find the activity count that how many times a user had clicked a menu so that it can be visualized by the users.
1 2 3 4 5 6 7 8 9 10 11 12 13 14 15 16 17 18 19
procedure make_dependency(structured messages: array)
begin
for each row on the structured messages integer link = 0
for each orderdata on the structured messages where structure_order = row check if message already exists in tbl_activities, save activity_link also if (message exist)
check if the link = activity_link if link is same
calculate activity_time increment the activity_count
update this information in tbl_activities to the same row else
add new row in tbl_activities with activity_time = 0, activity_count = 1 else
add new row in tbl_activities with activity_time = 0, activity_count = 1 end for
end for
end
Line 3 starts with a loop that traverses through the tbl_structure. In line 5 the rows are Figure 4.10: Structured data
taken from tbl_structure that have the structure_order equal to the row number in consid-eration. After that in Line 6 and 7 it is checked if the message already exists in the tbl_ac-tivities table, if not algorithm jump to line16 where a new row is added in table tbl_activ-ities, otherwise algorithm move to line 9 where algorithm checks if the current link is same as found in the table, if yes then update it with required information otherwise create a new row table tbl_activities.
4.5
Database Structure Development
Structure and tables information of the database is shown in this section in detail.
4.5.1
tblcases
This table is used to name the clinical log files in the form of cases. While importing any new file into the database there is a need to create the case name into the table to represent the file. Figure 4.12 shows the structure of the table. In the figure case_id represent as the primary key of the table. case_name is used to save the name of the case and case_date represent the date when the case is added.
4.5.2
tbldata
This table is used to save the raw data of a clinical log file which is imported under the case. Figure 4.13 shows the structure of the table. In the figure data_id represent as the primary key of the table. case_id is the foreign key of the case, where the data belongs. log_id is the unique id that is generated in the clinical log file and we save them as it is
Figure 4.12: tblcases structure
from the clinical log file. Log_date comes from the clinical log file which is the date and time of the log message. log_type comes from the clinical log files which represent which type of log entry is that. log_message contains the message. log_lineno represent the line no of code from where the message is generated. log_thread represent the thread of the log message.
4.5.3
tblstructureddata
This table is used to save the structured data from the raw data taken into tbldata table, and by applying the structure algorithm. Figure 4.14 shows the structure of the table. In the figure structure_id represent as the primary key of the table. case_id and data_id are foreign keys taken from tblcases and tbldata respectively. Structure_order represent the order number of the processes. Structure_date is same as log_date in the tbldata. struc-ture_type is same as log_type, structure _message is same as log_message, structure_lin-eno is same as log_linstructure_lin-eno and structure_thread is same as log_thread.
4.5.4
tblactivities
This table is used to save data after applying the discovery process algorithm on to the structured data. Figure 4.15 shows the structure of the table. In the figure activity_id rep-resent as the primary key of the table. case_id is the foreign key from tblcases. case_ac-tivity_id represent the unique order key within the case. activity_message represent the
Figure 4.13: tbldata structure
log message generated into the clinical log file. activity_link represent the link between the other activity message. activity_count represent the no of occurrence of that activity message and activity_time represent the time taken by that activity message.
4.5.5
tblmenuinfo
This table is used to add information about the menus in carescape patient monitors. Fig-ure 4.16 shows the structFig-ure of the table. In the figFig-ure menuinfo_id represent as the pri-mary key of the table. menu_type represent the name of the menu in clinical log file. menu_name represent the name of the menu shown in carescape patient monitor display. menu_status shows whether the menu is Single or Extended. type column shows that whether this entry in the table is normal or exceptional.
4.5.6
tblconditions
This table is used to apply the structure algorithm condition which shows when there a Figure 4.15: tblactivities structure
Figure 4.16: tblmenuinfo structure
process start and end. Figure 4.17 shows the structure of the table. In the figure condi-tion_id represent as the primary key of the table. condition_index represent the index position of the condition. condition_text represent the text of the condition. condi-tion_type represent that whether the condition is single of multiple and active is used to make condition active or inactive.
4.6
Log Analyzer Tool Features
As this research thesis followed the design science research approach and the artefact was in the form of tool. A tool was developed to fulfils the requirements of GE Healthcare and to solve the research problem. Name of the tool is “Log Analyzer”. The structure algo-rithm and process discovery algoalgo-rithm were implemented. The Log Analyzer tool's fea-tures are discussed in detail below.
4.6.1
Import File
The main idea of import file view is to add the log files data into the database table. As a database has created to automate the analysing of log files data, therefore there is a need of a view in the tool which import the log files. Also, the users wanted a view that can be used to import raw data (log files) into the system with a unique name. For this purpose, a view is created with options to add a case name (unique) first, then adding a single file
to the selected case. There is also an option to add multiple files at the same time with on click. This is done by using the bulk insertion feature in the tool. It is used when several files need to be imported under one case. Figure 4.18 shows the view of import file.
4.6.2
Data Statistics
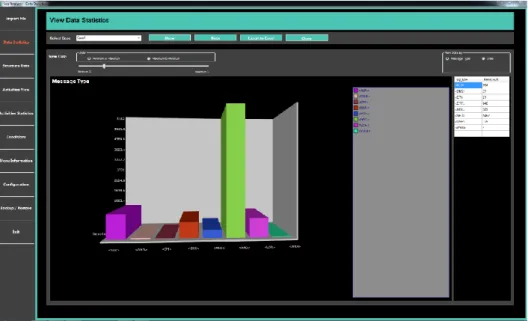
The user wanted to have a view where he/she would be able to visualize the statistics of a log file which is imported in the case based on the “Message type” and “Date”. The key thing about this view is that it shows the overall statistics of data. With this view the users have the idea what is inside the log files. Data statistics view is categorized into two types which are discussed below.
4.6.2.1
Data Statistics based on Message Type
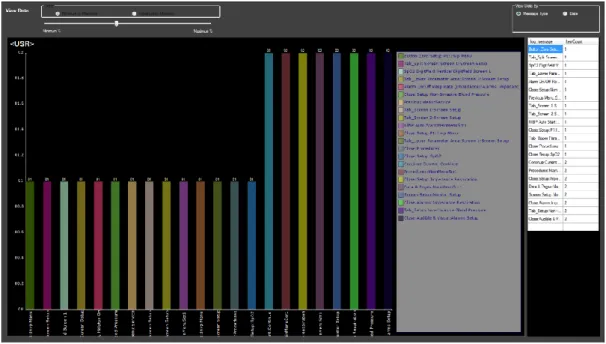
Figure 4.19 shows the data statistics view based on message type. From this view, user can view and analyse the data per the message type of the selected case. User can see that in the clinical log file how many user type messages are generated, and how many errors are there and vice versa. This will give an overall view of the data. User can go further to view the data count of selected message by clicking on the desired bar of message type.
When user click on any bar of message type it will give another view of specific message type and give further details of messages and their count. For example, if user click on
user type messages it will give the view displaying the user messages and its count. Figure 4.20 represent the further details of the message type statistics. This behaviour was in-tended by the user so that they can easily visualize the count of log that they are obtaining for the different message types and then to have a further drill down to a certain message type to see further details.
Other than that, the user wanted to have a filter where they would be able to filter the data set based on the criteria of maximum or minimum count. For example, user can use the filter bar to show only top 10 highest count or top 10 lowest count messages. Minimum to maximum and maximum to minimum radio button represents to show data sorting. There is a track bar which is used to manage the number of messages to show.
Just like the visual form, the user also wanted to have the data in tabular form and for this reason the same information is shown in a tabular format that can be seen on the right-side panel of Figure 4.20. With the help of this user would be able to easily find infor-mation.
4.6.2.2
Data Statistics based on Date
The other view that user wanted was the statistics based on the date. Figure 4.21 shows the data statistics view based on date. From this view, user can view and analyse the data based on date of the selected case. The same view could then be drilled down to a specific date as the user wanted to see the view with analysis based on a single date. Further details
are message type’s occurrence on the selected dates, moreover it will provide the time of the messages and then following is messages as in the message type-based view.
Thus, if user click on the specific date slice in the pie chart, user will be redirected to the bar chart view with message types occurred on specific date. See Appendix C for figures which represent the message type bar chart with the date filter and the views that users intended to have.
Figure 4.21: Data statistics view based on date
4.6.3
Structure Data
An activity is need for the tool that has the information of date, from where it is generated and duration. For activity creation, there is a need to run the algorithms which are struc-ture algorithm that make the strucstruc-ture on the log file and process discovery algorithm that will discover the process in the log file. for this purpose, structure data view is created to apply both the structure algorithm and process discovery algorithm on the raw log data imported under a case. First, structure algorithm will run on the raw clinical log file after that process discovery algorithm will run on the structured data. Figure 4.22 shows the structure data view.
4.6.4
Activities View
All the data imported in the log file is in tabular form. It is a good idea to represent the data in a graphical form to make it more readable and understandable. The user also wanted to have a view that can show the user activities in the form of processes extracted from the clinical log file. For this purpose, activities view is created. Figure 4.23 shows the activities view in the tool.
This view has many features. From this the data can be shown as per frequency, which means that activities show the number of occurrences between the links. Figure 4.24 shows the activities with frequency.
The data can also be shown as per Performance, which means that activities shows the total time spent between the corresponding activities. Figure 4.25 shows the activities with frequency.
User can jump to the raw log data to see the other messages with different message type other than USR type messages by clicking on the specific activity. The process discovery algorithm is only applied on the USR type messages, so sometimes there is a need to see the other messages with that specific activity to understand the scenario. Figure 4.26 shows the data lookup with highlighted messages.
Figure 4.24: Activities view with frequency
There is also a feature to export the activity diagram to specific location in the form of pdf file for further use and analysis.
4.6.5
Activities Statictics
Just like the activities view there is a need for a view where user show the activity statis-tics in the form of charts and numbers. The activity view provides the chart in the form of processes but cannot show that which menu is used more frequently, or which is used less. For this reason, activity statistics view is created. In this view activities are shown according to the case and the activities name and its occurrence count is seen in the chart. The data can also be shown in tabular form on the right-side panel. Figure 4.27 shows the activities statistics view and Figure 4.28 shows sub activities. The view is used to see specifically which feature or activity has more occurrence, and which is not used at all. The user can also export the data in excel for further analysis. There is also a limitation of not seeing the very long messages names. Hence, for this reason the export function-ality is used to see the long messages.
Figure 4.28: Activities statistics view with sub activities Figure 4.27: Activities statistics view
4.6.6
Condition
As discussed in section 4.3.4 there are some exception where the carescape patient mon-itor is not generating the log message in the log files. For that purpose, a condition mech-anism is created where these types of exceptions are added into the database to let the algorithm know that this is an exception scenario and process start or end is calculated. Hence there is also a need for a view where these conditions can be added as the proposal was to make the tool dynamic. In order to do this a view is created with the name condition to add all the exception conditions. The writing or the condition is discussed in detail in section 4.3.4. Figure 4.29 shows the condition view.
4.6.7
Menu Information
As proposed the tool should be dynamic, it means if there are any changes in the carescape patient monitor menu the tool should work. For this purpose, there is a need of a view where user can add or update menu information which is used in the structure and process discovery algorithm. This menu view is serving this purpose. It is used to add the menu information of the carescape patient monitor. This menu information will provide the functionality to structure algorithm about menu is single or extended. Figure 4.30 shows the menu information view.
![Figure 2.1: Process mining types [SS14]](https://thumb-us.123doks.com/thumbv2/123dok_us/10118308.2912388/11.892.198.666.260.627/figure-process-mining-types-ss.webp)
![Figure 2.2: Process mining types in terms of input and output [A12]](https://thumb-us.123doks.com/thumbv2/123dok_us/10118308.2912388/12.892.220.705.355.678/figure-process-mining-types-terms-input-output-a.webp)
![Figure 2.6 shows the formalization of alpha algorithm. The overview of the alpha algo- algo-rithm at high level is as follows [PM16]:](https://thumb-us.123doks.com/thumbv2/123dok_us/10118308.2912388/17.892.174.683.92.315/figure-shows-formalization-alpha-algorithm-overview-alpha-follows.webp)
![Figure 3.1: Design science research framework by March et al. [MS95]](https://thumb-us.123doks.com/thumbv2/123dok_us/10118308.2912388/21.892.194.701.764.1044/figure-design-science-research-framework-march-et-ms.webp)
![Figure 3.2: Design science research process by Takeda et al. [TVY90]](https://thumb-us.123doks.com/thumbv2/123dok_us/10118308.2912388/23.892.201.683.253.703/figure-design-science-research-process-takeda-et-tvy.webp)
![Figure 3.3 shows the design science model proposed by Hevner et al. [HMP04]. This model explicitly has two modes which is develop/build and justify/evaluate](https://thumb-us.123doks.com/thumbv2/123dok_us/10118308.2912388/24.892.187.699.556.954/figure-science-proposed-hevner-explicitly-develop-justify-evaluate.webp)
![Figure 3.4: Mapping of Hevner el al. [HMP04] framework on thesis research](https://thumb-us.123doks.com/thumbv2/123dok_us/10118308.2912388/25.892.177.716.155.527/figure-mapping-hevner-el-hmp-framework-thesis-research.webp)