Systematic Review
The role of diffusion-weighted MRI and
18
F-FDG PET/CT in the prediction
of pathologic complete response after radiochemotherapy for rectal
cancer: A systematic review
Ines Joye
a,b,⇑, Christophe M. Deroose
c, Vincent Vandecaveye
d, Karin Haustermans
a,b aDepartment of Radiation Oncology, University Hospitals Leuven;b
Department of Oncology, KU Leuven;c
Department of Nuclear Medicine, University Hospitals Leuven; and
d
Department of Radiology, University Hospitals Leuven, Belgium
a r t i c l e
i n f o
Article history:
Received 29 September 2014
Received in revised form 13 November 2014 Accepted 13 November 2014
Keywords:
Rectal cancer Diffusion-weighted MRI 18F-FDG PET/CT
Pathological complete response Radiochemotherapy
a b s t r a c t
After neoadjuvant radiochemotherapy (RCT) for locally advanced rectal cancer, 15–27% of the patients experience a pathological complete response (pCR). This observation raises the question as to whether invasive surgery could be avoided in a selected cohort of patients who obtain a clinical complete response after preoperative RCT. In this respect, there has been growing interest in functional imaging techniques to improve clinical response assessment. This systematic review focuses on the role of diffusion-weighted imaging (DWI) and 18F-fluorodeoxyglucose positron emission tomography/computed tomography (18F-FDG PET/CT) in the prediction of pCR after RCT for rectal cancer.
A total of 14 publications on DWI and 25 on18F-FDG PET/CT were retrieved. Pooled analysis of individ-ual patient data shows both imaging modalities have a low positive predictive value in the prediction of pCR (mean PPV of 54% and 39% for DWI- and18F-FDG PET/CT-based parameters respectively). Especially pre-RCT imaging is unable to predict pCR with overall accuracies of 68–72% for DWI and 44% for18F-FDG PET/CT. Qualitative DWI assessment 5–10 weeks after the end of RCT may outperform apparent diffusion coefficient (ADC)-based DWI-parameters (overall accuracy of 87% vs. 74–78%). Although few data are available, early changes in FDG-uptake seem promising in the prediction of pCR and the role of 18F-FDG PET/CT during RCT should be further investigated. Quantitative and qualitative18F-FDG PET/ CT measurements are equally effective in the assessment of pCR after RCT.
The major strength of DWI and18F-FDG PET/CT lies in the identification of non-responders who are not candidates for organ preservation. Up to now, DWI and18F-FDG PET/CT are not accurate enough to safely select patients for organ-sparing strategies. Future research must focus on the integration of functional imaging with clinical data and molecular biomarkers.
Ó2014 Elsevier Ireland Ltd. Radiotherapy and Oncology 113 (2014) 158–165 This is an open access article under the CC BY-NC-ND license (http://creativecommons.org/licenses/by-nc-nd/3.0/).
Neoadjuvant radiochemotherapy (RCT) followed by total meso-rectal excision (TME) surgery is currently the standard treatment for locally advanced rectal carcinoma[1–3].The tumoral response to this preoperative treatment is very heterogeneous: while 15–27% of the patients achieve a pathological complete response (pCR), a partial response is seen in 54–75% and others show no response at all[4].Patients who achieve a pCR have a favorable long-term outcome with excellent local control and disease-free survival regardless of their initial T- and N-stages[4–6]. Retrospec-tive studies from Brazil have highlighted the ‘wait-and-see’ policy in such patients[7].More recent series support the feasibility of this approach[8,9].Adopting a non-operative strategy for clinical
complete responders will avoid the risks of surgical morbidity and mortality, and will spare them the need for a stoma[10–12]. However, before a ‘wait-and-see’ policy could be safely imple-mented, a precise selection of the eligible patients is mandatory.
The gold standard for assessing the tumoral response to preoper-ative RCT is conventional histopathological analysis. This method, however, is only applicable in the postoperative setting and consequently cannot be used for the preoperative selection for an individualized treatment. Computed tomography (CT), endorectal ultrasound (EUS) and conventional magnetic resonance imaging (MRI) have shown to lack accuracy for restaging after RCT[13–16]. In recent years, there has been growing interest in functional imag-ing techniques to improve clinical response assessment. These imaging modalities depict the microstructural and metabolic char-acteristics of the tumor, allowing assessment of treatment-induced changes before morphological changes become apparent. In this
http://dx.doi.org/10.1016/j.radonc.2014.11.026 0167-8140/Ó2014 Elsevier Ireland Ltd.
This is an open access article under the CC BY-NC-ND license (http://creativecommons.org/licenses/by-nc-nd/3.0/). ⇑Corresponding author at: Leuven Cancer Institute, University Hospitals Leuven,
Herestraat 49, 3000 Leuven, Belgium.
E-mail address:[email protected](I. Joye).
Contents lists available atScienceDirect
Radiotherapy and Oncology
j o u r n a l h o m e p a g e : w w w . t h e g r e e n j o u r n a l . c o mrespect, diffusion-weighted imaging (DWI) and18
F-fluorodeoxyglu-cose positron emission tomography/computed tomography (18
F-FDG PET/CT) have emerged as powerful tools in the response predic-tion before, during and after neoadjuvant RCT for rectal cancer.
DWI is a non-invasive imaging modality, providing functional information on the microstructure of tissues through the assess-ment of differences in water proton mobility[17].Water diffusion characteristics depend on several factors such as cell density, vas-cularity, viscosity of the extracellular fluid and cell membrane integrity. By quantifying these properties as the apparent diffusion coefficient (ADC), DWI can be used as an imaging biomarker to monitor and predict tumoral response to RCT[18,19].
18
F-FDG PET semi-quantitatively assesses tumor glucose metabolic activity through changes in FDG-uptake. A decrease in FDG-uptake after radiotherapy and/or chemotherapy has been cor-related with pathological response in several tumor types[20–22].
In this systematic review, we collect the current evidence of the role of DWI and18F-FDG PET/CT in the prediction of pCR after
pre-operative RCT for locally advanced rectal cancer.
Materials and methods
Search strategy and selection criteria
The MEDLINE and Embase databases were searched for the terms (‘‘rectal cancer’’ AND ‘‘diffusion magnetic resonance imag-ing’’ AND ‘‘response’’) and for (‘‘rectal cancer’’ AND ‘‘positron emis-sion tomography’’ AND ‘‘response’’) (29 September 2014) [23].
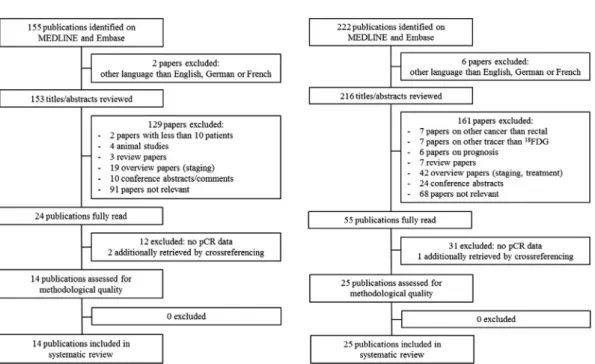
These initial searches yielded 155 and 222 publications respec-tively. Only papers published in English, German, and French were included, resulting in 153 and 216 articles. All titles and abstracts were screened and only studies reporting on the role of DWI or
18F-FDG PET in the assessment of pCR after RCT for locally
advanced rectal cancer were retained. Reviews, general overview articles and congress abstracts were excluded. To identify addi-tional relevant studies, the reference lists of the retrieved studies were checked manually. A total of 14 relevant DWI and 2518
F-FDG PET/CT papers were identified. Selected studies were evalu-ated for methodological quality using the quality assessment of
diagnostic accuracy studies (QUADAS) criteria [24]. Literature selection results are depicted in Fig. 1. A meta-analysis was not performed due to the wide heterogeneity between the included studies.
Data extraction
We extracted all available data on the performance of following quantitative DWI parameters: pretreatment ADC (ADCpre), ADC
during RCT (ADCduring), posttreatment ADC (ADCpost), change in
ADC during RCT (DADCduring) and change in ADC after RCT
(DADCpost). Additionally, volumetric data and data on qualitative
DWI assessment were collected. Following18F-FDG PET/CT
param-eters were retained: the mean and maximum standardized uptake value (SUV) measured before (SUVmeanpre, SUVmaxpre), during
(SUVmeanduring, SUVmaxduring) and after RCT (SUVmeanpost,
SUV-maxpost). The absolute change in SUVmax (DSUVmax) and the
response indices were also extracted (RI SUVmean, RI SUVmax), as
was the total lesion glycolysis (TLG) and the metabolic tumor vol-ume (MTV). The visual response score (VRS) was retained as a qualitative parameter.
Some papers used receiver operating characteristic (ROC) anal-ysis to calculate cutoff values for the individual response parame-ters. A ROC curve plots the true positive rate against the false positive rate at various threshold settings, thereby allowing to cal-culate optimal cutoff values. If cutoff values were provided, 22 contingency tables were constructed and the sensitivity, specific-ity, positive and negative predictive values of DWI and18F-FDG PET/CT in the prediction of pCR were calculated (Suppl Fig. 1). We defined the sensitivity for pCR prediction as the fraction of patients with pCR that is correctly identified as such by imaging. The specificity is the fraction of patients without pCR correctly identified as such by DWI or18F-FDG PET/CT. The positive
predic-tive value (PPV) reflects the probability that a complete response on imaging is confirmed by pathological examination. Conversely, the negative predictive value (NPV) reflects the probability that an incomplete response on imaging is confirmed by pathology. Finally, when available, individual patient data (i.e. true positives, false positives, true negatives and false negatives) were extracted
to calculate a pooled accuracy of the retained DWI and18F-FDG
PET/CT parameters.
Results
Nine papers reported on the role of ADCprein the prediction of
pCR (Table 1). Three articles found that a low pretreatment ADC significantly correlated with pCR[25–27].Our group demonstrated that a pretreatment ADC lower than 1.0610 3mm2/s predicted
pCR with a sensitivity of 100%, specificity of 86% and overall accu-racy of 90%[25].In a larger patient group, Intven et al. found that a pretreatment ADC lower than 0.9710 3correctly predicted pCR
with an overall accuracy of 81%, but with a sensitivity of only 56%
[27].Pooled data show ADCprepredicts pCR with a NPV of 90% and
a specificity of 68%, but with a PPV of only 35%. In a study of 20 patients it was demonstrated that the change in ADC after 10–15 fractions of radiation therapy (DADCduring) was significantly
corre-lated with pCR[25]. ROC analysis showed an area under the curve (AUC) of 100% at a cutoff point of 50%. Volumetric assessment of DWI prior to RCT has no value in the prediction of pCR, as shown by three papers[29,33,34].
Seven papers demonstrated that a high ADCpostvalue
signifi-cantly correlated with pCR (Table 2).In a retrospective analysis of 40 patients, Kim et al. found that a mean ADCpost> 1.2010 3
mm2/s predicted pCR with a sensitivity and overall accuracy of
100% and 85% respectively[35]. The same authors confirmed this in a larger retrospective study of 76 patients, although the optimal cutoff increased to 1.3010 3mm2/s [28]. Conversely,
Curvo-Semedo et al. reported a lower ADCpostin patients who achieved
pCR, although this was not significant[29].Four papers found that an ADC increase of 41–48% was predictive for pCR[25,27,28,31].
Pooled analysis shows a moderate performance of late quantitative DWI assessment with overall accuracies of 74% and 78% for ADCpost
andDADCpostrespectively. In contrast to pre-RCT DWI, volumetric
assessment after RCT might be a valuable tool for pCR prediction
[29,33,34]. Pooled analysis demonstrates that volumetric DWI measurements after RCT can predict pCR with a sensitivity and an overall accuracy of 65% and 90%. Relative changes in tumor volume on DWI can predict pCR with a sensitivity and accuracy of 83% and 85% respectively.
Four articles demonstrate that late qualitative DWI assessment can predict pCR with a pooled specificity of 94% and an overall
accuracy of 87%, thereby outperforming quantitative DWI mea-surements[30,36–38].
Thirteen papers reported on the performance of SUVmaxpreor
SUVmeanprein the prediction of pCR (Table 3). Only one article
found a statistically significant correlation between a low SUV-maxpre and pCR [39]. Individual patient data from two studies
demonstrate that SUVmaxprepredicts pCR with a specificity and
overall accuracy of only 35% and 44% respectively[42,43]. Early response prediction by18F-FDG PET/CT during RCT seems more
promising (Table 4). Based on PET data after 10–12 fractions, our group demonstrated that a RI SUVmaxthreshold value of 40%
cor-rectly identified all patients who achieved pCR [26]. Recently, Goldberg et al. found that only after one week a decrease in SUVmax
of more than 32% could predict the achievement of pCR with a sen-sitivity of 75% and a specificity of 100%[46]. Pooled analysis shows a PPV and overall accuracy of 69% and 88% respectively for SUV measurements during RCT.
We found 14 articles reporting on posttreatment SUV as a semi-quantitative parameter for the assessment of pCR (Table 5). SUV-maxposttends to be lower in patients without residual tumor cells
than in patients with suboptimal treatment response. Optimal cut-off points to discriminate patients who achieve pCR from those who do not, vary between 3.35 and 5.4[41–45,48,50].
The most studied PET parameter in late response prediction is the relative change in SUV measured before and after RCT (RI SUV-maxpostand RI SUVmeanpost). A higher decrease in SUV was found
predictive for pCR by seven authors[26,41,44,45,50–52].Optimal cutoff values for RI SUVmaxpostvary from 45.9% to 76%.
In eleven studies,18F-FDG PET/CT scans were interpreted sub-jectively by visual inspection. Pooled data show qualitative analy-sis after RCT is able to assess pCR with a negative predictive value of 89% and an overall accuracy of 65%, which is comparable to the quantitative SUV measurements post-RCT. Three articles investi-gated changes in MTV and TLG as a response parameter, but only Sun and co-workers found a relative decrease in MTV and TLG after 5–7 weeks significantly predictive for pCR[47,49,52].
Discussion
In this systematic review, we collect the current evidence of the role of DWI and18F-FDG PET/CT in the prediction of pCR before,
during and after RCT for rectal cancer (Fig. 2).
Table 1
Early pCR prediction with DWI.
Study N pCR
(%)
b-Values (s/mm2
), field strength DWI parameter Correlation with pCR p -Value Cutoff* Sens (%) Spec (%) PPV (%) NPV (%) Acc (%)
Lambrecht[25] 20 30 b0-50-100-500-750-1000, 1.5 T ADCpre Negative 0.003 1.0610 3
100 86 75 100 90
Lambrecht[26] 22 27 b0-50-100-500-750-1000, 1.5T ADCpre Negative 0.002 1.0610 3
100 88 75 100 91
Intven[27] 59 15 b0-200-800, 3T ADCpre Negative 0.01 0.9710 3 56 86 42 92 81
Kim[28] 76 14 b0-600-1000, 1.5T ADCpre Negative 0.4094 0.9110 3
82 39 18 93 45 Curvo-Semedo [29] 49à 27 b0-500-1000, 1.5T ADCpre Negative 0.61 0.97 10 3 39 81 42 78 69 50 28 VDWIpre Negative 0.16 12.5 57 78 50 52 72
Engin[30] 30 30 b50-400-800, 1.5T ADCpre Positive 0.066
Lee[31] 38 24 b0-1000 ADCpre None 0.972
Genovesi[32] 28 36 b0-400-500-600-800-1000, 3T ADCpre Negative 0.33
Ha[33] 100 35 b0-150-1000, 1.5T ADCpre Positive 0.484 VDWIpre Positive 0.742 Lambregts[34] 112 18 b 0-25-50-100-300-500-1000-1100, 1.5T VDWIpreR1 Negative NA 12.5 55 71 29 88 68 VDWIpreR2 Negative NA 12.5 70 78 41 92 77
Pooled data 226 20 ADCpre 69 68 35 90 68
274
20 VDWIpre 61 75 38 89 72
Acc = accuracy; ADC = apparent diffusion coefficient; DWI = diffusion weighted imaging; N = number of patients; NA = not available; NPV = negative predictive value; pCR = pathologic complete response; PPV = positive predictive value; R = radiologist; Sens = sensitivity; Spec = specificity; T = Tesla; V = volume.
*Cutoff values of ADC are in mm2
/s, cutoff values of volumes are in cm3 .
àIn one patient, ADC measurements were not obtained because the tumor had an entirely mucinous aspect. To obtain pooled data, N was multiplied by the number of participating radiologists.
Table 2
Late pCR assessment with DWI.
Study N pCR
(%)
b-values (s/mm2
), field strength DWI parameter Interval RCT-DWI (weeks)
Correlation with pCR
p-value Cutoff* Sens
(%) Spec (%) PPV (%) NPV (%) Acc (%) Quantitative analysis
Lambrecht[25] 20 30 b0-50-100-500-750-1000, 1.5T DADCpost(%) 5–7 Positive 0.0011 48% 100 93 86 100 95
Intven[27] 59 15 b0-200-800, 3T ADCpost 4–8 Positive 0.047
DADCpost(%) Positive <0.001 41% 78 92 64 96 90
Kim[28] 76 14 b0-600-1000, 1.5T ADCpost 4–6 Positive <0.0001 1.3010 3
100 85 52 100 87 DADCpost(%) Positive <0.0001 42% 100 71 37 100 75 Curvo-Semedo [29] 49à 27 b0-500-1000, 1.5T ADCpost 6–8 Negative 0.48 1.4110 3 46 56 27 74 53 DADCpost(%) Negative 0.96 25.3% 54 64 35 79 61 50 28 VDWIpost Negative <0.001 0.15 79 100 100 92 94 DVpost(%) positive <0.001 97.5% 86 89 75 94 88
Engin[30] 30 30 b50-400-800, 1.5T ADCpost 6 Positive 0.071
Lee[31] 38 24 b0-1000 ADCpost 6 Positive 0.037
DADCpost(%) Positive 0.026
Genovesi[32] 28 36 b0-400-500-600-800-1000, 3T ADCpost 8 Positive 0.003
Ha[33] 100 35 b0-150-1000, 1.5T ADCpost NA Positive <0.001 1.2010 3 71 65 52 81 67 VDWIpost Negative <0.001 DVpost(%) Positive <0.001 86.8% 91 80 71 95 84 Lambregts[34] 112 18 b 0-25-50-100-300-500-1000-1100, 1.5T VDWIpostR1 NA Negative NA 0.15 60 98 86 92 91 VDWIpostR2 Negative NA 0.15 60 92 63 91 87 DVpost(%) R1 Positive NA 97.5% 80 93 73 96 91 DVpost(%) R2 Positive NA 97.5% 70 82 45 93 79
Kim[35] 40 28 b0-1000, 1.5T ADCpost 4–6 Positive <0.0001 1.2010 3 100 79 65 100 85
Song[36] 50 12 b0-100-800-1000, 3T ADCpost 6 Positive <0.0001 1.04510 3100 75 35 100 78
Pooled data 315 24 ADCpost 78 72 47 91 74
204 19 DADCpost(%) 80 78 46 94 78
274 20 VDWIpost 65 96 80 92 90
374 24 DVpost(%) 83 86 65 94 85
Qualitative analysis
Engin[30] 30 30 b50-400-800, 1.5T Signal intensity 8 22 100 100 75 77
Song[36] 50 12 b0-100-800-1000, 3T VRS R1 6 33 98 67 92 90 VRS R2 50 91 43 93 86 Lambregts[37] 120 19 b0-1000, 1.5T VRS R1 5–10 56 94 70 89 86 VRS R2 64 90 62 90 84 VRS R3 52 97 81 89 88 Sassen[38] 70 14 b0-300-1100 (n= 59) b0-500-100 (n= 11), 1.5T VRS R1 6 70 93 64 95 90 VRS R2 40 98 80 91 90 Pooled data 630⁄ 18 Qualitative analysis 53 94 68 90 87
Acc = accuracy; ADC = apparent diffusion coefficient; DWI = diffusion weighted imaging; N = number of patients; NA = not available; NPV = negative predictive value; pCR = pathologic complete response; PPV = positive predictive value; R = radiologist; RCT = radiochemotherapy; Sens = sensitivity; Spec = specificity; T = Tesla; V = volume; VRS = visual response score.
* Cutoff values of ADC are in mm2
/s, cutoff values of volumes are in cm3 .
àIn one patient, ADC measurements were not obtained because the tumor had an entirely mucinous aspect.
Table 3
Early pCR prediction with18F-FDG-PET/CT.
Study N pCR (%) PET parameter Correlation PET and pCR p-Value Cutoff Sens
(%) Spec (%) PPV (%) NPV (%) Acc (%)
Perez[39] 99 7 SUVmaxpre Negative 0.043
Konski[40] 53 30 SUVmaxpre Positive 0.71
Capirci[41] 81 27 SUVmaxpre Positive 0.097 13.9
Palma[42] 50 22 SUVmaxpre Negative 0.149 10.14 46 74 33 83 68
Martoni[43] 80 20 SUVmaxpre Negative NA 27 100 11 20 100 29
Hur[44] 37 35 SUVmaxpre Negative 0.838
Shanmugan[45] 70 26 SUVmaxpre Positive 0.6
Goldberg[46] 19 21 SUVmaxpre Positive 0.617
Guillem[47] 121 21 SUVmaxpre NA n.s.
SUVmeanpre NA n.s.
Kim[48] 151 13 SUVmaxpre Negative 0.064
Lee[49] 81 6 SUVmaxpre Negative 0.675
SUVmeanpre Negative 0.675
Bampo[50] 30 30 SUVmaxpre Negative 0.08
Van Stiphout[51] 114 21 SUVmaxpre Negative 0.29
Pooled data 130 21 SUVmaxpre 78 35 24 86 44
Acc = accuracy; NPV = negative predictive value; N = number of patients; NA = not available; n.s. = not significant; pCR = pathologic complete response; PET = positron emission tomography; PPV = positive predictive value; Sens = sensitivity; Spec = specificity; SUV = standardized uptake value.
Table 4
pCR prediction during RCT with18
F-FDG-PET/CT.
Study N pCR (%) PET parameter Correlation PET and pCR Timing PET p-Value Cutoff Sens
(%) Spec (%) PPV (%) NPV (%) Acc (%)
Lambrecht[26] 22 27 RI SUVmaxduring Positive After 10–12 fractions 0.0036 40% 100 75 60 100 82
Goldberg[46] 19 21 SUVmaxduring Positive After 8 days 0.841
RI SUVmaxduring Positive After 8 days 0.046 32% 75 100 100 94 95
Bampo[50] 30 30 SUVmaxduring Negative After 2 weeks 0.32
RI SUVmaxduring Positive 0.23
Pooled data 41 24 RI SUVmaxduring 90 87 69 96 88
Acc = accuracy; NPV = negative predictive value; N = number of patients; pCR = pathologic complete response; PET = positron emission tomography; PPV = positive predictive value; RCT = radiochemotherapy; RI = response index; Sens = sensitivity; Spec = specificity; SUV = standardized uptake value.
Table 5
Late pCR assessment with18F-FDG-PET/CT.
Study N pCR (%) PET parameter Correlation PET and pCR Interval RCT-PET (weeks) p-Value Cutoff Sens (%) Spec (%) PPV (%) NPV (%) Acc (%) Quantitative analysis
Lambrecht[26] 22 27 RI SUVmaxpost Positive 5 0.013 76% 100 75 60 100 82
Perez[39] 99 7 SUVmaxpost Negative 6 0.23
SUVmaxpost Negative 12 0.15
RI SUVmaxpost Negative 6 0.87
RI SUVmaxpost Negative 12 0.96
Konski[40] 53 30 SUVmaxpost Positive 3–4 0.18
RI SUVmaxpost Positive 5–6 0.08
Capirci[41] 81 27 SUVmaxpost Negative <0.0001 5.2
RI SUVmaxpost Positive <0.0001 45.90%
DSUVmax Positive 0.296 6.4
Palma[42] 50 22 SUVmaxpost Negative 5–7 0.013 4.07 64 74 41 88 72
RI SUVmaxpost Positive 0.354 69.67% 46 74 33 83 68
DSUVmax Negative 0.594
Martoni[43] 80 20 SUVmaxpost Negative 6–7 NA 5 88 34 25 90 45
RI SUVmaxpost Positive NA 66.10% 94 31 25 95 44
Hur[44] 37 35 SUVmaxpost Negative 4 <0.001 3.35 85 79 69 91 81
RI SUVmaxpost Positive 0.009 75.00% 69 83 69 83 78
DSUVmax Positive 0.404
Shanmugan[45] 70 26 SUVmaxpost Negative 4 0.01 4 78 58 39 88 63
RI SUVmaxpost Positive 0.002 63.00% 83 60 42 91 66
Guillem[47] 121 21 RI SUVmaxpost NA 4–6 n.s.
RI SUVmeanpost NA n.s.
Kim[48] 151 13 SUVmaxpost Negative 5–7 <0.001 3.55 74 64 23 94 65
RI SUVmaxpost Positive 0.19
DSUVmax Negative 0.312
Bampo[50] 30 30 SUVmaxpost Negative 6 0.01 5.4 100 81 69 100 87
RI SUVmaxpost Positive 0.035
Van Stiphout[51] 114 21 SUVmaxpost Negative <0.001
RI SUVmaxpost Positive <0.001
Sun[52] 35 31 RI SUVmaxpost Positive 1 0.932
RI SUVmaxpost Positive 5–7 0.045
RI SUVmeanpost Positive 1 0.444
RI SUVmeanpost Positive 5–7 0.019
Huh[53] 181 14 RI SUVmaxpost Positive 5 NA 63.60% 73 65 26 94 66
Pooled data 418 21 SUVmaxpost 80 61 35 92 65
440 20 RI SUVmaxpost 77 60 42 91 64 Qualitative analysis Lambrecht[26] 22 27 VRS 5 50 88 60 82 77 Song[36] 50 12 VRS 6 83 43 17 95 48 Guillem[47] 121 21 VRS 4–6 54 66 30 84 64 Capirci[54] 81 35 VRS 4 79 45 43 80 57 Kalff[55] 30 20 VRS 3–4 83 50 29 92 57 Vliegen[56] 20 10 VRS 6.3 50 94 50 94 90 Kristiansen[57] 30 27 VRS 7 75 46 33 83 53 Kalff[58] 63 16 VRS 4–5 80 62 29 94 65 Cho[59] 30 13 VRS 6 75 85 43 96 83 Mak[60] 20 35 VRS 3–6 71 85 71 85 80 Murcia Duréndez[61] 41 20 VRS 7 100 76 50 100 81 Pooled data 508 22 VRS 72 63 35 89 65
Acc = accuracy; NPV = negative predictive value; N = number of patients; NA = not available; n.s. = not significant; pCR = pathologic complete response; PET = positron emission tomography; PPV = positive predictive value; RCT = radiochemotherapy; RI = response index; Sens = sensitivity; Spec = specificity; SUV = standardized uptake value; VRS = visual response score.
Response assessment during RCT could possibly re-orientate non-responding patients to a different treatment modality (e.g. surgery) or to treatment intensification (e.g. dose escalation or addition of targeted agents)[62]. Some authors found that a low pretreatment ADC was correlated with a good response to treat-ment. Similar findings have been reported in brain tumors[63]
and in hepatic metastases of colorectal cancer[64].The association between the pretreatment ADC and tumor response is hypothe-sized to be correlated to the presence of necrotic areas (character-ized by a high ADC), in which tumor cells are exposed to a more acidic and hypoxic environment, diminishing the effectiveness of radiation therapy and chemotherapeutic agents[64,65]. However, coagulative necrosis without cell liquefaction may not increase ADC and this might be the reason why tumors do not respond well to neoadjuvant RCT, although they have a low pretreatment ADC. It should be stressed however that this hypothesis has not yet been confirmed by radiological-pathological correlative studies. While baseline18F-FDG PET/CT itself has limited value in response pre-diction, the relative change in SUVmax during RCT seems more promising. A higher decrease in FDG-uptake represents a smaller amount of metabolically active tumor cells, indicating response to treatment.
Response assessment before surgery enables physicians to offer patients who achieve a clinical complete response less extensive surgery or even a ‘wait-and-see’ policy. Pooled analysis showed that qualitative DWI assessment had a higher accuracy in pCR pre-diction than quantitative analysis (87% vs. 74–78%). However, with respect to sensitivity, ADC measurements outperformed subjective visual assessment (78–80% vs. 53%), indicating that quantitative analysis is more accurate in detecting patients with pCR. Quantita-tive and qualitaQuantita-tive18F-FDG PET/CT evaluations are equally perfor-mant in the preoperative assessment of complete response.
Most studies suffer from a retrospective design and a low num-ber of patients. In an attempt to assess the performance of the dif-ferent imaging parameters, we pooled the available individual patient data. Most authors provide cutoff values based on ROC analysis, which aims at the maximal accuracy of response predic-tion. However, this maximal accuracy may not necessarily repre-sent the most desirable clinical parameter. For instance, we believe a high PPV and specificity are mandatory if alteration of
the surgical strategy is considered. A low specificity and PPV may correlate with many false positives, corresponding to residual tumor on pathology whereas the DWI or18F-FDG PET/CT images
show no evidence of disease. In general, DWI and18F-FDG PET/CT
had a high NPV in the prediction of pCR, making these functional imaging techniques potential valuable tools to deselect patients for a conservative treatment approach. Unfortunately, both imag-ing modalities lack the specificity and PPV needed to safely select patients for a ‘wait-and-see’ policy.
The combination of different functional imaging techniques at different time points may increase the specificity for pCR predic-tion. Our group previously showed that the combination of early and late RI SUVmaxpostthresholds increased the specificity in the
prediction of pCR (75% for the individual threshold values vs. 94% when combined)[26].We also demonstrated that the combination of 18F-FDG PET/CT with pretreatment DWI may further increase
the specificity of response assessment. Although this study only included 22 patients, the combination of different imaging modal-ities at different time intervals is at least hypothesis-generating and deserves further investigation. Combined PET/MRI cameras might make these evaluations logistically less cumbersome. Van Stiphout et al. demonstrated that the integration of functional imaging and clinical data might also contribute to the accuracy of pCR assessment [51]. This group developed and validated a nomogram for pCR prediction by collecting population-based dat-abases of 953 patients from 4 different institutes. These datdat-abases were divided into three groups: clinical factors (762 patients), pre-RCT18F-FDG PET-CT (151 patients) and post-RCT18F-FDG PET-CT
(162 patients). The model’s performance was evaluated by ROC analysis. The AUC increased from 0.68 to 0.86 when post-RCT PET data were added to the clinical and pre-RCT PET variable set. The integration of blood and tissue biomarkers appears also useful in pCR prediction after RCT for rectal cancer[66–68].
The ability of functional imaging to predict pCR is affected by the interval between the end of RCT, the post-treatment scan and surgery. In most studies, post-treatment 18F-FDG PET/CT and
DWI scans were performed 4–8 weeks after the end of RCT. A longer time interval between the end of RCT and surgery has shown to increase pCR rates[69,70]. However, Perez et al. reported that not all patients benefit from this prolonged interval [65]. Fig. 2.Overview of the sensitivity and specificity of DWI and18
F-FDG PET/CT in the prediction of pathological complete response. Solid bars represent DWI-based parameters, while18
F-FDG PET/CT parameters are depicted by hatched bars. Parameters based on pre-RCT imaging and those based on imaging during or after RCT are depicted on the left and the right side respectively. Parameters are represented in the order of decreasing sensitivity in the prediction of pathological complete response.
These authors showed that the increase between early (1 h) and late (3 h) SUVmax at 6-weeks18F-FDG PET/CT scans was a
signifi-cant predictor of poor response. Patients who have such an increase in SUVmax do not benefit from a longer time interval between RCT and surgery. It is known that the interpretation of functional imaging scans during and early after the end of RCT can be confounded by treatment-induced tissue alterations. This is especially the case for18F-FDG PET/CT in which RCT-induced
inflammation can cause FDG-uptake.
A number of limitations of this analysis must be recognized. Most papers report on a limited number of patients, yielding large 95% confidence intervals around the diagnostic accuracy parame-ters, thereby providing cutoff thresholds that are not sufficiently robust for clinical use. Few papers provided enough data to con-struct individual 22 contingency tables. However, by pooling individual patient data, we were able to evaluate the performance of DWI and18F-FDG PET/CT in a larger patient group. Because of
the heterogeneity within the included studies with respect to patient selection, neoadjuvant treatment and imaging protocols and analyses, this pooled analysis should be regarded as an indica-tor of the general performance of DWI and18F-FDG PET/CT in the
prediction of pCR. Furthermore, the results on functional imaging prediction are restricted to monocentric studies conducted in ultra-specialized centers. Validation and implementation in a multicenter setting are still awaited. Standardization through pro-tocols for both image acquisition and data analysis is necessary to ensure reproducibility of the results and enable widespread implementation.
In conclusion, data on the role of18F-FDG PET/CT and DWI in response prediction before, during and after RCT for locally advanced rectal cancer are emerging. In general, a low pretreat-ment ADC, an increase in ADC and decrease in SUV are associated with better response to RCT. Pooled analysis shows qualitative DWI assessment 5–10 weeks after the end of RCT outperforms ADC-based DWI-parameters. Although little data are available, early changes in FDG-uptake seem promising and the role of
18F-FDG PET/CT during RCT should be further investigated.
Multi-center studies using large patient populations are needed to vali-date the role of functional imaging in order to identify those patients who may benefit from a less aggressive therapeutic approach after RCT. Up to now, DWI and18F-FDG PET/CT are not
accurate enough to safely select patients for organ preservation. Future research must focus on the integration of functional imaging with clinical data and molecular biomarkers.
Conflict of interest
None declared.
Appendix A. Supplementary data
Supplementary data associated with this article can be found, in the online version, at http://dx.doi.org/10.1016/j.radonc.2014.11. 026.
References
[1]Sauer R, Becker H, Hohenberger W, et al. Preoperative versus postoperative chemoradiotherapy for rectal cancer. N Engl J Med 2004;351:1731–40. [2]Bosset JF, Collette L, Calais G, et al. Chemotherapy with preoperative
radiotherapy in rectal cancer. N Engl J Med 2006;355:1114–23.
[3]MacFarlane JK, Ryall RD, Heald RJ. Mesorectal excision for rectal cancer. Lancet 1993;341:457–60.
[4]Maas M, Nelemans PJ, Valentini V, et al. Long-term outcome in patients with a pathological complete response after chemoradiation for rectal cancer: a pooled analysis of individual patient data. Lancet Oncol 2010;11:835–44.
[5]Valentini V, Coco C, Picciocchi A, et al. Does downstaging predict improved outcome after preoperative chemoradiation for extraperitoneal locally advanced rectal cancer? A long-term analysis of 165 patients. Int J Radiat Oncol Biol Phys 2002;53:664–74.
[6]Vecchio FM, Valentini V, Minsky BD, et al. The relationship of pathologic tumor regression grade (TRG) and outcomes after preoperative therapy in rectal cancer. Int J Radiat Oncol Biol Phys 2005;62:752–60.
[7]Habr-Gama A, Perez, Nadalin W. Operative versus nonoperative treatment for stage 0 distal rectal cancer following chemoradiation therapy: long-term results. Ann Surg 2004:711–7. discussion 717-8.
[8]Maas M, Beets-Tan RG, Lambregts DM, et al. Wait-and-see policy for clinical complete responders after chemoradiation for rectal cancer. J Clin Oncol 2011;29:4633–40.
[9]Dalton RS, Velineni R, Osborne ME, et al. A single-centre experience of chemoradiotherapy for rectal cancer: is there potential for nonoperative management? Colorectal Dis 2012;14:567–71.
[10]Peeters KC, van de Velde CJ, Leer JW, et al. Late side effects of short-course preoperative radiotherapy combined with total mesorectal excision for rectal cancer: increased bowel dysfunction in irradiated patients–a Dutch colorectal cancer group study. J Clin Oncol 2005;23:6199–206.
[11]Remzi FH, Fazio VW, Gorgun E, et al. Quality of life, functional outcome, and complications of coloplasty pouch after low anterior resection. Dis Colon Rectum 2005;48:735–43.
[12]Sartori CA, Sartori A, Vigna S, Occhipinti R, Baiocchi GL. Urinary and sexual disorders after laparoscopic TME for rectal cancer in males. J Gastrointest Surg 2011;15:637–43.
[13]Zhao RS, Wang H, Zhou ZY, Zhou Q, Mulholland MW. Restaging of locally advanced rectal cancer with magnetic resonance imaging and endoluminal ultrasound after preoperative chemoradiotherapy: a systemic review and meta-analysis. Dis Colon Rectum 2014;57:388–95.
[14]Hanly AM, Ryan EM, Rogers AC, et al. Multicenter Evaluation of Rectal cancer ReImaging pOst Neoadjuvant (MERRION) Therapy. Ann Surg 2014;259:723–7. [15]Huh JW, Park YA, Jung EJ, Lee KY, Sohn SK. Accuracy of endorectal ultrasonography and computed tomography for restaging rectal cancer after preoperative chemoradiation. J Am Coll Surg 2008;207:7–12.
[16]Lee JH, Jang HS, Kim JG. Prediction of pathologic staging with magnetic resonance imaging after preoperative chemoradiotherapy in rectal cancer: pooled analysis of KROG 10-01 and 11-02. Radiother Oncol 2014;113: 18–23.
[17]Patterson DM, Padhani AR, Collins DJ. Technology insight: water diffusion MRI – a potential new biomarker of response to cancer therapy. Nat Clin Pract Oncol 2008;5:220–33.
[18]Koh DM, Collins DJ. Diffusion-weighted MRI in the body: applications and challenges in oncology. AJR Am J Roentgenol 2007;188:1622–35.
[19]Seierstad T, Røe K, Olsen DR. Noninvasive monitoring of radiation-induced treatment response using proton magnetic resonance spectroscopy and diffusion-weighted magnetic resonance imaging in a colorectal tumor model. Radiother Oncol 2007;85:187–94.
[20]Schelling M, Avril N, Nährig J, et al. Positron emission tomography using [(18)F]Fluorodeoxyglucose for monitoring primary chemotherapy in breast cancer. J Clin Oncol 2000;18:1689–95.
[21]Wieder HA, Brücher BL, Zimmermann F, et al. Time course of tumor metabolic activity during chemoradiotherapy of esophageal squamous cell carcinoma and response to treatment. J Clin Oncol 2004;22:900–8.
[22]Bokemeyer C, Kollmannsberger C, Oechsle K, et al. Early prediction of treatment response to high-dose salvage chemotherapy in patients with relapsed germ cell cancer using [(18)F]FDG PET. Br J Cancer 2002;86: 506–11. [23]Macbeth F, Overgaard J. Expert reviews, systematic reviews and
meta-analyses. Radiother Oncol 2002;64:233–4.
[24]Whiting P, Rutjes AW, Reitsma JB, Bossuyt PM, Kleijnen J. The development of QUADAS: a tool for the quality assessment of studies of diagnostic accuracy included in systematic reviews. BMC Med Res Methodol 2003;3:25. [25]Lambrecht M, Vandecaveye V, De Keyzer F, et al. Value of diffusion-weighted
magnetic resonance imaging for prediction and early assessment of response to neoadjuvant radiochemotherapy in rectal cancer: preliminary results. Int J Radiat Oncol Biol Phys 2012;82:863–70.
[26]Lambrecht M, Deroose C, Roels S, et al. The use of FDG-PET/CT and diffusion-weighted magnetic resonance imaging for response prediction before, during and after preoperative chemoradiotherapy for rectal cancer. Acta Oncol 2010;49:956–63.
[27]Intven M, Reerink O, Philippens ME. Diffusion-weighted MRI in locally advanced rectal cancer: pathological response prediction after neo-adjuvant radiochemotherapy. Strahlenther Onkol 2013;189:117–22.
[28]Kim SH, Lee JY, Lee JM, Han JK, Choi BI. Apparent diffusion coefficient for evaluating tumour response to neoadjuvant chemoradiation therapy for locally advanced rectal cancer. Eur Radiol 2011;21:987–95.
[29]Curvo-Semedo L, Lambregts DM, Maas M, et al. Rectal cancer: assessment of complete response to preoperative combined radiation therapy with chemotherapy–conventional MR volumetry versus diffusion-weighted MR imaging. Radiology 2011;260:734–43.
[30]Engin G, Sharifov R, Güral Z, et al. Can diffusion-weighted MRI determine complete responders after neoadjuvant chemoradiation for locally advanced rectal cancer? Diagn Interv Radiol 2012;18:574–81.
[31]Lee EM, Hong YS, Kim KP, et al. Phase II study of preoperative chemoradiation with S-1 plus oxaliplatin in patients with locally advanced rectal cancer. Cancer Sci 2013;104:111–5.
[32]Genovesi D, Filippone A, Ausili Cèfare G. Diffusion-weighted magnetic resonance for prediction of response after neoadjuvant chemoradiation therapy for locally advanced rectal cancer: preliminary results of a monoinstitutional prospective study. Eur J Surg Oncol 2013;39:1071–8. [33]Ha HI, Kim AY, Yu CS, Park SH, Ha HK. Locally advanced rectal cancer:
diffusion-weighted MR tumour volumetry and the apparent diffusion coefficient for evaluating complete remission after preoperative chemoradiation therapy. Eur Radiol 2013;23:3345–53.
[34]Lambregts DM, Rao SX, Sassen S. MRI and diffusion-weighted MRI volumetry for identification of complete tumor responders after preoperative chemoradiotherapy in patients with rectal cancer: a bi-institutional validation study. Ann Surg 2014 Sep 10.
[35]Kim SH, Lee JM, Hong SH, et al. Locally advanced rectal cancer: added value of diffusion-weighted MR imaging in the evaluation of tumor response to neoadjuvant chemo- and radiation therapy. Radiology 2009;253:116–25. [36]Song I, Kim SH, Lee SJ, Choi JY, Kim MJ, Rhim H. Value of diffusion-weighted
imaging in the detection of viable tumour after neoadjuvant chemoradiation therapy in patients with locally advanced rectal cancer: comparison with T2 weighted and PET/CT imaging. Br J Radiol 2012;85:577–86.
[37]Lambregts DM, Vandecaveye V, Barbaro B, et al. Diffusion-weighted MRI for selection of complete responders after chemoradiation for locally advanced rectal cancer: a multicenter study. Ann Surg Oncol 2011;18:2224–31. [38]Sassen S, de Booij M, Sosef M, et al. Locally advanced rectal cancer: is diffusion
weighted MRI helpful for the identification of complete responders (ypT0N0) after neoadjuvant chemoradiation therapy? Eur Radiol 2013;23:3440–9. [39]Perez RO, Habr-Gama A, São Julião GP. Predicting complete response to
neoadjuvant CRT for distal rectal cancer using sequential PET/CT imaging. Tech Coloproctol 2014;18:699–708.
[40]Konski A, Li T, Sigurdson E, et al. Use of molecular imaging to predict clinical outcome in patients with rectal cancer after preoperative chemotherapy and radiation. Int J Radiat Oncol Biol Phys 2009;74:55–9.
[41]Capirci C, Rubello D, Pasini F, et al. The role of dual-time combined 18-fluorodeoxyglucose positron emission tomography and computed tomography in the staging and restaging workup of locally advanced rectal cancer, treated with preoperative chemoradiation therapy and radical surgery. Int J Radiat Oncol Biol Phys 2009;74:1461–9.
[42]Palma P, Conde-Muíño R, Rodríguez-Fernández A, et al. The value of metabolic imaging to predict tumour response after chemoradiation in locally advanced rectal cancer. Radiat Oncol 2010;5:119.
[43]Martoni AA, Di Fabio F, Pinto C, et al. Prospective study on the FDG-PET/CT predictive and prognostic values in patients treated with neoadjuvant chemoradiation therapy and radical surgery for locally advanced rectal cancer. Ann Oncol 2011;22:650–6.
[44]Hur H, Kim NK, Yun M, et al. 18Fluoro-deoxy-glucose positron emission tomography in assessing tumor response to preoperative chemoradiation therapy for locally advanced rectal cancer. J Surg Oncol 2011;103:17–24. [45]Shanmugan S, Arrongoiz R, Nitzorkski JR, et al. Predicting pathological
response to neoadjuvant chemoradiotherapy in locally advanced rectal cancer using 18FDG-PET/CT. Ann Surg Oncol 2012;19:2178–85.
[46]Goldberg N, Kundel Y, Purim O, et al. Early prediction of histopathological response of rectal tumors after one week of preoperative radiochemotherapy using18
F-FDG PET-CT imaging. A prospective clinical study. Radiat Oncol 2012;7:124.
[47]Guillem JG, Ruby JA, Leibold T, et al. Neither FDG-PET Nor CT can distinguish between a pathological complete response and an incomplete response after neoadjuvant chemoradiation in locally advanced rectal cancer: a prospective study. Ann Surg 2013;258:289–95.
[48]Kim JW, Kim HC, Park JW, et al. Predictive value of (18)FDG PET-CT for tumour response in patients with locally advanced rectal cancer treated by preoperative chemoradiotherapy. Int J Colorectal Dis 2013;28:1217–24. [49]Lee SJ, Kim JG, Lee SW, et al. Clinical implications of initial FDG-PET/CT in
locally advanced rectal cancer treated with neoadjuvant chemoradiotherapy. Cancer Chemother Pharmacol 2013;71:1201–7.
[50]Bampo C, Alessi A, Fantini S, et al. Is the standardized uptake value of FDG-PET/ CT predictive of pathological complete response in locally advanced rectal cancer treated with capecitabine-based neoadjuvant chemoradiation? Oncology 2013;84:191–9.
[51]van Stiphout RG, Lammering G, Buijsen J, et al. Development and external validation of a predictive model for pathological complete response of rectal cancer patients including sequential PET-CT imaging. Radiother Oncol 2011;98:126–33.
[52]Sun W, Xu J, Hu W, Zhang Z, Shen W. The role of sequential 18(F)-FDG PET/CT in predicting tumour response after preoperative chemoradiation for rectal cancer. Colorectal Dis 2013;15:e231–8.
[53]Huh JW, Kwon SY, Lee JH, Kim HR. Comparison of restaging accuracy of repeat FDG-PET/CT with pelvic MRI after preoperative chemoradiation in patients with rectal cancer. J Cancer Res Clin Oncol 2014 Sep 3. Epub ahead of print. [54]Capirci C, Rubello D, Chierchetti F, et al. Restaging after neoadjuvant
chemoradiotherapy for rectal adenocarcinoma: role of F18-FDG PET. Biomed Pharmacother 2004;58:451–7.
[55]Kalff V, Duong C, Drummond EG, Matthews JP, Hicks RJ. Findings on 18F-FDG PET scans after neoadjuvant chemoradiation provides prognostic stratification in patients with locally advanced rectal carcinoma subsequently treated by radical surgery. J Nucl Med 2006;47:14–22.
[56]Vliegen RF, Beets-Tan RG, Vanhauten B, et al. Can an FDG-PET/CT predict tumor clearance of the mesorectal fascia after preoperative chemoradiation of locally advanced rectal cancer? Strahlenther Onkol 2008;184:457–64. [57]Kristiansen C, Loft A, Berthelsen AK, et al. PET/CT and histopathologic response
to preoperative chemoradiation therapy in locally advanced rectal cancer. Dis Colon Rectum 2008;51:21–5.
[58]Kalff V, Ware R, Heriot A, Chao M, Drummond E, Hicks RJ. Radiation changes do not interfere with postchemoradiation restaging of patients with rectal cancer by FDG PET/CT before curative surgical therapy. Int J Radiat Oncol Biol Phys 2009;74:60–6.
[59]Cho YB, Chun HK, Kim MJ, et al. Accuracy of MRI and18
F-FDG PET/CT for restaging after preoperative concurrent chemoradiotherapy for rectal cancer. World J Surg 2009;33:2688–94.
[60] Mak D, Joon DL, Chao M, et al. The use of PET in assessing tumor response after neoadjuvant chemoradiation for rectal cancer. Radiother Oncol 2010;97:205–11.
[61]Murcia Duréndez MJ, Frutos Esteban L, Luján J. The value of18
F-FDG PET/CT for assessing the response to neoadjuvant therapy in locally advanced rectal cancer. Eur J Nucl Med Mol Imaging 2013;40:91–7.
[62]Burbach JP, den Harder AM, Intven M, van Vulpen M, Verkooijen HM, Reerink O. Impact of radiotherapy boost on pathological complete response in patients with locally advanced rectal cancer: A systematic review and meta-analysis. Radiother Oncol 2014;113:1–9.
[63]Mardor Y, Roth Y, Ochershvilli A, et al. Pretreatment prediction of brain tumors’ response to radiation therapy using highb-value diffusion-weighted MRI. Neoplasia 2004;6:136–42.
[64]Koh DM, Scurr E, Collins D, et al. Predicting response of colorectal hepatic metastasis: value of pretreatment apparent diffusion coefficients. AJR Am J Roentgenol 2007;188:1001–8.
[65]Harrison L, Blackwell K. Hypoxia and anemia: factors in decreased sensitivity to radiation therapy and chemotherapy? Oncologist 2004;9:31–40. [66]Buijsen J, van Stiphout RG, Menheere PP, Lammering G, Lambin P. Blood
biomarkers are helpful in the prediction of response to chemoradiation in rectal cancer: a prospective, hypothesis driven study on patients with locally advanced rectal cancer. Radiother Oncol 2014;111:237–42.
[67]Hur H, Kim NK, Min BS. Can a biomarker-based scoring system predict pathologic complete response after preoperative chemoradiotherapy for rectal cancer? Dis Colon Rectum 2014;57:592–601.
[68]Edden Y, Wexner SD, Berho M. The use of molecular markers as a method to predict the response to neoadjuvant therapy for advanced stage rectal adenocarcinoma. Colorectal Dis 2012;14:555–61.
[69]Tulchinsky H, Shmueli E, Figer A, Klausner JM, Rabau M. An interval >7 weeks between neoadjuvant therapy and surgery improves pathologic complete response and disease-free survival in patients with locally advanced rectal cancer. Ann Surg Oncol 2008;15:2661–7.
[70] Wolthuis AM, Penninckx F, Haustermans K, et al. Impact of interval between neoadjuvant chemoradiotherapy and TME for locally advanced rectal cancer on pathologic response and oncologic outcome. Ann Surg Oncol 2012;19:2833–41.