D
ISSERTATION
submitted to the
Combined Faculties for the Natural Sciences
and for Mathematics
of the Ruperto-Carola University of Heidelberg, Germany
for the degree of
Doctor of Natural Sciences
Put forward by
M.Sc. Luca Fiaschi
born in Prato (Italy)
Oral examination: 20.11.2013
Learning Based Biological Image Analysis
Luca Fiaschi05.09.2013
Referees: Prof. Dr. Fred A. Hamprecht
Prof. Dr. Ulrich Schwarz
License. To view a copy of this license, visit http://creativecommons.
org/licenses/by/3.0/.
The work associated with this thesis has been carried out under the auspices of Prof. Dr. Fred A. Hamprecht at the Heidelberg Collaboratory for Image Processing (HCI) between October 2010 and October 2013.
Acknowledgements
If I had to pay back with real money to all people which supported me writing this Ph.D. thesis, I would be a big bankrupt. This section can just try to name some of them, unfortunately omitting the many others who have been also important in the past three years.
First of all I would like to thank Prof. Dr. Fred A. Hamprecht for his supervision. His support went far over being just a scientific father - he even tried to bribe me to make me quit smoking. He did not succeed in that, but his criticism and example made me became a much better scientist in the meanwhile.
In these three years I was fortunate to work together with Dr. Xinghua Lou. He is the mastermind and the main author of my first project - the quality control. More than this, the entire research developed in this thesis is much inspired to his work and to the enlightening discussions we had together.
For almost two years I had the honour to share my office with Dr. Ferran Diego. If I had any scientific or personal question he would just be there with the ready answer. Foremost, I thank him for his humanity and for travelling with me across the US. We had a wild time together.
I thank Dr. Bernhard X. Kausler for being just Bernhard, one of the smartest persons I ever met. He would not easily let you fit in any category but question your assumptions and spur you to be original. We travelled together Israel and Jordan and it was a very great time. He also translated the abstract of this thesis to German.
I thank Christoph Strähle and Swen Wanner for all the discussions we had in front of good German beer. During these moments, we used to speculate really fantastic algorithms that will revolutionize computer science. Yet, the morning after we would usually forgot what we talked about and go to work with a big headache. I also still owe them a lot money in rolling tobacco.
I thank Dr. Ullrich Köthe for teaching me all I know of C++ and for the clever discussion on the drafts of the articles. He has often been a living encyclopedia for any kind of subject.
I thank Dr. Anna Kreshuk for her patience sitting and debugging together. She first introduced me to the world of Python. I also thank her for all the wise advices she gave me and for checking my bad English spelling of most of the talks I gave.
I thank Thorben Kröger for his friendship and his clever and witty observations. He also was my first reference in any problem of GUI programming and 3D graphics.
I thank Konstantin Gregor for being the best student assistant I could hope for. His talent and passion made the working hours lighter and more fun. He also courageously took on his shoulders the big effort of annotating the datasets used in the experiments.
Along with those already mentioned, I would like to thank all the other out-standing people that I met in my group: Buote Xu, Svenja Reith, Gregor Urban, Martin Lindner, Joachim Schleicher, Robert Walecki, Philipp Hanslovsky, Kemal Eren, Oliver Petra, Rahul Nair, Dr. Christoph Sommer, Martin Schiegg, Dr. Chong Zhang and Dr. Melih Kandemir. I especially thank Dr. Björn Andres and Thorsten Beier for introducing me to the PUA world and for the discussions about proba-bilistic graphical models. In addition, I would like to thank Barbara Werner and Evelyn Wilhelm for their support with the German language and with the University administration. I will eventually miss all these people together with the Tuesday mornings of Journal-Club.
During the last three years I had the great opportunity to collaborate with some outstanding life scientists. I am very grateful to Dr. Marta Zlatic and Dr. Bruno Afonso for introducing me to the challenging problem of tracking Drosophila larvae. It has been especially fun to work with those little white guys. I am sure, they will keep showing up in my dreams (or nightmares) for a long time. I thank Dr. Jurgen Raymann for providing the dataset used in the first chapter experiments and I also thank Dr. Ana-Martin Villalba for supporting my Ph.D student application.
I thank the Heidelberg Graduate School of Mathematical and Computational Methods for the Sciences (HGS) for three years of financial support. I would like to mention especially Dr. Michael Winckler and Oktavia Klassen for their administra-tive support.
I thank Darya Trofimova for offering me her friendship. It was really a pleasure to travel to conferences together. She took a great effort in correcting all the many spelling mistakes in the first draft of this thesis. Moreover, I thank my girlfriend Benedetta Regonesi, who made even greater effort in bearing me all these years. I always want her to read trough my work to make sure that what I wrote does make a bit of sense.
Finally, I would like to thank my family: Patrizia Baroncelli, Martina Fiaschi and Andrea Fiaschi for their loving support.
iii
Sources and Figures
The material presented in this work draws on the research conducted by the author of this thesis and his collaborators. In particular, the material presented in Chapter 2
is published inLou et al.(2012) which is co-authored by the author of this thesis.
Dr. Xinghua Lou carried out the principal experiments which are presented in that chapter and is the main author of the article manuscript. The author of this thesis contributed with the prototyping of the algorithm and prepared the gold standard for the evaluation. Dr. Ullrich Köthe and Prof. Dr. Fred A. Hamprecht contributed with intellectual input and corrections on the manuscript. A third-party figure is
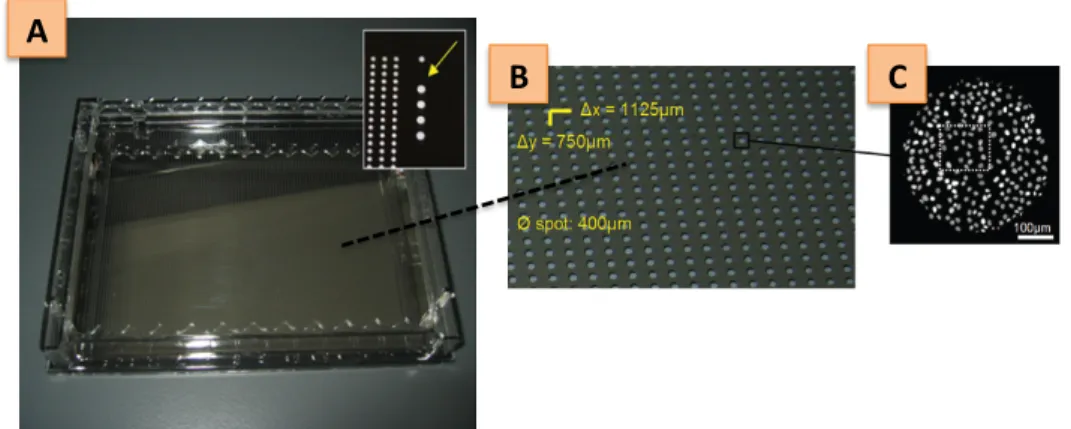
used in that Chapter: Fig. 2.6Reymann et al.(2009). Dr. Jurgen Reymann provided
the dataset presented in the experiments of Chapter 2.
A part of the research material presented in the following chapters is published inFiaschi et al.(2012, 2013). The author of this thesis wrote the principal code and conducted the principal experiments presented in those articles, with the input and the support from the all other authors of the manuscripts.
Zusammenfassung
Die aktuelle Forschung in Biologie und Medizin ist stark von den Fortschritten in der Entwicklung rechnergestützter Methoden abhängig. Die Explosion der Datenmenge in der Mikroskopie und das wachsende Interesse von Lebenswisschenschaftlern an immer komplexeren und subtileren Wechselwirkungen regen die Suche nach innova-tiven, rechnergestützten Lösungen für herausfordernde und praxisnahe Anwendun-gen an. ErweiterunAnwendun-gen und NeuformulierunAnwendun-gen Anwendun-generischer und flexibler Methoden basierend auf Lernverfahren bzw. probabilistischer Inferenz sind notwendig um die großen Vielfalt an produzierten Daten handhaben zu können und um ein ständiges Reimplementieren und ausuferndes Parameter-Tuning zu vermeiden. Diese Arbeit nutzt neueste Methoden des maschinellen Lernens basierend auf strukturierten prob-abilistischen Modellen und schwach-überwachtem Lernen um vier neue Ansätze in den Bereichen der Mikroskopie-Bildgebung und dem Multiple-Object Tracking zu präsentieren.
Kapitel 2 führt ein Framework für schwach-überwachtes Lernen ein um das Problem der Defektdetektion in Bildern aus großen Mikroskopie-Datenbanken zu lösen. Die vorliegende Arbeit demonstriert dabei genaue Vorhersagen mit nur geringem Annotationsaufwand von Seiten der Nutzer. Kapitel 3 präsentiert einen auf lokalen strukturierten Prädiktoren basierenden Lernansatz um in Bildern über-lappende Objekte zu zählen. Dieses Problem findet vielfältige Anwendung in der Hochdurchsatz-Mikroskopie wie z.B. das Zählen von Zellen in der Toxizitätsanal-yse von Medikamenten. Kapitel 4 entwickelt ein deterministisches graphisches Modell um zeitliche Konsistenz beim Zählen von Objekten in Videosequenzen zu erzwingen. Dieses Kapitel zeigt dass globale (zeitliche und räumliche) strukturierte Inferenz konsistent besser ist als lokale (ausschließlich räumliche) Vorhersagen. Die in Kapitel 4 entwickelte Methode wird in einem neuartigen Tracking Algorith-mus verwendet, der in Kapitel 5 eingeführt wird. Dieses Kapitel nimmt sich—zum ersten Mal in der Literatur—dem schwierigen Problem an, überlappende, licht-durchlässige und ununterscheidbare Objekte zu tracken. Die Behandlung von sich gegenseitig verdeckenden Objekten ist als ein neuartiges strukturiertes Inferen-zproblem basierend auf der Mimimierung einer konvexen Multi-Commodity Flow Energie formuliert. Die optimalen Gewichte der Energieterme werden unter par-tieller Anleitung durch den Anwender mit Hilfe von latenten Variablen gelernt. Zur Unterstützung von Verhaltensbiologen wenden wir die Methoden auf das Problem an eine Ansammlung von interagierenden Drosophila Larven zu tracken.
Abstract
The fate of contemporary scientific research in biology and medicine is bound to
the advancements in computational methods. The unprecedenteddata explosion
in microscopy and the crescent interest of life scientists in studying more complex and more subtle interactions stimulate the research for innovative computational solutions on challenging real world applications. Extensions and novel formulations
of generic and flexible methods based onlearning/inferenceare necessary to cope
with the large variety of the produced data and to avoid continuous reimplementation and heavy parameter tuning. This thesis exploits cutting edge machine learning methods based on structured probabilistic models and weakly supervised learning
to provide four novel solutions in the areas oflarge-scale microscopic imaging
andmultiple objects tracking.
Chapter 2 introduces a weakly supervised learning framework to tackle the problem of detecting defect images while mining massive microscopic imagery databases. This thesis demonstrates accurate prediction with low user annotation effort. Chapter 3 presents a learning approach for counting overlapping objects in images based on local structured predictors. This problem has numerous appli-cations in high throughput microscopy screening such as cells counting for drug toxicity assays. Chapter 4 develops a deterministic graphical model to impose temporal consistency in objects counts when dealing with a video sequence. This Chapter shows that global (temporal and spatial) structural inference consistently improves over local (only spatial) predictions. The method developed in Chapter 4 is used in a novel downstream tracking algorithm which is introduced in Chapter 5. This Chapter tackles, for the first time, the difficult problem of tracking heavily overlapping, translucent and indistinguishable objects. The mutual occlusion event handling of such objects is formulated as a novel structured inference problem based on the minimization of a convex multi-commodity flow energy. The optimal weights of the energy terms are learned with partial user supervision using structured learning with latent variables.To support behavioral biologists, we apply this method to the problem of tracking a community of interacting Drosophila larvae.
Contents
Acknowledgements i
Zusammenfassung v
Abstract vii
1 Introduction 1
1.1 On the challenges and opportunities
of biological image analysis . . . 2
1.2 Recent developments in computational methods . . . 5
1.2.1 Machine learning . . . 6
1.2.2 Computer Vision . . . 7
1.2.3 Optimization . . . 9
1.3 Thesis overview . . . 10
2 Quality Control of Microscopy Images 13 2.1 Related work and contributions . . . 14
2.2 Defects in Microscopic Images: Global vs. Regional . . . 16
2.3 Classification by One-Class SVM Cascade . . . 16
2.3.1 One-class SVM . . . 18
2.3.2 Global Out-of-Focus Detection by Histogram Comparison 19 2.3.3 Regional Defect Detection from Patch Statistics . . . 20
2.4 Experiments . . . 22
2.4.1 Implementation details . . . 23
2.4.2 Results . . . 23
2.5 Discussion . . . 26
3 Learning to Count 29 3.1 Related work and contributions . . . 30
3.2 Predicting a structured regression target . . . 31
3.2.1 Regression Forest using Structured Labels . . . 32
3.2.2 Uncertainty of a Prediction . . . 36 ix
3.3 Model limitations . . . 38
3.4 Experiments . . . 39
3.4.1 Bacterial cells microscopy images . . . 39
3.4.2 Pedestrians in surveillance video . . . 41
3.4.3 Implementation details . . . 41
3.5 Discussion . . . 42
4 Keeping count 45 4.1 Related work and contributions . . . 46
4.2 Methods . . . 49
4.2.1 Model definition . . . 49
4.2.2 Integer linear program formulation . . . 52
4.2.3 Unary potentials . . . 52
4.3 Experimental results . . . 53
4.3.1 Data and preprocessing . . . 53
4.3.2 Training unary potentials . . . 53
4.3.3 Implementation details . . . 54
4.3.4 Results . . . 55
4.3.5 Remaining error sources . . . 56
4.4 Discussion . . . 57
5 Learning to disambiguate 61 5.1 Introduction and contributions . . . 63
5.2 Related Work . . . 65
5.3 Problem Formulation and Modeling . . . 67
5.3.1 Precise formulation . . . 67
5.3.2 Inference: identity interpretation . . . 70
5.3.3 Parameter learning from partial annotations . . . 71
5.3.4 Features . . . 72
5.4 Experiments . . . 73
5.4.1 Dataset and evaluation metric . . . 73
5.4.2 Implementation and experimental details . . . 74
5.4.3 Results . . . 74
5.5 Discussion . . . 75
6 Conclusion 81 6.1 Conclusions and main contributions . . . 81
Chapter 1
Introduction
Microscopy has deeply contributed to important scientific discoveries in many disciplines and foremost in biology. Yet it is arguable that until recent years this
technique has been mostly exploited to providequalitativesupport to other
experi-mental methods. Nowadays, we observe a large increase in the variety and quality of automatic microscopes some of which are able to produce huge datasets at extremely high resolutions. Modern microscopy opens the unprecedented opportunity to
ex-tract large-scalequantitativeinformation by mining massive databases of images.
Indeed, the collection and analysis of huge datasets is the general trend of most
contemporary scientific research. Thisflow of datahas given to some authors the
feeling of facing a turning point of the scientific paradigm: from model/simulation
based science towards data driven research (i.e. the fourth paradigm,Hey et al.
(2009)). The impact of computational techniques has been pointed out as the driving
force of this revolution (cf.Myers(2012);Swedlow et al.(2009);Peng(2008) for
a discussion of image analysis in biology). As the opportunity for advanced data analysis is fastly increasing so are doing the expectations for more sophisticated algorithms. Indeed, data analysis and in particular image analysis often represents the bottleneck of ambitious research projects. Extracting quantitative information from biological images poses several challenges such as those of dealing with low signal to noise ratio, high data throughput and task sophistication. Behind these difficulties we should however not forget the opportunities: on the one hand to push forward the frontier of computational scientific methods, on the other hand, to open the door to important discoveries in life sciences. Honestly, the future could not look more exciting!
In the first part of this chapter we discuss in greater detail the challenges and the opportunities offered by biological image analysis. These opportunities motivate the focus of the work presented in this thesis - learning based methods for biological image analysis. Then, we review the trends in computational methods which are influential for our work. Finally, we present the structure of this thesis and overview the contributions introduced by this work.
1.1
On the challenges and opportunities
of biological image analysis
The overwhelming challenge that needs to be addressed when studying living
systems isstructural complexity (Adami, 2002). This type of complexity eludes
a precise mathematical formalization but it is easy to appreciate when looking at living organisms. Cells appear as rich chemical environments with a high level of spatial organization. Neurons exchange electrical and chemical signals in highly interconnected networks that end up defining actions for the entire organism. Even more surprisingly, patterns of collective behaviors, such as social interactions,
emerge from the actions of individual animals (Sumpter, 2006).
Capturing the patterns in living systems requires a broad view over the spatial organization and the biophysical composition of complex systems at multiple scales: from nano to macro. Such a landscape exceeds the scope of single experiments and must be addressed by multiple experimental techniques. Ambitious goals can only be reached by large scale scientific projects that automatically extract data from several experimental methods and correlate the information of all sources. An
example is theFly-Olympiad Project1(Branson et al., 2009;Simon and Dickinson,
2010) that aims elucidating the genetic and physiological basis ofDrosophila’s
behavior by integrating light microscopy (Fly-Light), electron microscopy (Fly-EM), genetic screenings and behavioral essays in a single massive database. Another
example is theOpen-Connectome Project2that coordinates a huge dataset of neuron
images acquired from the nano scale (using electron microscopy) to the macro scale (using magnetic resonance imaging).
Computational science, and in particularbioimage informatics(i.e. the
process-ing and analysis of images acquired with microscopesPeng(2008)), appears to be a
central element in such large scientific projects. This is due to two main
require-ments that need to be fulfilled to support large scale biological science:automation
andrepeatability.
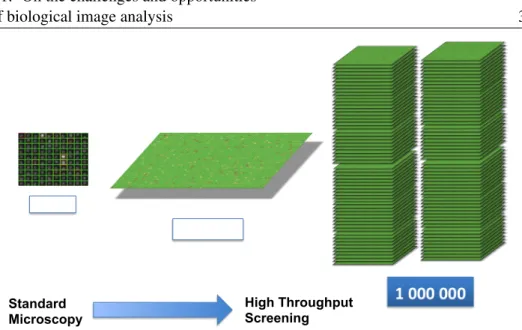
Automation is needed in order to address the size of the data generated with the newer microscopes. For example, as illustrated in Fig. 1.1, a modern high
throughput microscope can produce106images in a single experiment, compared
to the few hundred images produced by a traditional light microscope. Even more surprisingly, by using electron microscopy the imaging of a single Drosophila brain
will produce a dataset of 150 terabytes, as estimated inMyers(2012). In addition,
a substantial contribution to the increased throughput comes from techniques that produce multiple huge volumetric images, such as time resolved imaging (e.g. light
sheet microscopy Keller et al. (2008)) or multiple channel imaging (e.g. array
tomographyMicheva and Smith(2007) and “clarity”Chung et al.(2013)). Yet, it
is important to notice that thetypeof data that is produced is often out of scope
for direct human analysis. For example, extracting useful information from mass 1http://www.janelia.org/team-project/fly-olympiad
1.1. On the challenges and opportunities
of biological image analysis 3
100 10 000 Standard Microscopy High Throughput Screening
Figure 1.1: Illustration of the difference in data throughput between a traditional light microscope and an high-throughput microscope. In the figure, each colored square contains the image of a well plate. On the left, a traditional microscope can produce hundreds images of well plates per batch. In this regime,
out-of-focus images (yellow) or images containing regional defects (red), such as debris
contamination, are usually manually discarded. On the right, high throughput
microscopy produces batches of104−106images. Manual mining of defect images
becomes impractical. An automated method for quality control of a large imagery database is presented in Chapter 2.
spectrometry imaging requires the inspection of hundreds of channels, whose effect cannot be even “visualized” without algorithmic pre-processing to reduce dimensionality (e.g. principal components analysis).
A second argument in favor of computational approaches is repeatability. Given the same input parameters and the same input data, an algorithm reproduces the same results (valid also for randomized algorithms provided the same seed as
parameter). On the contrary, according toDanuser(2011), humans are subject to
poor repeatability and are biased to overlook rare events. Even though committees of human experts are required to set the gold standard that is necessary to assess the algorithm performance, a single human expert can be outperformed in some tasks by
algorithms. As argued inDanuser(2011), this can happen when the analysis requires
the consideration of a large number of possible alternative solutions in a well-defined multidimensional space. For example this has been observed in protein location classification (Murphy et al., 2003) or multiple particle tracking (Matov et al., 2010). In the first case the algorithm performed better in the classification of visually subtle differences in location, as it could take advantage of a high dimensional feature space. In the second case humans were found to underestimate systematically fast movement events. In theory, an algorithm which performs tracking could take
into account the position of all the particles in the sequence in order to establish a joint optimal assignment (this is limited by computational complexity as
multiple-hypothesis-trackingReid(1979) is an NP-hard combinatorial problem). In contrast,
humans typically need to scroll back and forth through a sequence and inspect only a a limited number of particles at time.
Because large scale scientific projects have ambitious goals, the computational tasks that need to be addressed have become more and more challenging. Early bioimage informatics would deal mostly with image processing tasks, such as color enhancement, noise reduction, deconvolution and registration. These techniques produce an improvement of the images before further information is extracted. However, in order to deliver accurate quantitative measurements, scientific research demands today sophisticated image analysis solutions that require the extension
of cutting edge methods in computer vision and machine learning (Peng, 2008;
Swedlow et al., 2009). For example,Jain et al.(2010) argue that the attempt to reconstruct the wiring diagram of the neurons in the brain (connectome reconstruc-tion) is hindered by the lack of methods to accurately segment neuronal structures in microscopic images.
When analyzing biological images it is often required to deal with scenarios which are difficult to tackle using image analysis algorithms, such as low signal to noise ratio, low resolution and even ill posed problems. For example a group of objects which needs to be segmented, such as cells, could appear to overlap in the
image and thus prevent the usage of simple techniques such as Otsu threshold (Otsu,
1975). To overcome these difficulties and enable the extraction of quantitative data from images, a careful modeling of the image content in order to take into account prior information about the scene is required. Depending on the task, the prior can be as intuitive as the observation that the objects under analysis do not escape
the planar well plate, as exploited recently byFiaschi et al.(2013) for counting
heavily overlapping Drosophila larvae. Or it can be expressed in probabilistic terms and learned from data. In particular, machine learning techniques offer a powerful
means to exploit prior information when present. For example,Kausler et al.(2012)
propose a robust method for tracking a large number of divisible objects in presence of clutter. This approach integrates many terms which are learned from training data, such as cell appearance and mitosis probability, in a global probabilistic graphical model (PGM).
The evolution of techniques that integrate machine learning and computer vision may allow in the future to address fundamental questions in biology. For example, the tracking of thousands of cells in spatiotemporal volumes is required to elucidate
embryogenesis (Keller et al., 2008). In addition, image analysis may open the door
to new field of studies. For example, the tracking of each individual in a large population of interacting animals is required to gain new insight into collective behavioral patterns. In particular, recent interesting work in this direction has been
presented for adult Drosophila (Branson et al., 2009), mice (Branson and Belongie,
2005) and ants (Mersch et al., 2013;Khan et al., 2006).
1.2. Recent developments in computational methods 5
to the development of open-source software for bioimage informatics (Cardona and
Tomancak, 2012). Indeed, well designed software enables also non image analysis practitioners to take full advantage of powerful computational techniques. It is interesting to note that, besides the large ecosystem of special purpose software, some interesting products have configured themselves as generic bioimaging tools and scientific workflow systems. The main advantage of scientific workflow systems is that generic components can be shared among several workflows without the need to be reimplemented. These components often include machine learning modules that give the flexibility to adapt to different datasets with the change of the training annotations (under similar experimental conditions). Often the implementation provided in these modules has been optimized to offer real time performance. This allows the user to interactively tune and refine the result (human-in-the-loop workflows). These software also often implement a plugin architecture which is continuously extended by active communities of developers.
Among the most used software, CELLPROFILER 3 and CELLCOGNITION4
implement cell segmentation and classification modules that are largely used in cell phenotyping (Carpenter et al., 2006;Held et al., 2010). FIJI5and VAA3D6are used
in the reconstruction and visualization of complex neuronal structures from large
microscopy volumes (Schindelin et al., 2012;Peng et al., 2010). ILASTIK(Sommer
et al., 2011) provides a generic machine learning module for interactive pixelwise classification. It has been successfully applied to cell classification (Sommer et al.,
2012), synapses detection (Kreshuk et al., 2011) and neuron segmentation (Andres
et al., 2012).
1.2
Recent developments in computational methods
In this section we shall review the advanced computational methods that are relevant for this thesis. A precise presentation of the related literature in connection with the novelty proposed in this thesis is found at the beginning of each chapter. Here we describe the most influential recent work with regard to three main areas of computer
science:machine learning,computer visionandoptimization. Nowadays these areas
are strongly connected, most machine learning algorithms are indeed formulated as optimization problems while novel optimization techniques have been developed to address large scale machine learning. In addition, computer vision exploits both machine learning and optimization as fundamental building blocks and in turn motivates interesting research directions in both others fields. As a famous example,
Neural Network (NN) (Rosenblatt, 1958) learning can be formulated as the problem
of optimizing a non-convex energy function. The developments in gradient descent optimization (backpropagation) have made it possible to train Convolutional Neural
3http://www.cellprofiler.org/ 4http://cellcognition.org/ 5http://fiji.sc/Fiji 6http://www.vaa3d.org/
Networks (CNNs) (LeCun et al., 1998) with thousands of neurons and large CNNs have recently shown outstanding results in difficult computer vision tasks, such as large scale category recognition (Krizhevsky et al., 2012).
1.2.1 Machine learning
Probability is at the basis of machine learning and PGMs offer a diagrammatic
rep-resentation of probability distributions (Kollar and Friedman, 2009;Jordan, 2004).
The PGM language has been first developed to offer an intuitive representation of the conditional independence properties of high dimensional probability distribu-tions, and it has evolved into a powerful modeling language that has unified many
machine learning approaches (Bishop and Nasrabadi, 2006). The characteristics
that have popularized PGMs are threefold:
• It provides building blocks (networks of random variables) that can be used to design complex probabilistic models.
• It comes with a sound theoretical analysis as well as a large set of algorithms for inference and learning.
• It makes explicit properties of the probabilistic model such as the conditional dependency rules.
In practice, a large number of real world problems involve inferring the assignments to variables which are related in a complex structure of dependencies. Most of these cases can be conveniently represented as PGMs. In particular, PGMs are instances of structured models (Bakir et al., 2007).
In recent years, substantial attention in machine learning has been given to structured learning. Structured learning is a meta-parameter optimization procedure
for structured models (seeLeCun et al.(2006);Nowozin and Lampert(2011) and
references therein for an introduction). Correlations between random variables influence two aspects of the learning problem:
• The output of the model can be structured. For example when performing se-mantic image segmentation, the segmentation output is interpreted as a graph connecting latent random variables associated with each pixel or superpixel (e.g.Lucchi et al.(2012)).
• The loss functions that measure the quality of a prediction can be structured. For example, when measuring segmentation performance the Rand Index is a nonlocal quality measure which is influenced by the label inferred for all pixels in the image (Kroeger et al., 2013).
Several algorithms for structured learning have been proposed in the context of
PGMs (Roller, 2004), Restricted Boltzmann Machines (RBMs) (e.g.Mnih et al.
(2012)), and support vector machines (SVMs) (Tsochantaridis et al., 2006). All
1.2. Recent developments in computational methods 7
(minimization of the energy) that defines the compatibility between structured input and structured output (e.g. the regularized loss function or a convex upper bound on
the loss, cf.LeCun et al.(2006)). Among these algorithms, structured support vector
machine (SSVM) has found widespread application in computer vision (Nowozin
and Lampert, 2011). The success of SSVM is mainly due to two reasons: first, it introduces a regularization term in the loss function which reduces overfitting and second, it exploits a training procedure based on cutting plane minimization of a convex upper bound on the empirical loss. This procedure exploits the training algorithm of standard SVMs using the same efficient quadratic solvers.
Another very active area of research has focused on kernel methods. Kernel methods have been proposed in order to create an implicit non-linear data
repre-sentation (Schölkopf and Smola, 2002) by exploiting the properties of the inner
product (kernelization). In particular, a significant performance improvement in
supervised classification, clustering, and regression has been shown for the family
of SVMs algorithms (Smola and Schölkopf, 2004). Also SSVMs can be kernelized
similarly to ordinary SVMs and have found recent applications in computer vision (cf. Nowozin and Lampert(2011);Blaschko and Lampert(2008)). However, the usage of kernelized SSVMs is still limited due to the high computational demand of using a structured kernel (i.e.joint kernels) (cf.Lucchi et al.(2012)).
1.2.2 Computer Vision
The big leap that computer vision and image analysis have taken in the last few
years banks on advancements inmodeling,parameters optimizationandfeatures
extraction.
The design of computer vision models has been strongly influenced by the PGM language of machine learning. One very popular example is the application
of Markov random fields (MRFs) theory in computer vision (Blake et al., 2011).
In particular, segmentation, depth estimation, denoising, matching and tracking
have been posed as large scale inference problems. MRFs representun-normalized
probability distributions in terms of factorizable energy functions and are one type of PGMs. The Gibbs relation is used to establish the correspondence between the energy states and the configurations of an underlying probabilistic model.
The core ideas which are used in computer vision are:
• Images are represented as nodes assigned to pixels or superpixels
• Latent variables are associated with the nodes and represent the state of the pixel (e.g. a discrete label)
• A joint probabilistic model relates latent variables and pixel values within a graph. Prior knowledge (e.g. neighboring pixels should have the same label) is inserted in the model by defining factors over subsets of latent variables. In order to minimize the discrete energy function of a MRF and to allow inference in large networks, powerful optimization methods have been developed such as
graph cuts, tree reweighted junction belief propagation, linear programming (LP) relaxations and dual decomposition, these are discussed in Sect. 1.2.3.
The energy function of MRFs typically depends on a large set of parameters that are often hand-tuned while evaluating the algorithm. Setting these parameters is frequently the critical step to obtain the best performance from the method. Therefore, the parameters must be often retuned when the model is applied to a new dataset. This can often be a particularly tedious procedure and motivates the attention given to structured learning which can produce optimal parameters from a training set of annotated images.
One apparent limitation of learning algorithms it that the image annotation process is often very time consuming. Large scale crowd-searching engines have
been developed to exploit the collective annotations ofnon-experthuman
label-ers. For example, theAmazon Mechanical Turk7 allows collecting thousands of
training examples in few hours at a relatively low cost, andLabelMe(Russell et al.,
2008) is an open-source annotation tool available online8or on mobile platforms.
However, such approaches are not applicable to labeling tasks which require expert supervision, like biomedical image analysis, or for unpublished and confidential
datasets. In these cases, structured learning from partial annotations (Lou and
Hamprecht, 2012) has been proposed as a means of reducing the labeling effort. In this framework, variables that are not labelled by the user or that are not accessible to direct observation are treated as latent variables in a similar fashion to latent
structured support vector machines (LSSVMs) (Yu and Joachims, 2009). Active
learning strategies (e.g.Culotta and McCallum(2005);Small and Roth(2010)) have
been also combined with structured learning. These boost learning rate by querying user annotations only for the most effective instances.
Feature extraction has also received great attention in recent years. Depending on the downstream tasks, the features can be either extracted densely from each pixel,
pooled over a group of pixels (e.g. Bag of FeaturesCsurka et al.(2004)) or computed
at sparse local key points (local descriptors). Two popular classes of features are
convolutions with non-linear filter banks (e.g. Structure Tensor EigenvaluesBigun
and Granlund (1987), Gabor Filters Jain and Farrokhnia(1991)) and gradient
histogram features (e.g. SIFTLowe(1999) and HOGDalal and Triggs(2005)). The
extracted descriptors are often very high dimensional which may require feature selection (Guyon and Elisseeff, 2003). In contrast to the latter approaches, which use
hand crafted sets of features, CNNs (LeCun et al., 1998) have been proposed as a
way to learn feature representations from raw pixel values directly. They achieve the state of the art classification results in challenging biomedical benchmarks (Ciresan et al., 2012, 2013).
Computer vision has borrowed successful approaches from machine learning, such as ensemble learning, to reduce the impact of high dimensionality of the descriptors (i.e. curse of dimensionality) and limit over-fitting. A versatile ensemble
7https://www.mturk.com/mturk/
1.2. Recent developments in computational methods 9
method, Random Forest (Amit and Geman, 1997;Breiman, 2001), combines sets of
decision trees. It has been shown to produce fast and accurate predictions in high dimensional classification, regression and density estimation tasks (Criminisi et al., 2011). Random Forests have some useful properties for computer vision tasks. First, because of their hierarchical structure they have a fast learning and testing time.
Second, they can be easily parallelized (even on the GPU (Sharp, 2008)), as each
tree is independent from the others during training and testing. Third, classification Random Forests are inherently a multi-class algorithm and thus the use of heuristics such as “one-vs-all” or “one-vs-one” is not needed. Fourth, they can be easily and robustly trained on-line (Saffari et al., 2009) in order to adapt to changes in the data
distribution. In addition,Breiman(2001) argues that Random Forests can handle a
significant amount of noisy features and noisy labels thanks to feature bootstrapping and the bagging of the training examples. For all these reasons, Random Forests find numerous applications in computer vision. They are exploited for semantic image labeling (Shotton et al., 2008), in image classification and retrieval (Bosch et al., 2007;Moosmann et al., 2007), in object detection and tracking systems (Gall et al., 2011;Godec et al., 2012) and as an internal component of commercial visual sensors like KINECT9(Shotton et al., 2013).
1.2.3 Optimization
The optimization community has been driven by the interest in Computer Vision for MRF models. In particular there has been a strong research in binary problems (the variables can only assume 0-1 values) that finds application in foreground-background segmentation. Large MRFs with binary submodular energy can be solved to optimality thanks to a polynomial time algorithm (min-cut/max-flow)
Boykov et al.(2001). The recently proposed QPBO algorithm (Rother et al., 2007) solves approximately general binary quadratic energies. However, integer pro-gramming is in general an NP-hard problem. For non binary problems, algorithms
based message passing schemes such as Belief Propagations (e.g. (Wainwright
et al., 2005)) have been successfully proposed to obtain approximate solutions. In particular graphs, such as fully connected MRFs, message passing (Mean Field
approximation (Krähenbühl and Koltun, 2011)) can be implemented very efficiently
through convolutions. An other particularly powerful techniques is convex
relax-ation (Komodakis and Tziritas, 2007) that reduce the integer problem to solving
LP optimization. Recently,Kappes et al.(2013) propose an extensive comparison
of techniques for MRF energy minimization. The authors observe that for small and moderate problem sizes, advanced integer linear programming methods using cutting-plane and branch-and- bound provide the exact optimal solution and tend to be faster than other approximate methods. However, on large scale problems or for complex high order energies LP relaxation provides approximate solutions that are close to the optimum, within the shortest runtime.
Convex optimization has also been intensively investigated as driven by the inter-est in machine learning (Sra et al., 2011). Among the most significant contributions to machine learning we shall mention methods for the solution of large quadratic
problems, which find application in training of SVMs (Platt, 1998;Joachims, 1999),
cutting plane for structured learning (Teo et al., 2010), and stochastic gradient
de-scent for large-scale learning problems (Bousquet and Bottou, 2007). This research
has been beneficial also to some non convex problems that can be decomposed
into convex subproblems (Yuille and Rangarajan, 2003), such as Difference of
Convex functions programming (DC) (Tao and An, 1997) that is used in training of
LSSVMsYu and Joachims(2009).
To conclude this overview, it is important to note that all the exciting research directions of the last decade could not have been pursued without the constant advance of high-performance computing. In particular, it is worth to remember the improvements given by parallelism. On the one side, this includes technical improvements on dedicated hardware such as GPUs or multiple CPUs architectures. On the other side, it comprises all algorithms that allow decomposing a large
optimization problem into a set of smaller ones (e.g. dual decompositionKomodakis
et al.(2007)).
1.3
Thesis overview
The research directions developed in this thesis have been driven by specific appli-cations in the field of biological image analysis. Each of the four central chapters propose a novel learning algorithm to address open challenges in two prominent
areas of research: large scale imagingandmultiple object tracking. These two
related areas have primary interest in contemporary research in the life sciences. Indeed, as detailed in section 1.1, large scale imaging is the general trend of modern scientific research while multiple object tracking finds numerous applications in cells and animals tracking.
The inspiring principle of our work is to provide the users with methods based on learning that can be trained with reduced effort. This motivates our research and our proposals in the field of learning from partial as well as weak annotations. As reviewed in section 1.2.1, these learning approaches aim to keep the flexibility of supervised methods to adapt to the data while reducing the user annotation cost.
In particular, the content of each chapter is as follows:
• Chapter 2: In large scale imaging, quantitative data is gathered by algorithms on collections of images which are never directly seen by a human expert. High quality becomes a critical factor in such experiments in order to avoid jeopardizing the downstream statistical analysis. In this chapter, we propose a novel weakly supervised defect detection algorithm for large scale automatic
1.3. Thesis overview 11
microscopy screenings. While object detection is traditionally posed as a supervised classification problem, in our experimental setting the collection of enough representative examples for the rare and highly variable defect class can become a daunting task. The main contribution of this chapter is to perform defect detection with weak annotations that are faster to acquire. • Chapter 3: One of the most useful assays in large scale automatic screenings
is cell counting, which has important applications in the assessment of toxicity of newly developed drugs. Counting methods based on individual cell seg-mentation are strongly biased when cells overlap due to under-segseg-mentation. This chapter builds on a recent approach for counting overlapping objects in
images which avoids the hard task of single instance segmentation (Lempitsky
and Zisserman, 2010). Only minimal user annotations are required: a dot in the centre of each cell. The main contribution of this chapter is a novel algo-rithm based on structured labels Regression Random Forests which greatly simplify the original method while maintaining similar performance. • Chapter 4: Multiple object tracking finds numerous practical applications in
bioimage informatics. The widely used class oftracking by model-evolution
methods requires initialization of the tracked object (seeding). This step is often performed fully manually or with some heuristics. This chapter proposes a method that can reliably detect isolated individuals and thus can be exploited for automatically seeding downstream tracking algorithms. In addition, it
delivers the number of objects ineachforeground connected component and
therefore detects mutual occlusion events (clusters of objects). Besides these results, which are exploited for the tracking algorithm of Chapter 5, the main contribution of this chapter is a temporally consistent structured model for object counting (a graphical model with deterministic potentials).
• Chapter 5: Clarifying complex animal behavior such as social interaction requires tracking of each individual in a large population. However, this is a particularly challenging problem when local features do not allow distinguish-ing between each target. This chapter proposes a novel structured learndistinguish-ing algorithm for tracking overlapping translucent and indistinguishable objects. Our main contribution is an explicit modeling of the mutual occlusion dy-namics formulated as a convex multicommodity flow problem. Unlike other tracking methods which require hand tuning, our approach finds its optimal
parameters frompartialuser annotations.
All chapters are self-contained and organized following a similar scheme. First, the introduction of each chapter poses our contribution in the general context of the thesis with respect to the other chapters. Second, the relevant work for the problem is reviewed and the importance of our contribution is motivated. Third, the central sections introduce our model and demonstrate the validity of our approach with extensive experiments. Finally, we conclude each chapter by discussing the
contributions of our method together with its assumptions and limitations.
A final discussion that summarises the presented material, highlight our main contributions and outlines future research directions is provided in Chapter 6.
Chapter 2
Quality Control
of Microscopy Images
As argued in Chapter 1, a trait of contemporary scientific research in biology is the extensive usage of large-scale automatic microscopy. In this scenario, im-portant information will be discovered by automatically analyzing the resulting image databases. However, an important prerequisite for an accurate analysis is a robust quality control of the images. Defect images can indeed invalidate the down-stream statistical analysis or even mask out rare events such as rare cells phenotypes.
This chapter presents a weakly supervised learning framework to detect defects in high content screening (HCS). Unlike fully supervised object detection methods our proposal is to cast the problem as a novelty detection task based on one-class support vector machine (OCSVM) learning. The advantage of our approach is to avoid the tedious task of mining the dataset for defect images. Our training proce-dure requires only training examples for images of the abundant normal class. Our framework resembles a cascade of classifiers with feature and similarity measure designed for detecting different defect classes (i.e. global and regional). The latter characteristic, in combination with a fast runtime, could support the microscopic machinery in refining data acquisition in place.
This chapter is organized as follows: in section 2.1 we review the relevant literature on microscopy imaging quality control and outliers detection. In section 2.2 and 2.3 we discuss the distinct characteristics of the most common defects in HCS microscopic images and propose adequate similarity measures (features and kernels) at the different stages of a classifiers cascade. As reported in section 2.4, we evaluated this framework on a HCS database and obtained a 96.9% F-score for the important normal class. The contamination of the dataset with defects
from the initial10%is reduced to only0.3%, providing an high quality dataset to
downstream assays such as cell counting that is discussed in Chapter 3. The chapter is closed with a final discussion on the method in section 2.5.
2.1
Related work and contributions
High quality science depends more and more on high quality data. Indeed, large
sci-entific projects, such as the Fly-Olimpiad1project, are acquiring massive databases
in fully automated experiments. Quality control for large scale biomedical databases
have been already address in the context of microarrayShi et al.(2006) while few
attention has been given to imaging data. However, the key role that imaging plays
in biomedical research (Megason and Fraser, 2007) have risen urgent demand for
quality control of imagery databases (Pepperkok and Ellenberg, 2006). Most of the
existing methods are based on manual inspection or semi-automated processing (Goode et al., 2008;Bray et al., 2012) and are not suited to address a large
flow-of-data. Nowadays, the output of HCS (Echeverri and Perrimon, 2006) microscopy
can reach millions of images per experiment and the newest microscopes (such
as those used in connectomics (Kaynig et al., 2008)) can produce 3D volumetric
images which further increase the amount of data.
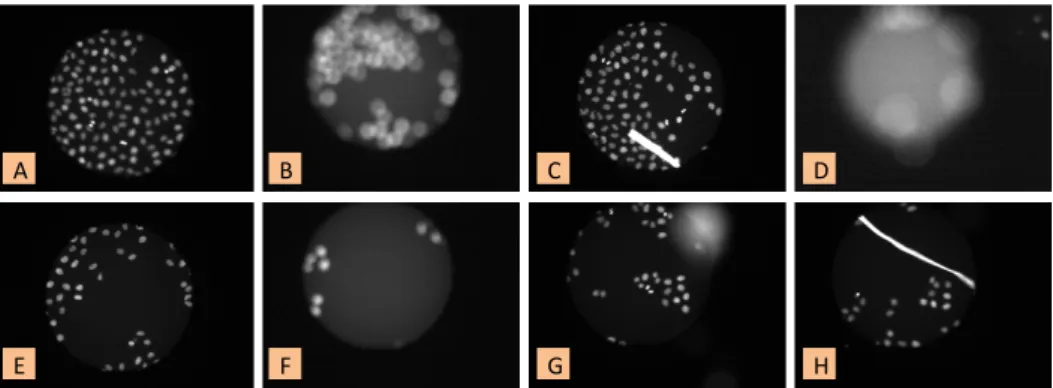
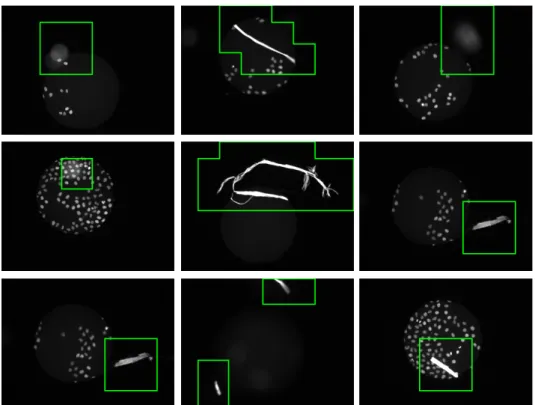
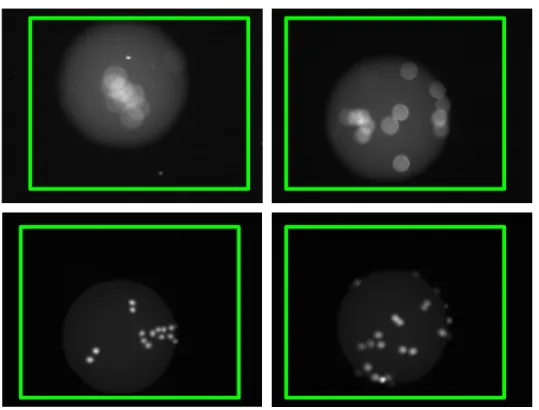
In this chapter we propose a scalable method for quality control in large scale HCS imaging experiments. Imaging biological data is a very sensitive process and defects can occur in multiple places (Goode et al., 2008;Bray et al., 2012). First, during sample preparation such as the contamination from debris or errors in the staining. Second, during image acquisition such as out-of-focus images or images with unheaven contrast and illumination. Fig. 2.1 shows examples of typical defects compared to normal images (Fig. 2.1 A and E). Defects are difficult to retrieve (minority class) and show a high variability in appearance. They can occur at the full image scale due to out-of-focus (Fig. 2.1 B, D and F), or only in confined regions within the image due to contamination or wrong staining (Fig. 2.1 C, G and H). Even though a quantitative analysis of the impact of defect images is beyond the scope of this chapter, we estimated that a typical HCS dataset, obtained with
a state of the art microscope (Reymann et al., 2009), can contain up to5−10%
defect images. Given the sensitivity required in HCS studies (such as cell counting assays), this rate of contamination is non negligible and should be taken into account in any careful study because defects will jeopardize downstream analysis such as segmentation, registration and tracking.
Many challenges needs to be addressed for the quality control of HCS imaging databases. Firstly, supervised classification (based on support vector machine,
random forest, etc.Hastie et al.(2001)) is very inefficient because the rareness of
defect images makes it too time consuming to collect training examples. Indeed, the acquisition of a sensible training set for the defects can require manual inspection of a large part of the dataset. For example defect detection could be performed with
a generic object detection algorithm (e.gViola and Jones(2004)), but in practice
this approach is very expensive in terms of annotation effort as it requires several training examples. Secondly, it is also difficult to characterize directly the statistical distribution of the defects because of the large variability in scale and appearance
2.1. Related work and contributions 15
! " # $
%& '& ( )
Figure 2.1: Examples of normal and defect images in the database acquired with a
state of the art high-content screening microscope (Reymann et al., 2009). In the
table: (A) and (E) normal images; (B), (D) and (F) out-of-focus; (C), (G) and (H) debris.
(Bray et al., 2012). Finally, the data throughput from modern microscopes makes manual inspection impracticable while automatic analysis requires algorithmic scalability and the support of parallel computing (Goode et al., 2008). To tackle all these challenges we pursued two goals in the design of our framework: low labeling efforts and high scalability.
We cast the quality control task as an novelty detection problem (Chandola
et al., 2007) (i.e. defect images as anomalies) and chose to develop our framework
based on the OCSVM (Schölkopf et al., 2001;Tax and Duin, 1999). Briefly, in a
novelty detection problem the training data is not polluted by outliers and we are interested in detecting anomalies in new observations. This is related to an outliers detection problem where the training data already contains outliers and the task is to fit the central mode of the distribution, ignoring the deviant observations. During the training phase of our method, the user provides labels for the normal images only. These samples are fed to a cascade of OCSVM classifiers that, in a projected space by kernalization, find the most compact “ball” to enclose the training data. The mathematical formulation of OCSVM is explained in detail in section 2.3.1. Test samples outside this ball (i.e. the decision boundary) will be classified as outliers. While a single OCSVM is, in theory, sufficient to detect distribution outliers, we propose to use a cascade of classifiers which builds a hierarchical image representation. Anomalous images are captured at multiple scales leading to two main advantages. First, running time is comparable with data acquisition time and second and the ability to discriminate between regional and global defects. Both properties are appealing because they can allow a feedback loop while acquiring the images. For example, an out-of focus detection could trigger a refocusing of the microscope without need to discard the data.
In summary, our major contribution is a one-class classifier cascade workflow which copes with various causes of anomalies given only labels for normal images.
This framework achieves a good scalability and accuracy while simplifying the training procedure for the user.
2.2
Defects in Microscopic Images: Global vs. Regional
We group common causes for image defects into two classes, depending on whether they affect the imagegloballyorlocally. A typical cause for global defect is out-of-focus imaging and typical examples of regional defects such as debris contamination
(e.g. hair) (Bray et al., 2012). We handle these two types of defects differently
with appropriate features and similarity measure, which allows to predict three classes (normal, globally defect and regionally defect) even when training samples are provided for the normal class only. The advantage of keeping these classes separated is that when global defects (due to out of focus) are detected during image acquisition, they can be immediately corrected by retaking the image without need to discard the data.
A characteristic of global defect is that they can be detected from the statistics drawn from the entire image. The formation of images is the convolution of the
real light with the point spread function (PSF) (Born and Wolf, 1999). When
out-of-focus occurs, the PSF becomes wider, and this can be seen from the intensity histogram of the gradient magnitude drawn from the entire image (e.g. Fig. 2.2 A vs. Fig. 2.2B, intuitively small texture edges with low magnitude are filtered out while strong edges are blurred).
The task becomes more difficult when regional defects occur, because they exhibit considerable variability in scale, position and shape. A global statistic is no longer informative, e.g. the histogram of the gradient magnitude in Fig. 2.2A (normal) is very similar to Fig. 2.2C (regional defect), and extracting information from fine regional details becomes necessary. In addition, regional defects show significant variability in appearance and scale, implying the requirement of more features to achieve a sufficient discriminative power.
2.3
Classification by One-Class SVM Cascade
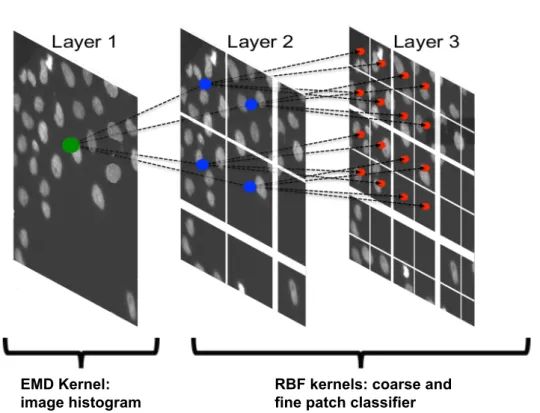
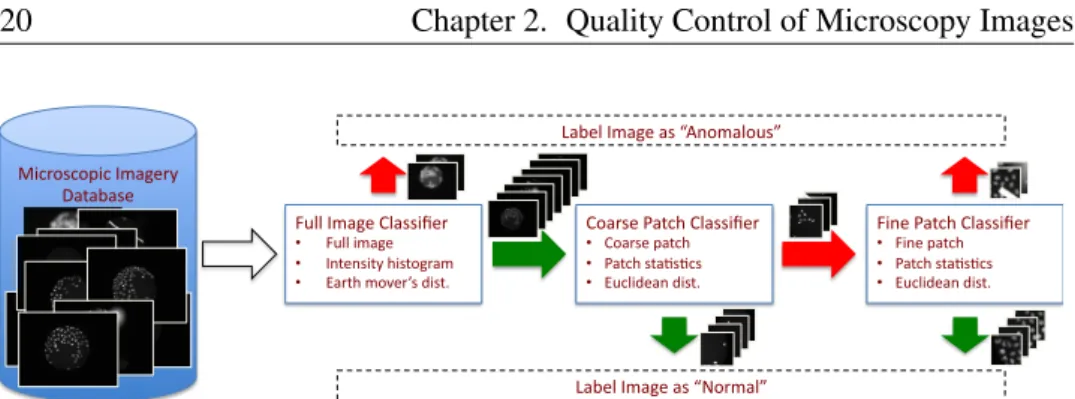
The proposed quality classification framework is shown in Fig. 2.4 and consists of multiple stages which handle different defect classes. The first stage aims to filter out global defects by operating on the full image. The second and the third stage detect the defects at patch level. The second stage implements a coarse path classifier and the third one conveniently refines the results obtaining an overall speedup in the regional defects detection task.
The framework is similar to a cascade of OCSVM classifiers that use different kernel metrics (an earth mover’s distance (EMD) kernel for stage one and two radial basis function (RBF) kernels for stage two and three, as depicted in Fig. 2.3) in order to maximise the tradeoff between speed and performance.