arXiv:astro-ph/0605298 v1 11 May 2006
A FIRST-APM-SDSS survey for high-redshift radio QSOs
R. Carballo,
1⋆
, J.I. Gonz´
alez-Serrano,
2F.M. Montenegro-Montes,
3C.R. Benn,
4K.-H. Mack,
3M. Pedani,
5M. Vigotti
31 Dpto. de Matem´atica Aplicada y Ciencias de la Computaci´on, Univ. de Cantabria
ETS Ingenieros de Caminos, Canales y Puertos, Avda de los Castros s/n, E-39005 Santander, Spain
2 Instituto de F´ısica de Cantabria (CSIC-Universidad de Cantabria), Avda de los Castros s/n, E-39005 Santander, Spain 3 Istituto di Radioastronomia, INAF, via Gobetti 101, I-40129 Bologna, Italy
4Isaac Newton Group, Apartado 321, E-38700 Santa Cruz de La Palma, Spain 5Centro Galileo Galilei, E-38700 Santa Cruz de La Palma, Spain
12 May 2006
ABSTRACT
We selected from the VLA FIRST survey a sample of 94 objects with starlike coun-terparts in the Sloan Digital Sky Survey, and with APM POSS-I colour O−E ≥2, i.e. consistent with their being high-redshift quasars. 78 of the 94 candidates can be classified spectroscopically on the basis of either published data (mainly SDSS) or the observations presented here. The fractions of QSOs (51 out of 78) and redshiftz >3 QSOs (23 out of 78, 29 per cent) are comparable to those found in other photometric searches for high-redshift QSOs. We confirm that selecting colourO−E≥2 ensures inclusion of all QSOs with 3.7≤z≤4.4. The fraction of 2≤z≤4.4 QSOs with broad absorption lines (BALs) is 27±10 per cent (7/26) and the estimated BAL fraction for radio loud QSOs is at least as high as for optically selected QSOs (∼13 per cent). Both the high BAL fraction and the high fraction of LoBALs among BALs (four to five out of 7) in our sample, compared to previous work, are likely due to the red colour selectionO−E≥2. The space density of radio loud QSOs in the range 3.7≤z≤4.4 (¯z= 4.0) withMAB(1450)≤ −26.6 andP ≥1025.7W Hz−1is 1.7±0.6 Gpc−3. Adopt-ing a radio-loud fraction of 13.4±3 per cent, this corresponds toρ= 12.5±5.6 Gpc−3, in substantial agreement with the cumulative luminosity function of SDSS QSOs in Fan et al. (2001a). We note the unusual flat-spectrum radio-luminous QSO FIRST 1413+4505 (z = 3.11), which shows strong associated Lyα absorption (rest-frame equivalent width ∼40 ˚A) and an extreme observed luminosity,L∼2×10¹⁵
L⊙.
Key words: surveys – quasars: general – galaxies: high redshift – early Universe – radio continuum: galaxies
1 INTRODUCTION
This is the third of a series of papers presenting new samples of high-redshift radio QSOs selected by matching the FIRST catalogue of radio sources (Faint Images of the Radio Sky at Twenty-cm; Becker, White & Helfand 1995, White et al. 1997) with red starlike objects from the APM (Automated Plate Measuring Facility) catalogue of the POSS-I survey (McMahon & Irwin 1992).
Papers I and II (Benn et al. 2002, Holt et al. 2004) re-ported a sample of 18 z > 3.6 QSOs including the largest sample ofz >4 radio-selected QSOs then known. The search was carried out within a∼7030 deg2 region using the
con-⋆ E-mail:[email protected]
straints: i)E≤18.8 and starlike, ii)S1.4 GHz≥1 mJy, and
iii) colour selectionO−E≥3. This colour range includes an estimated 95±1.5 per cent ofE <18.8 QSOs with redshift 3.8< z <4.5 (Vigotti et al. 2003). On the basis of the 13 QSOs with z ≃3.8−4.5 and comparing to an equivalent sample atz≃2 drawn from the FIRST Bright Quasar Sur-vey of the north Galactic cap (FBQS-2, White et al. 2000), we showed (Vigotti et al. 2003) that the decline in space density ofMAB (1450 ˚A)≤ −26.9 QSOs (H◦= 50 km s−1 Mpc−1, Ω
M = 1 and ΩΛ = 0 here and throughout the
pa-per) was approximately a factor 2 betweenz∼2 andz∼4, significantly smaller than the value∼10 found for samples including lower luminosity objects (Fan et al. 2001a).
The Sloan Digital Sky Survey Data Release 3 (SDSS, Stoughton et al. 2002; DR3 Abazajian et al. 2005) provides
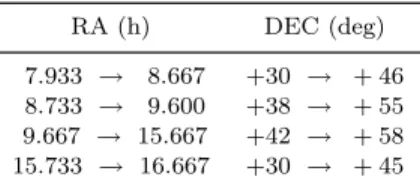
Table 1.Right ascension and declination ranges of the four areas of sky included in the survey.
RA (h) DEC (deg)
7.933 → 8.667 +30 → + 46 8.733 → 9.600 +38 → + 55 9.667 → 15.667 +42 → + 58 15.733 → 16.667 +30 → + 45
moderately deep CCD imaging in five bands ugriz cover-ing ∼ 5282 deg2. We present and discuss a new sample of high-redshift radio-selected QSO candidates in a 1378.5 deg2
area of overlap between FIRST and SDSS DR3 in the north Galactic cap. The selection criteria are: i) E ≤ 19.1 and starlike in APM, ii)S1.4 GHz≥1 mJy, iii) radio-optical
sep-aration less than 1.5 arcsec, iv) colour O−E ≥2 (includ-ing O non-detections) and v) starlike in SDSS. This new sample, with a wider colour range, has several advantages. Firstly, the SDSS photometric catalogue provides reliable morphological classification of the sources, allowing us to readily eliminate the galaxies classed as starlike in APM POSS-I. Secondly, SDSS provides ∼3 ˚A-resolution spectra and spectroscopic classifications of many objects, particu-larly those selected as QSO candidates on the basis of their
ugrizcolours, or as counterparts of FIRST sources. We con-tinue to use the APM catalogue for colour selection since our previous work showed a high efficiency and completeness in the selection of z >3.85 QSOs usingO−E≥3 and with the new limitO−E≥2 we can check that noz >3.7 QSOs haveO−E <3.
The paper is structured as follows. In Section 2 we present the sample and the status of the spectroscopic clas-sification. Section 3 reports optical spectroscopy of part of the sample. The spectroscopic classification of the sample as QSOs, narrow emission line galaxies or stars is presented in Section 4.1. The distribution of optical magnitudes and
O−Ecolours is discussed in Section 4.2. In Section 4.3 the sample is compared with previous radio-selected QSO sam-ples from the literature, in terms of the selection criteria and the resulting QSO redshift distribution. In Section 4.4 we comment briefly on the spectra of seven QSOs exhibit-ing strong blueshifted broad absorption lines (BALs) and we analyse the fraction of BAL QSOs in the sample. Section 4.5 is devoted to the peculiar QSO FIRST 1413+4505. In Sec-tion 4.6 we compute the absolute magnitudes,k-corrections and radio luminosities of the 10 QSOs withz≥3.7, and we discuss the completeness of a sub-sample of seven of them. In Section 5 we use this sample to calculate the space density of QSOs. Section 6 summarizes our conclusions.
2 SELECTION OF THE SAMPLE
The sample was selected from the 1378.5-deg2 area defined
in Table 1. This area includes most of the region covered by SDSS DR3 in the north Galactic cap, which is also cov-ered by the FIRST survey and by the APM catalogue of POSS-I. The FIRST survey includes 122463 sources in this area withS1.4 GHz(peak)≥1 mJy, of which 113 have APM
E <19.1,O−E >2.0 and lie within 1.5 arcsec of starlike objects in SDSS DR3. Eighteen of these were undetected in
APM POSS-IObut were detected in APS POSS-I Oand
had APS(O−E) < 2, and were therefore removed from the sample. For the source FIRST 1340+5619 we found a large difference between the SDSS and APM magnitudes (r= 23.51 versusE= 18.99) and the source was eliminated from the sample after confirming with SDSS that the APM counterpart is a blend. The final sample thus includes 94 candidate high-redshift radio QSOs.
Of these 94 candidates, spectra were first obtained for seven in papers I and II, for six in the literature (found us-ing the NASA Extragalactic Database - NED) and for 41 by SDSS DR3 (which also reobserved nine of the thirteen previously discovered). In Section 3 we present TNG optical spectroscopy of 13 (randomly selected) of the 40 remain-ing candidates, and we classify an SDSS DR3 source given spectral class ‘unknown’ in the Sloan survey. Subsequent to these observations, SDSS DR4 (2005 June 30) reported spec-troscopy of 10 of the remaining 27 candidates (and also of four of those observed here). In total, 78 of the 94 candi-dates (83 per cent) are now spectroscopically classified (see Section 4.1).
3 TNG OPTICAL SPECTROSCOPY
Spectra of 11 candidates (indicated in column 9 of Table 2) were obtained with the Telescopio Nazionale Galileo (TNG) on 2005 March 10 and 11 using the DOLORES (Device Opti-mized for LOw RESolution) spectrograph in long-slit mode. The LR-B grism was used, yielding a wavelength range 3000 – 8800 ˚A and dispersion 2.9 ˚A pixel−1. The detector was a
thinned, back-illuminated Loral CCD with 15µm pixels. Ex-posure times were typically 900 s. Three spectrophotometric standard stars were observed in order to calibrate the instru-mental spectral response. The seeing was≈1.8 arcsec, and the width of the slit was set to 2 arcsec, yielding a spectral resolution of 23 ˚A, as measured from sky lines.
Standard data reduction was carried out using the IRAF†package. Arc-lamp exposures were used for the wave-length calibration, and yielded solutions with rms residu-als<1.5 ˚A . Small spectrum-to-spectrum wavelength shifts were corrected using sky lines in the science spectra. In most of the spectra, the two or three brightest sky emission lines were not completely removed in the sky subtraction. This did not affect spectral classification or redshift measurement, but for presentation in Figs. 1, 2 we manually cleaned some of the strongest residuals.
Spectra of two more candidates (FIRST 1343+4305 and FIRST 1405+5155) were obtained with similar instrumental set-up on the nights of 2005 July 12 and 13. Two spectra per object were taken, shifting the object along the slit to minimize the effect of detector artefacts and remove the OH sky lines. For each object, one 2D spectrum was subtracted from the other, to remove the background, then wavelength calibrated, aligned in the spatial direction and coadded.
Ex-† IRAF is distributed by the National Optical Astronomy Ob-servatories, which is operated by Association of Universities for Research in Astronomy, Inc., under cooperative agreement with the National Science Foundation.
O VI N V C IV Si IV Al III band band band Mg II He I O III [O II] [Ne III] Mg II [O II] C III] Limit Ly O VI N V O I Si IV C IV C III] Mg II [Ne V] [O II] [Ne III] [O III] O I Mg II C III]
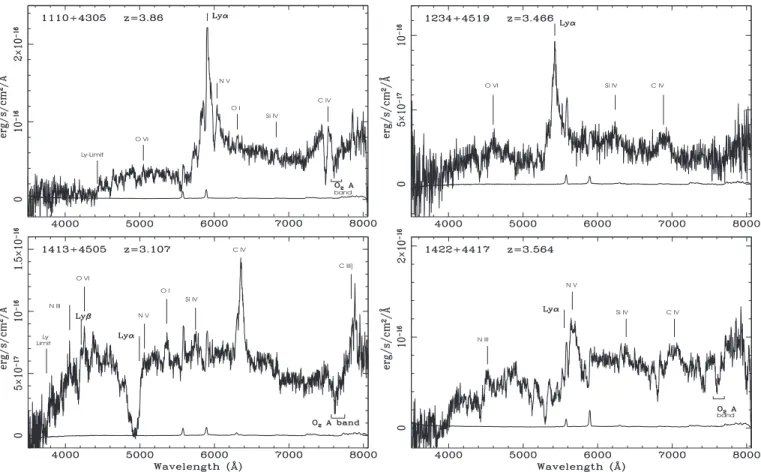
Figure 1.TNG spectra of the four QSOs and the emission-line galaxy identified for the first time here, and the SDSS spectrum of source FIRST 1039+4931, which was classified ‘unknown’ in SDSS. The night sky spectrum (scaled) is shown near the zero level in the TNG spectra. The emission features are labelled by ion (wavelengths from Vanden Berk et al. 2001).
posure times were 2×1800 s for 1343+4305 and 2×1200 s for 1405+5155.
The 13 objects include eight QSOs, one z = 0.2705 emission line galaxy (ELG), and four late-type stars. The redshift of each QSO was estimated as the average of the values measured from individual emission-line centroids (ex-cluding Lyα, which is often affected by Lyαforest absorp-tion). Six of the QSOs have 3.1 < z < 3.9, the other two havez= 0.897 andz= 0.943.
The TNG spectra of the eight QSOs and the ELG are shown in Figs. 1 and 2. Fig. 1 also shows the SDSS DR3 spec-trum of FIRST 1039+4931, classified ‘unknown’ in SDSS, but which we identify as a QSO at z = 1.09. Four of the eight QSOs were also observed in SDSS DR4, published
af-ter our TNG observations took place. The TNG spectra of these four objects are shown in Fig. 2.
4 PROPERTIES OF THE SAMPLE
4.1 Spectroscopic classification
Table 2 lists the basic optical and radio properties of the 94 objects in the sample, together with the spectroscopic classification and redshift, mostly from SDSS DR3 and DR4. The spectra were classified as one of: QSO (broad emission lines), emission-line galaxy (narrow emission lines), late-type star or early-type star. The sample of 94 objects includes 51 QSOs (0.27< z <4.31), 25 stars, two ELGs (z= 0.27,0.31) and 16 objects with no optical spectrum, i.e. 78 out of 94 (83
Ly-Limit O VI N V O I Si IV C IV band O VI Si IV C IV Limit Ly N III O VI N V O I Si IV C IV C III] N III N V Si IV C IV band
Figure 2.Spectra of four QSOs identified at the TNG and also observed by SDSS DR4.
14 15 16 17 18 19 20 0 5 10 15 20 25 E Number
Figure 3.Distribution of correctedEmagnitude. QSO identifica-tions are shown in black, stars and ELGs in grey and unclassified sources in white.
per cent) are classified. Of the 78 objects with spectra, 38 per cent (30/78) are QSOs withz≥2, 29 per cent (23/78) are QSOs withz≥3 and 13 per cent (10/78) are QSOs withz≥
3.7, confirming the efficiency of the adopted selection criteria for identifying moderate- to high-zQSOs. The efficiencies of previous radio QSO surveys are compared in Section 4.3.
4.2 Distribution of optical magnitudes andO−E
colours
In Table 2 and hereafter, unless otherwise indicated, the quoted POSS-I APM magnitudes are recalibrated with re-spect to APS (McMahon et al. 2002), and are corrected for Galactic reddening. This results in some of the sample hav-ing finalO−E <2 andE >19.1 (the recalibratedE mag-nitudes are typically 0.3±0.3 mags fainter than the original APM values). The histogram of theE magnitudes is shown in Fig. 3.
Fig. 4 shows the distribution O−E versus E. QSOs have a broaderO−E colour range than stars. The ratio QSOs/stars increases from 21/12 in the range 17.1< E ≤
18.6 to 29/5 forE > 18.6 (see also Fig. 3). Assuming that the unclassified sources in Fig. 4 are either QSOs or stars, the distribution inO−E versusE suggests that∼60 per cent are QSOs.
Fig. 5 (see also Fig. 6b) shows that the QSO colours redden significantly with redshift: the four measured values ofO−E and three out of six lower limits implyO−E >
3 forz >3.7. This is due to the drop in intensity in theO
band as it becomes more dominated by the region blueward of the Lyman limit, and the increase in intensity in theE
band as Lyαenters the band.
An important conclusion from Fig. 5 is that the colour cutO−E≥2 includes most of the QSOs with 3.7≤z <4.4, and this result is in agreement with previous studies. In Vigotti et al. (2003) we estimated a fraction ofz >3.8 QSOs with APM(O−E)>3 of 95±1.5 per cent, using a sample
14 15 16 17 18 19 1.5 2 2.5 3 3.5 4 E O−E QSOs z > 3.7 QSOs z < 3.7 stars ELGs unclassified
Figure 4.Colour-magnitude diagram for all 94 candidates in the sample. The dashed line corresponds to an assumed POSS-I blue plate limitO= 21.7 (referred to the APS calibration). Arrows show objects not detected inOband.
Table 3.Selection criteria and QSO fractions for FBQS-2 and for the current sample
FBQS-2 This work
Area (deg2) 2682 1378.5
E ≤17.8 ≤19.1(1)
O−E ≤2 ≥2(1)
Radio-opt separation (arcsec) ≤1.2 ≤1.5 Starlike morphology EorO Eand SDSS
Number of candidates 1238 94
Number of spec. class. 1130 78
Number of QSOs 636 51
Number of QSOs 2≤z <3 53 7
Number of QSOs 3≤z <3.7 12 13
Number of QSOsz≥3.7 0 10
1:OandE magnitudes as taken directly from APM
withE(APM) ≤18.8. In FBQS-2 (White et al. 2000,O− E≤2 andE≤17.8) 90 per cent of the QSO candidates were spectroscopically classified, and these included 636 QSOs, none of which had z > 3.5, although 12 had 3 < z <3.5. We are therefore confident that the number of QSOs we find with 3.7≤z≤4.4 is limited only by the radio andE band flux density limits, with no QSOs missed due to the colour selection. 0 0.5 1 1.5 2 2.5 3 3.5 4 4.5 1.5 2 2.5 3 3.5 4 redshift O−E
Figure 5.O−E versus redshift for the QSOs in the sample.
4.3 Comparison with other radio samples
The survey reported here can be considered complementary to FBQS-2. Both surveys select FIRST radio sources with starlike optical counterparts, but the colour criteria areO− E≤2 for FBQS-2 (blue-excess objects) andO−E≥2 for our work. In FBQS-2 objects were selected withO−E≤2 to eliminate galaxies, since catalogues based on photographic plates provide poor discrimination between stellar and non-stellar objects. The survey selection criteria, and the QSO
Table 4.Well-defined samples ofz≥3 radio-selected QSOs
Reference, radio/opt limits Area (deg2) Cands. Spec. Class. z >3.0 z >3.7
(1) (2) (3) (4) (5) (6)
Hook et al. 1998 1600 73 50 6/50 12% 0/50 0%
Green BankS5 GHz≥25 mJy
FIRSTS1.4 GHz α51.4≥ −0.5
APM POSS-IE≤19.5, O−E≥1.2
Snellen et al. 2001 6400 27 27 9/27 33% 5/27 19%
Green BankS5 GHz≥30 mJy
NVSSS1.4 GHz α51.4≥ −0.35
APME <19,O−E >2
Hook et al. 2002 7265BR 228 202 18/202 9% 12/202 6%
Green BankS5 GHz≥50 mJy (3637BRI)
NVSSS1.4 GHz α51.4≥ −0.5 APM UKSTR <21;B−R≥1.5 orR−I≥1 orB−I≥2 Holt et al. 2004 7030 194 121 15/121 12% 15/121 12% FIRSTS1.4 GHz≥1 mJy APME <18.8, O−E >3 This work 1380 94 78 23/78 29% 10/78 13% FIRSTS1.4 GHz≥1 mJy APME≤19.1, O−E≥2
Col. (1): reference, optical and radio catalogues, and optical and radio flux-density and spectral-index (Sν ∝να) limits. (2): survey area. (3,4,5,6): number of candidates, number of candidates with spectroscopic classification and the fraction of the latter at redshiftsz >3 andz >3.7.
14 15 16 17 18 19 20 −1 0 1 2 3 4 E O−E a 0 0.5 1 1.5 2 2.5 3 3.5 4 4.5 −1 0 1 2 3 4 redshift O−E b
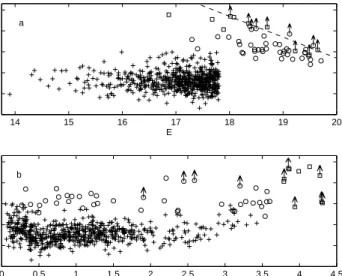
Figure 6.(a)O−EversusEfor the QSOs in FBQS-2 (crosses) and in this work (circles forz < 3.7, squares forz≥3.7). The dashed line corresponds to the assumed POSS-I blue plate limit
O= 21.7.(b)O−E versuszfor the same QSOs.
fractions as a function of redshift, are compared in Table 3. Figs. 6a and 6b showO−EversusEandO−Eversuszfor the QSOs in the two surveys. Whereas the redshifts covered by FBQS-2 range up to 3.4, our sample includes redshifts up to 4.3 (Fig. 6b, Table 3), and this is a consequence of both the colour cut and the fainter magnitudes.
The efficiency of QSO selection in this work (51/78 = 65 per cent) is slightly larger than in FBQS-2 (636/1130 =
56 per cent). Although our selection criteria filter out most of the QSOs belowz= 3.5, and these are covered by FBQS-2, our survey is better at rejecting galaxies, since we take the morphological information from SDSS whereas FBQS-2 used the less reliable APM discrimination. Although our sample has fewer sources, the efficiency for moderate to high redshift QSOs is high: 20/78 = 26 per cent for 2≤z ≤3.7 compared to 65/1130 = 6 per cent for FBQS-2. Atz ≥3.7 the efficiency of our selection is 10/78 = 13 per cent. The maximum redshift in FBQS-2 isz= 3.4.
Table 4 compares the sizes and search efficiencies of var-ious radio-selected high-redshift QSO samples. The success-rate for high-zQSOs and the number of QSOs in this work are comparable to or larger than those of previous searches for radio-selected QSOs at muchhigherradio flux densities.
4.4 The fraction of BAL QSOs
Twenty-six of the QSOs with spectra have redshifts 2.0 ≤ z≤4.4, so that Siiv1397 ˚A and Civ1549 ˚A are included
in the observed wavelength range. Seven of these QSOs show strong broad absorption lines (BALs) with velocity widths above 2000 km s−1 and reaching velocities above 3000 km
s−1, and were classified as BALs. The balnicity index (BI) of
each BAL was computed following the prescription of Wey-mann et al. (1991) and is presented in Table 5.
The fraction of BALs in our sample is therefore 7/26 = 27±10 per cent. For comparison, from the study of the BAL QSOs in FBQS-2 (Becker et al. 2000) we derive an ob-served fraction of BALs for 1.5≤z ≤3 and 15≤E≤17.8 of 14/134 = 10±3 per cent (BALs with BI=0 excluded).
N V Si IV C IV C III] Al III O VI band Mg II N V Si IV C IV C III] Al III band C IV Si IV C III] Al III C II] N V C IV Si IV C III] Al III Fe III UV 48
Figure 7.SDSS spectra of four of the seven 2≤z≤4.4 BAL QSOs in the current sample. The three remaining spectra are presented in Fig. 1 of this paper, in Benn et al. (2002) and in Benn et al. (2005).
In view of the redder colours found for BALs, compared to non-BALs, and the adopted colour selection, O−E ≤ 2, Becker et al. conclude that the BAL fractions derived from their work should be considered as lower limits. Our result, 27±10 per cent, confirms a larger fraction of BALs in a red-selected sample (O−E ≥2), and following their argu-ment this value should be considered as an upper limit to the actual fraction. We note however, that the distribution of balnicity indices for the FBQS-2 BALs reaches lower val-ues than the one in Table 5, which is more similar to the BI distribution of the BAL sample in Weyman et al. (1991), nowadays regarded as highly conservative. In particular we have 6/7 cases with BI≥4500 km s−1 (86 per cent),
Wey-man et al. 24/40 (60 per cent) and Becker et al. 6/14 (43 per cent). Because of our selection of the stronger BALs, in the comparison with FBQS-2 the fraction 27±10 per cent should be regarded as a lower limit. Differences in the opti-cal magnitudes and redshift ranges, along with small number statistics could explain the differences in the BAL fractions between FBQS-2,>10±3 per cent, and our work, 27±10 per cent.
Reichard et al. (2003a) obtained for a QSO sample se-lected from SDSS Early Data Release at 1.7≤z ≤4.2 (re-gardless of radio emission) an observed BAL fraction 14±1 per cent. The BI distribution of these BALs reaches low values, with only 14/185 = 8 per cent of them having BI≥
5000 km s−1(Reichard et al. 2003b). Reichard et al. (2003a)
confirm that BAL QSOs are redder than non-BALs, and es-timate a true BAL fraction of 13±1 per cent, taking into
Table 5.Balnicity indices of thez >2 BAL QSOs
FIRST zQSO BI BAL Spectrum
name km s−1 type 0837+3641 3.416 5600 LoBAL SDSS, Fig. 7 1134+4318 2.184 9800 LoBAL? SDSS, Fig. 7 1219+4849 3.201 4800 LoBAL TNG, Fig. 1 1408+5553 2.446 4500 SDSS, Fig. 7 1459+4931 2.370 12850 LoBAL SDSS, Fig. 7 1516+4309 2.59 6000 LoBAL Benn et al. 2002
1624+3758 3.377 2990 Benn et al. 2005
account colour-dependent selection effects in BALs and non-BALs. Trump et al. (2006) found from a larger sample of SDSS DR3 QSOs at 1.7 ≤ z ≤ 4.38 a slightly lower BAL fraction, 10.4±0.2 per cent, with BI ≥ 5000 km s−1 for
162/1756 = 9 per cent of the BALs. For the comparison with our work and FBQS-2, the two last values should be regarded as upper limits, giving the low balnicity indices reached and the steeply rising distribution of BI towards low values (Reichard et al. 2003b). Taken together, the results from this work, Becker et al., Reichard et al. and Trump et al. suggest that the BAL fraction in radio-selected QSO samples is at least as high as that of optically-selected QSOs. A brief description of the seven BALs is given below:
• FIRST 0837+3641 shows Civand Siivtroughs
s−1 and sharp onset. The absorption bluewards of the
ex-pected Aliiiλ1860 emission line suggests that this QSO is
a low-ionization BAL (LoBAL).
• FIRST 1134+4318 shows Civand Siivtroughs
start-ing at the QSO redshift. The Civ absorption presents two
clearly distinct components. The weak absorption bluewards of the expected Aliiiemission line suggests that this QSO
could be a LoBAL.
• FIRST 1219+4849 shows C iv and Si iv troughs, the
former starting sharply at the emission redshift and extend-ing almost to the Si iv emission line. There is absorption
bluewards of the Aliiiemission line, so this is probably a
LoBAL, although some contamination by sky bands cannot be excluded.
• FIRST 1408+5553 shows C iv and Si iv troughs of
width∼5500 km s−1, starting at the emission redshift. • FIRST 1459+4931 shows Civand Si ivtroughs with
a sharp onset at the emission redshift. The Civabsorption
extends to the Si iv emission line and clearly shows two
components. The strong Aliiiabsorption confirms this QSO
as a LoBAL. We identify the emission line at 7000 ˚A as Feiii
UV 48 (rest frame wavelengths 2062.2, 2068.9 and 2079.65 ˚
A, see Laor et al. 1997).
• FIRST 1516+4309, with deep Civ and Si iv troughs
was firstly reported as a BAL in Benn et al. (2002). The absorption bluewards of the expected Al iii suggests that
this QSO is a LoBAL.
• FIRST 1624+3758 is an unusual BAL (Benn et al.
2005), with a clear detached C iv trough extending from −21000 to−29000 km s−1.
The fraction of LoBALs in our sample, four to five out of seven or 55-70 per cent, is unusually high. For comparison, the observed fractions obtained from the FBQS-2 and from the SDSS BALs in Reichard et al. (2003a) are 28±14 per cent (four out of fourteen) and 13±3 per cent (24/181, 1.7≤ z ≤3.9) respectively. The higher fraction in our sample is consistent with Becker et al. result that BALs in general and the LoBALs in particular are over-abundant among the reddest QSOs. Moreover, Reichard et al. (2003b) found that LoBALs have stronger CIV absorption troughs (i.e., stronger BI) than HiBALs, and the balnicity indices in our sample are in fact higher than the typical values in FBQS-2 and in Reichard et al.(2003a) SDSS sample.
4.5 The peculiar QSO FIRST 1413+4505
FIRST 1413+4505 (Fig. 2,z= 3.107) has an unusual spec-trum, with a broad strong absorption starting at the ex-pected position of the Lyαemission line and extending up to−18500 km s−1 bluewards. We identify the feature as H
ion the basis of the location of the line and the detection of
Lyβabsorption at this redshift. The broad absorption is not detected in metal lines. The Lyαabsorption feature has two components. The first one, at zabs= 3.06, has a rest-frame
EW∼38˚A and associated Lyβabsorption with EW∼5˚A. The second component, atzabs= 2.93, has EW∼7˚A and
the corresponding Lyβabsorption is difficult to identify due to the high noise in this part of the spectrum. The EW of the first Lyα absorber is consistent with a single damped Lyαsystem with high Hicolumn density, i.e.>1021cm−2
(Lanzetta et al. 1991), at the QSO position. However, the
Lyα/Lyβ ratio suggests an optically thin absorber, there-fore the system could be a velocity-resolved BAL-like wind. A higher resolution spectrum is needed to determine the nature of this absorption system.
The spectral energy distribution of the source can be obtained from NED. The FIRST integrated flux density at 1.4 GHz is 140.3±0.1 mJy, and the flux density at 4.85 GHz is 125 ±15 mJy (Becker, White & Edwards 1991). The source is unresolved in FIRST, < 1 arcsec. The SDSS magnitudes, corrected for Galactic extinction, are u = 22.32±0.23,g = 20.15±0.04,r = 19.27±0.02,
i= 19.09±0.02 and z = 19.09±0.05. The source is not detected in 2MASS and the magnitude limits for 99% com-pleteness are:J= 15.8,H = 15.1 andK= 14.3 (see 2MASS Web site‡). FIRST 1413+4505 is highly luminous in the ra-dio, P1.4 GHz = 2.2×1027 W Hz−1, and has a flat radio
spectral index,α=−0.09. From theE magnitude and us-ing the TNG spectrum for thek-correction we obtainedMAB
(1450 ˚A) =−25.7 (see equations in Vigotti et al. 2003). At the position of the QSO, mid-infrared emission is detected via 1D addition of IRAS Scans (SCANPI) at 12µm and 25µm. The automatic procedure obtained via NED gives an 11σ detection at 12µm in the addition modes ‘detec-tor weighted’ and ‘mean’, 15σdetection for ‘rms weighted’ and non-detection for the ‘median’ mode. The correspond-ing peak flux densities in Jy are 0.22±0.02, 0.21±0.02 and 0.31±0.02, respectively. At 25µm coaddition gives 3.6σ de-tection for ‘detector weighted’ and ‘mean’ modes, 5σfor ‘rms weighted’ and non-detection with the ‘median’ mode. The corresponding peak flux densities are 0.08±0.02, 0.08±0.02 and 0.11±0.02.
Mid-infrared detection atz≥2 is rare and we checked if the detection with SCANPI could arise due to confusion with one of the two bright stars 52 arcsec NE and 48 arcsec SW (binary) of the QSO, but neither of them was detected at 12µm or 25µm.
Assuming that the mid-infrared emission is physically associated with the QSO, and not a chance coincidence, the luminosity of the QSO in the rest frame wavelength range 2200 ˚A – 6.1 µm (from z-band to 25 µm in the observer frame) would be 1.8×10¹⁵L⊙, i.e. FIRST 1413+4505 would be one of the most luminous objects known. To our knowl-edge there are five other systems with such extreme lumi-nosities, and although they were discovered in different ways, and have different SEDs and absorption/emission-line prop-erties, the extreme luminosity was in all cases ascribed to flux magnification due to gravitational lensing. These ob-jects are the Seyfert 2 like object IRAS FSC 10214+4724 (Rowan-Robinson et al. 1991), the BAL QSO H1413+117 (Magain et al. 1988), the sub-mm galaxy SMM 02399-0136 (Ivison et al. 1998), the optically bright QSO APM 08279+5255 (Irwin et al. 1998) and the Lyman break galaxy MS 1512-cB58 (Yee et al. 1996).
4.6 Thez≥3.7 QSO sample
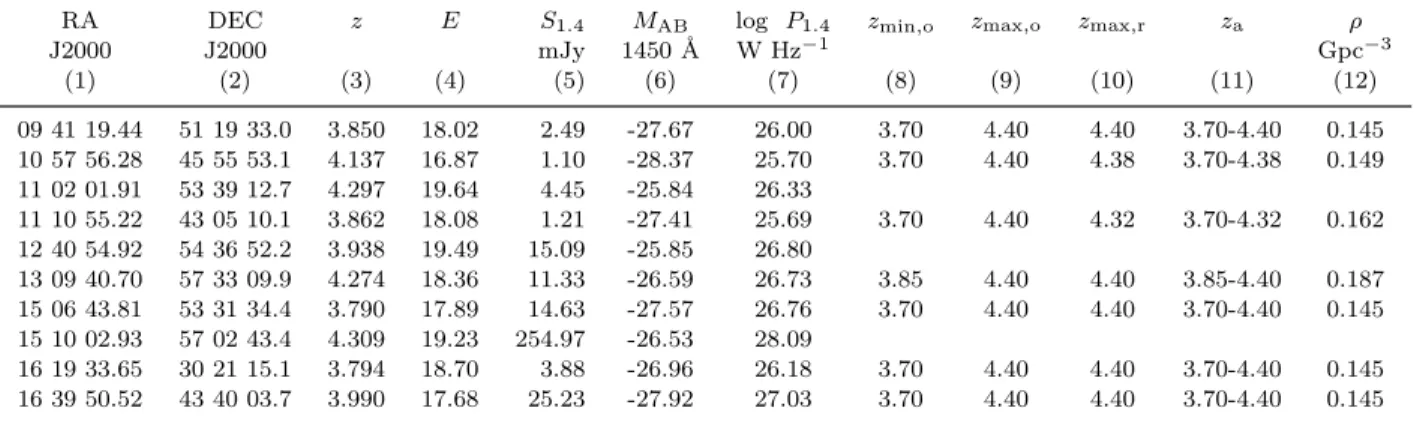
Fig. 5 suggests that no QSOs withz ≥3.7 will have been missed by the colour selection O−E > 2. The properties of the 10 z > 3.7 QSOs are given in Table 6. Adopting ‡ http://www.ipac.caltech.edu/2mass
Table 6.Absolute magnitudes, radio luminosities and contributions to space density, of thez≥3.7 QSOs
RA DEC z E S1.4 MAB log P1.4 zmin,o zmax,o zmax,r za ρ
J2000 J2000 mJy 1450 ˚A W Hz−1 Gpc−3 (1) (2) (3) (4) (5) (6) (7) (8) (9) (10) (11) (12) 09 41 19.44 51 19 33.0 3.850 18.02 2.49 -27.67 26.00 3.70 4.40 4.40 3.70-4.40 0.145 10 57 56.28 45 55 53.1 4.137 16.87 1.10 -28.37 25.70 3.70 4.40 4.38 3.70-4.38 0.149 11 02 01.91 53 39 12.7 4.297 19.64 4.45 -25.84 26.33 11 10 55.22 43 05 10.1 3.862 18.08 1.21 -27.41 25.69 3.70 4.40 4.32 3.70-4.32 0.162 12 40 54.92 54 36 52.2 3.938 19.49 15.09 -25.85 26.80 13 09 40.70 57 33 09.9 4.274 18.36 11.33 -26.59 26.73 3.85 4.40 4.40 3.85-4.40 0.187 15 06 43.81 53 31 34.4 3.790 17.89 14.63 -27.57 26.76 3.70 4.40 4.40 3.70-4.40 0.145 15 10 02.93 57 02 43.4 4.309 19.23 254.97 -26.53 28.09 16 19 33.65 30 21 15.1 3.794 18.70 3.88 -26.96 26.18 3.70 4.40 4.40 3.70-4.40 0.145 16 39 50.52 43 40 03.7 3.990 17.68 25.23 -27.92 27.03 3.70 4.40 4.40 3.70-4.40 0.145 Cols. (1, 2, 3, 4, 5): similar to cols. (1, 2, 11, 6, 4) in Table 2. (6): absolute magnitudeMABat rest-frame 1450 ˚A. (7): log
radio luminosity at rest-frame 1.4 GHz. (8, 9, 10, 11): redshift limits in the optical (zmin,o,zmax,o), radio (zmax,r), or both
(za), within the range 3.7≤z≤4.4. (12): contribution to the space density.
the magnitude limitE ≤19.1, leaves 7 QSOs in the range 3.7≤z≤4.4.
The absolute magnitudes at rest-frame 1450-˚A,
MAB(1450 ˚A), of the z ≥ 3.7 QSOs were calculated from
the extinction-correctedE magnitudes using the same pro-cedure as in Vigotti et al. (2003), except for a better estima-tion of thek-corrections, obtained here from the individual spectra rather than using an average. We used the optical spectra from this work (FIRST 1110+4305), Benn et al. 2002 (FIRST 0941+5119) or from SDSS (remaining QSOs).
Fig. 8a shows mAB[1450(1 +z)]−E, or k-correction,
for the redshift range 3.7 – 4.4, using the spectra of the 10 QSOs. Fig. 8b shows the mean and standard deviation of
mAB[1450(1 +z)]−Efor the seven QSOs withE≤19.1.
The radio luminosities at rest-frame frequency of 1.4 GHz were calculated assuming a spectral index α =−0.3 (Sν∝να), which is the median spectral index obtained for
13 z > 3.6 FIRST-APM QSOs in Holt et al. (2004). The radio luminosities range fromP1.4 GHz= 1025.7 to 1028.1 W
Hz−1, so all ten QSOs are ‘radio loud’ QSOs, adopting the
criterionP1.4 GHz>1025.5 W Hz−1 (Gregg et al. 1996).
4.6.1 Completeness of the z≥3.7, E≤19.1QSO
sub-sample
There are several sources of incompleteness, summarised be-low.
(1) Only 78 of the 94 candidates were spectroscopically classified, giving a fraction of 83 per cent.
(2) The APM completeness forE≤19.1 was estimated as the fraction of SDSSr≤19.8,z ≥2 QSOs in the SDSS DR3 Quasar Catalog (Schneider et al. 2005) detected and starlike in APME. The adoptedrband limit was obtained from the average magnitude difference r−E= 0.69 (stan-dard deviation 0.34) of the 10 high-z QSOs in the sample. Averager−Eand standard deviation for the 94 candidates are 0.55 and 0.36 respectively. From the 2060 DR3 QSOs in the surveyed area of this work, 2002 were detected in APM and 1793 of these were starlike, giving a fraction 87±2 per cent.
(3) The completeness of the FIRST catalogue for the range 1 – 1.5 mJy is∼70 per cent (Prandoni et al. 2001).
3.7 3.8 3.9 4 4.1 4.2 4.3 4.4 −0.5 0 0.5 1 1.5 m AB [1450(1+z)] − E 10 QSOs a redshift 3.7 3.8 3.9 4 4.1 4.2 4.3 4.4 −0.5 0 0.5 1 1.5 m AB [1450(1+z)] − E redshift 7 QSOs E < 19.1
mean and standard deviation b
Figure 8.(a)k-correction between the AB magnitude at 1450 (1 +z) ˚A and through theEband, versus redshift, obtained from the spectra of thez≥3.7 QSOs. Solid lines correspond to the 7 QSOs withE≤19.1. (b) Averagek-correction for these 7 QSOs (solid line) and standard deviation (dashed lines).
For the sample of seven QSOs, with radio flux densities: 1.1, 1.2, 2.5, 3.88, 11.33, 14.6 and 25.2 mJy, we estimate a completeness of 92±5 per cent, assuming Poisson errors.
(4),(5) In Vigotti et al. (2003) we found for a very sim-ilar sample completeness 98±1 per cent due to QSOs prob-ably missed because of extended radio emission, and 99 per cent completeness due to QSOs that may exceed the radio-optical separation limit of 1.5 arcsec.
(6) From our work and from the literature (see Figs. 5, 6 and Section 4.2) we estimate 100 per cent completeness for the colour cutO−E≥2 in the redshift range 3.7 – 4.4. (7) The completeness of the SDSS photometric survey quoted in the project web site, computed by comparing the
number of objects found by SDSS to the number found by the COMBO survey (Classifying Objects by Medium-Band Observations§), is 100 per cent for point sources with SDSS
r≤21, which is above the maximumr= 20.6 in our sample. The combined completeness due to the above seven fac-tors is 64±5 per cent.
5 QSO SPACE DENSITY AT HIGH-REDSHIFT
The observed space density of QSOs in the redshift range 3.7 ≤z ≤ 4.4, over the 1378.5 deg2 survey area, was cal-culated using the sub-sample of seven QSOs with E≤19.1 and the 1/Vaestimator (see e.g. Avni & Bahcall 1980). The
space density contributed by each QSO was computed as the inverse of the available volume, using the constraints
E≤19.1,S1.4 GHz≥1 mJy and 3.7≤z≤4.4. The redshift
limits and the space density contribution of each QSO are listed in Table 6. The sum of these contributions yields a space density (forMAB(1450)≤ −26.6) of 1.1±0.4 Gpc−3,
assuming Poisson errors. The mean redshift of the QSOs is 4.0, the mean absolute magnitudeMAB(1450) =−27.5 and
the mean log radio luminosity P1.4 GHz = 1026.3 W Hz−1.
Correcting for the 64±5 per cent completeness, the space density is 1.7±0.6 Gpc−3. Assuming the radio-loud
frac-tion 13.4±3 per cent for P1.4 GHz ≥1025.7 W Hz−1 from
Vigotti et al. (2003), the space density of all QSOs with 3.7≤z≤4.4 andMAB(1450)≤ −26.6 is 12.5±5.6 Gpc−3.
5.1 Comparison with other surveys at z≥3.7 In Vigotti et al. (2003) we computed ρ[MAB(1450) ≤ −26.9] = 7.4±2.6 Gpc−3, at 3.85 ≤ z ≤ 4.45, assuming
the same radio-loud fraction as above. The average redshift (4.2), optical luminosity (MAB(1450) =−27.7) and radio
lu-minosity (P1.4 GHz= 1026.6 W Hz−1) were all slightly larger
than for the current sample. Although the space density de-rived from the new sample has a larger statistical error, this work extends the computation of the space density to lower optical luminosities and benefits from betterk-corrections.
Four of the seven z ≥ 3.7 QSOs in the current work were also included in Vigotti et al. The MAB(1450) values
obtained in the two analyses agree within 0.15 magnitudes, except for FIRST 1309+5733, with MAB(1450) = −26.6
compared to−27.1 in Vigotti et al. The reason for the dis-crepancy is the highk-correction for this source (the highest amongE≤19.1 QSOs in Fig. 8).
Fan et al. (2001a,b) obtained the space density of QSOs at high redshift using an SDSS-selected sample of 39 QSOs with 3.6 ≤ z ≤ 5.0 and −27.75 ≤ MAB(1450) ≤ −25.5.
Seven of these QSOs have redshifts and absolute magnitudes within the range used here (z = 3.7 – 4.4, MAB ≤ −26.6)
and in this sense our sample, with seven radio loud QSOs, has comparable quality in terms of the number of objects.
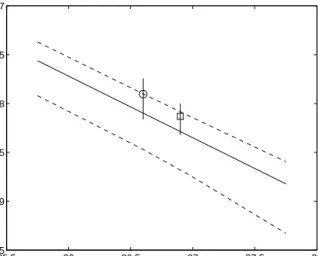
Fig. 9 shows the 1/Va estimators of the cumulative
lu-minosity function obtained in this work and in Vigotti et al., along with the maximum likelihood solution by Fan et al. Forz= 4.0 Fan et al. giveρ[MAB(1450)≤ −26.6] = 8.0±4.6
§ http://www.mpia-hd.mpg.de/COMBO −28 −27.5 −27 −26.5 −26 −25.5 −9.5 −9 −8.5 −8 −7.5 −7 M AB(1450) log ρ [ < M AB (1450) ] Mpc −3
Figure 9.Cumulative luminosity function derived from the 1/Va estimator in this work (circle, 3.7≤z ≤4.4) and in Vigotti et al. (square, 3.8 ≤ z ≤ 4.5). Solid and dashed lines: maximum likelihood solution and standard deviation from Fan et al. (3.6≤
z≤5.0).
Gpc−3, compared to 12.5±5.6 Gpc−3 in this work. These
two values are consistent, within the errors.
6 CONCLUSIONS
A sample of 94 radio-emitting QSO candidates has been de-rived by cross-correlating the FIRST survey, APM POSS-I and the SDSS photometric survey, selecting objects with
E ≤ 19.1, O−E ≥2, and starlike in SDSS. 78 of the 94 sources (83 per cent) are spectroscopically classified, mainly from SDSS, but also from the literature and from TNG spec-troscopy presented here (13 sources). The classified sources include 51 QSOs, with redshifts 0.27< z <4.31. Our main results are as follows:
(i) The efficiency of selection of high-redshift QSOs is 23/78 = 29 per cent for z ≥ 3, and 10/78 = 13 per cent for z ≥ 3.7, comparable to that for previous searches for high-redshift QSOs at muchhigherradio flux densities.
(ii) We found no 3.7< z <4.4 QSOs with 2< O−E <
3, supporting our assumption that no z > 3.7 QSOs are missed by selectingO−E≥2.
(iii) The BAL fraction for the QSOs with 2≤z ≤4.4 in our sample is ∼ 27±10 per cent (7/26), larger than found for FBQS-2 (Becker et al. 2000) and for the optically-selected SDSS samples in Reichard et al. (2003) and Trump et al. (2006), despite these three works being more complete for lower balnicity index. Our sample also has an unusually high fraction of LoBALs, four to five out of seven, compared to the above samples. The most likely explanation for the high frequency of BALs and LoBALs in our sample is the red colour selection,O−E≥2. A comparison of the three studies suggests that the BAL fraction in radio-selected QSO samples is at least as high as in optically-selected ones.
(iv) We note the unusual QSO FIRST 1413+4505 (z= 3.11), whose optical spectrum reveals a strong associated Lyα absorber (damped or BAL-like) that completely re-moves the Lyα emission. The source is highly luminous in
the radio, has a flat radio spectral index, and is detected in
IRAS 12 and 25 µm, yielding a bolometric luminosity in the range from SDSSz band to 25µmL∼1.8×10¹⁵L⊙, which places it amongst the most luminous objects known. (v) Using a sub-sample of seven QSOs with 3.7 ≤
z ≤ 4.4 and E ≤ 19.1, we derive a space density
of radio loud QSOs, ρ[MAB(1450) ≤ −26.6, P1.4 GHz ≥
1025.7(W Hz−1)] = 1.7±0.6 Gpc−3. Assuming a radio-loud
fraction 13.4±3 per cent, the space density for all QSOs is
ρ[MAB(1450) ≤ −26.6] = 12.5±5.6 Gpc−3. This result is
in good agreement with the best-fitting model in Fan et al. (2001a,b), considering the statistical errors.
REFERENCES
Abazajian K. et al. 2005, AJ, 129, 1755 Avni Y., Bahcall J.N., 1980, ApJ, 235, 694
Becker R.H., White R.L., Edwards A.L. 1991, ApJS, 75, 1 Becker R.H., White R.L., Helfand D.J. 1995, ApJ, 450, 559 Becker R.H., Gregg M.D., Hook I.M., McMahon R.G., White
R.L., Helfand D.J. 1997, ApJ, 479, L93
Becker R.H., White R.L., Gregg M.D., Brotherton M.S., Laurent-Muehleisen S.A., Arav N. 2000, ApJ, 538, 72
Benn C.R., Vigotti M., Pedani M., Holt J., Mack K.-H. Curran R., S´anchez S.F. 2002, MNRAS, 329, 221 (Paper I)
Benn C. R., Carballo R., Holt J., Vigotti M., Gonz´alez-Serrano J. I., Mack K.-H., Perley R. A. 2005, MNRAS, 360, 1455 Evans D.W. 1989, A&AS, 78, 249
Fan X. et al. 2001a, AJ, 121, 54 Fan X. et al. 2001b, AJ, 121, 31
Gregg M.D., Becker R.H., White R.L., Helfand D.J., McMahon R.G., Hook I.M. 1996, AJ, 112, 407
Holt J., Benn C.R., Vigotti M., Pedani M., Carballo R., Gonz´ alez-Serrano J.I., Mack K.-H., Garc´ıa B. 2004, MNRAS, 348, 857 (Paper II)
Hook I.M., Becker R.H., McMahon R.G., White R.L. 1998, MN-RAS, 297, 1115
Hook I.M., McMahon R.G., Shaver P.A., Snellen I.A.G. 2002, MNRAS, 297, 1115
Irwin M.J., Ibata R.A., Lewis G.F., Totten E.J. 1998, ApJ, 505, 529
Ivezic Z. et al. 2002, AJ, 124, 2364
Ivison R.J., Smail I., Le Borgne J.F., Blain A.W., Kneib J.P., BezzCourt J., Kerr T.H. 1998, MNRAS, 298, 583
Kleinmann S.G. et al. 1994, ApJS, 217, 11
Kopylov A. I., Artyukh V. S., Kopylova F. G. 2004, A&A, 421, 455
Lanzetta K.M., Wolfe A.M., Turnshek L.L., McMahon R.G., Haz-ard C. 1991, ApJS, 77,1
Laor A., Jannuzi B.T., Green R.F., Boroson T.A. 1997, ApJ, 489, 656
Magain P., Surdej J., Swings J.P., Borgeest U., Kayser R. 1988, Nature, 334, 325
McMahon R.G., Irwin M.J. 1992, in MacGillivray H.T., Thomson E.B., eds, Digitised Optical Sky Surveys. Dordrecht:Kluwer, p. 417
McMahon R.G., White R.L., Helfand D.J., Becker R.H. 2002, ApJS, 143, 1
Najita J., Dey A., Brotherton M. 2000, AJ, 120, 2859
Pennington R.L., Humphreys R.M., Odewahn S.D., Zumach W., Thurmes P.M. 1993, PASP, 105, 521
Peroux C., Storrie-Lombardi L. J., McMahon R. G., Irwin M., Hook I. M. 2001, AJ, 121, 1799
Prandroni I., Gregorini L., Parma P., de Ruiter H.R., Vettolani G, Wieringa M.H., Ekers R.D. 2001, A&A, 365, 392 Reichard T.A. et al. 2003a, AJ, 126, 2594
Reichard T.A. et al. 2003b, AJ, 125, 1711 Rowan-Robinson M. et al. 1991, Nature, 351, 719 Schlegel D.J., Finkbeiner D.P., Davis M. 1998, ApJ, Schneider D.P. et al, 2005, AJ, 130, 367
Snellen I.A.G., McMahon R.G., Dennett-Thorpe J., Jackson N., Mack K.-H., Xanthopoulos E. 2001, MNRAS, 325, 1167 Storrie-Lombardi L.J., McMahon R.G., Irwin M.J., Hazard C.
1996, ApJ, 468, 121
Stoughton C. et al. 2002, AJ, 123, 485 Vanden Berk D.E. et al. 2001, AJ, 122, 549
Vigotti M., Carballo R., Benn C.R., de Zotti G., Fanti R., Gonz´alez-Serrano J.I., Mack K.-H., Holt J. 2003, ApJ, 591, 43
Trump J.R. et al. 2006, ApJS, in press (astro-ph 0603070) Weymann R.J., Morris S.L., Foltz C.B., Hewett P.C. 1991, ApJ,
373, 23
White R.L., Becker R.H., Helfand D.J., Gregg, M.D. 1997, ApJ, 475, 479
White R.L. et al. 2000, ApJS, 126, 133
Yee H.K. C., Ellingston E., Bechtold J., Carlberg R.G. Cillandre J.C. 1996, AJ, 111, 1883
ACKNOWLEDGMENTS
We thank the referee for rapid and helpful feedback. RC, JIGS, CRB, and MV acknowledge financial support from the Spanish Ministerio de Educaci´on y Ciencia under project AYA 2002-03326.
This research is in part based on observations made with the Italian Telescopio Nazionale Galileo (TNG) oper-ated on the island of La Palma by the Fundaci´on Galileo Galilei of the INAF (Istituto Nazionale di Astrofisica) at the Spanish Observatorio del Roque de los Muchachos of the In-stituto de Astrofisica de Canarias. Funding for the creation and distribution of the SDSS Archive has been provided by the Alfred P. Sloan Foundation, the Participating Institu-tions, the National Aeronautics and Space Administration, the National Science Foundation, the U.S. Department of Energy, the Japanese Monbukagakusho, and the Max Planck Society. The SDSS Web site is http://www.sdss.org/. The SDSS is managed by the Astrophysical Research Consor-tium (ARC) for the Participating Institutions. The Partici-pating Institutions are The University of Chicago, Fermilab, the Institute for Advanced Study, the Japan Participation Group, The Johns Hopkins University, the Korean Scientist Group, Los Alamos National Laboratory, the Max-Planck-Institute for Astronomy (MPIA), the Max-Planck-Max-Planck-Institute for Astrophysics (MPA), New Mexico State University, Uni-versity of Pittsburgh, UniUni-versity of Portsmouth, Princeton University, the United States Naval Observatory, and the University of Washington. This research has made use of the NASA/IPAC Extragalactic Database (NED) which is oper-ated by the Jet Propulsion Laboratory, California Institute of Technology, under contract with the National Aeronautics and Space Administration. The 2MASS project is a collab-oration between The University of Massachusetts and the Infrared Processing and Analysis Center (JPL/ Caltech). Funding is provided primarily by NASA and the NSF. The University of Massachusetts constructed and maintained the observatory facilities, and operated the survey.
RA DEC FIRST-SDSS S1.4 E(B−V) E O−E Spectroscopic classification Notes
J2000 J2000 arcsec mJy SDSS Other Class z
(1) (2) (3) (4) (5) (6) (7) (8) (9) (10) (11) (12) 08 08 44.47 44 03 57.9 0.35 2.01 0.044 18.79 >3.18 08 18 45.67 30 31 25.4 0.36 4.44 0.039 19.00 1.92 DR3 QSO 0.509 08 20 50.19 42 19 01.9 0.68 4.34 0.054 15.42 2.40 DR3 late-type star 08 37 49.60 36 41 45.5 0.14 27.10 0.039 18.65 2.75 DR3 QSO 3.416 08 45 47.02 49 03 39.5 1.47 1.47 0.030 17.27 2.40 DR3 late-type star 08 49 32.51 39 33 45.8 0.98 1.43 0.028 17.02 2.49 DR3 late-type star 08 53 09.18 47 54 44.4 0.98 12.14 0.024 17.08 1.92 This work late-type star 08 53 37.88 42 54 28.1 1.37 1.92 0.030 18.95 >2.29 DR3 late-type star 09 00 00.29 40 46 04.8 0.22 4.20 0.023 19.51 1.40 DR3 QSO 3.539 09 16 52.79 39 27 14.7 0.48 2.73 0.013 18.25 1.93 DR3 QSO 0.269 a 09 40 03.02 51 16 02.7 0.16 13.91 0.011 18.47 2.11 DR3 QSO 3.601 09 41 19.44 51 19 33.0 0.56 2.49 0.009 18.02 >3.69 Paper I QSO 3.85 09 43 10.67 42 30 16.7 0.49 1.79 0.012 19.02 2.03 DR3 QSO 0.737 09 55 55.13 50 05 44.8 0.54 24.54 0.011 17.69 2.36 09 56 55.77 52 57 11.7 0.85 1.47 0.011 18.40 3.10 DR3 late-type star 10 07 48.74 54 12 52.1 1.25 1.07 0.008 18.26 3.07 DR3 late-type star 10 08 02.07 42 18 39.3 0.24 1.42 0.017 19.35 1.69 DR3 QSO 1.872 10 11 10.75 42 39 37.1 0.25 55.45 0.019 18.54 2.10 DR3 Literature QSO 3.560 10 34 01.84 50 07 46.5 0.20 3.35 0.014 17.09 2.41 DR3 early-type star 10 39 02.18 49 31 39.1 0.30 1.50 0.012 19.48 1.79 QSO 1.09 b 10 39 15.68 47 05 41.1 0.73 395.44 0.015 19.51 1.63 Literature QSO 2.36 c 10 46 57.16 48 27 23.8 0.11 37.54 0.015 18.62 2.01 DR3 QSO 1.287 10 48 06.18 56 30 21.4 0.96 1.20 0.005 19.57 >2.30 DR3 QSO 1.905 10 49 50.48 52 08 42.6 0.69 1.92 0.011 14.19 2.12 10 57 56.28 45 55 53.1 0.44 1.10 0.012 16.87 3.77 DR4 Literature QSO 4.137 11 02 01.91 53 39 12.7 0.35 4.45 0.009 19.64 >2.09 DR3 QSO 4.297 11 04 43.43 50 30 57.5 0.40 1.75 0.014 18.19 3.01
11 10 55.22 43 05 10.1 0.39 1.21 0.014 18.08 3.66 DR4 This work QSO 3.862 11 24 36.15 47 02 20.5 0.30 3.38 0.020 18.72 2.82
11 29 07.10 57 56 05.4 0.57 2.39 0.015 17.32 3.15 DR3 ELG 0.312 d 11 29 56.16 51 33 46.5 0.40 3.21 0.013 18.94 1.98 DR3 QSO 2.955
11 30 43.08 51 41 33.9 0.68 4.01 0.015 17.66 3.12 DR3 Paper I late-type star 11 32 56.63 43 54 27.7 1.25 1.29 0.023 19.58 >1.97
11 34 45.83 43 18 58.0 0.14 28.00 0.023 18.69 2.14 DR4 QSO 2.184 11 35 51.30 42 45 18.1 0.20 1.82 0.026 19.41 1.97 DR4 QSO 0.387 11 36 27.96 56 43 41.8 0.63 123.34 0.015 18.68 2.39 DR4 QSO 0.88
J2000 J2000 arcsec mJy SDSS Other Class z (1) (2) (3) (4) (5) (6) (7) (8) (9) (10) (11) (12) 11 37 27.31 47 33 41.5 0.82 1.34 0.022 19.84 >2.22 11 40 34.95 44 23 38.9 0.09 3.47 0.025 18.10 2.30 11 47 49.80 49 28 07.0 0.26 68.81 0.016 19.82 2.31 11 53 13.06 56 51 26.3 0.39 27.86 0.017 19.06 2.49 DR3 QSO 1.201 12 10 21.46 46 36 01.9 1.40 1.05 0.015 19.91 >2.38
12 19 57.18 48 49 27.0 0.41 6.92 0.015 19.69 >2.86 This work QSO 3.201 12 20 42.41 48 09 06.9 0.42 2.06 0.014 17.82 3.21 DR3 late-type star
12 27 03.19 50 53 56.3 0.20 3.87 0.016 18.49 2.32 DR3 QSO 0.765
12 31 38.14 57 53 42.8 0.88 1.96 0.012 16.42 2.89 DR3 late-type star d 12 34 27.25 45 19 55.6 0.37 2.07 0.012 20.18 2.06 DR4 This work QSO 3.466
12 40 54.92 54 36 52.2 0.14 15.09 0.023 19.74 >1.85 DR3 QSO 3.938 12 47 10.29 55 55 57.4 1.20 10.25 0.012 19.58 1.57 DR3 QSO 0.498 13 08 01.18 53 07 51.3 0.19 8.89 0.016 18.08 2.70 DR3 QSO 0.322 13 09 40.70 57 33 09.9 0.08 11.33 0.016 19.49 >3.35 DR3 Paper I QSO 4.274 13 10 03.35 53 53 48.3 0.11 14.45 0.020 19.34 2.11 DR3 QSO 3.278 13 13 30.11 51 46 41.4 0.64 1.60 0.013 18.96 3.32 13 19 43.44 44 03 50.2 0.03 1.13 0.015 20.22 >1.90 13 23 30.44 54 59 55.6 0.21 5.22 0.022 18.76 3.22 DR3 QSO 2.208 e 13 29 28.23 50 54 34.1 1.23 2.95 0.011 18.52 2.74 13 34 01.81 55 27 33.0 0.40 1.51 0.010 18.13 2.86 DR3 late-type star 13 42 36.96 43 26 32.1 0.09 26.87 0.013 19.06 2.35 DR3 QSO 1.044 13 43 11.80 43 05 34.8 0.02 53.21 0.013 20.59 2.11 This work QSO 0.897 13 53 06.01 55 08 35.2 0.87 1.91 0.009 19.41 2.04 DR3 early-type star 13 58 29.83 42 39 55.3 1.18 1.52 0.008 15.60 2.64 This work late-type star
14 01 22.22 44 01 57.2 0.68 1.02 0.009 19.43 1.96 DR4 QSO 1.238 14 05 51.56 51 55 17.9 0.22 1.34 0.017 19.45 2.17 This work ELG 0.2705 14 08 15.25 55 53 46.5 0.23 3.41 0.015 19.29 >3.08 DR3 QSO 2.446
14 13 18.87 45 05 23.0 0.11 140.31 0.007 19.27 1.67 DR4 This work QSO 3.107 f 14 20 13.66 50 48 55.6 0.55 2.69 0.018 19.64 >2.31
14 20 33.71 57 39 01.0 0.12 4.28 0.011 18.58 2.72 DR3 QSO 0.736 d 14 22 43.02 44 17 21.5 0.09 1.25 0.008 18.14 2.59 DR4 This work QSO 3.564
14 31 41.08 51 56 42.5 0.33 1.49 0.011 19.67 2.16
14 36 06.62 47 25 32.0 0.07 207.70 0.022 18.73 2.35 This work QSO 0.943 14 40 10.73 50 55 56.0 0.71 2.05 0.013 19.75 >2.42 DR3 late-type star
14 55 25.95 48 57 01.6 0.25 8.25 0.022 19.39 1.86 DR3 QSO 3.492 14 59 26.33 49 31 36.9 0.09 5.22 0.019 18.71 1.69 DR3 QSO 2.370
RA DEC FIRST-SDSS S1.4 E(B−V) E O−E Spectroscopic classification Notes
J2000 J2000 arcsec mJy SDSS Other Class z
(1) (2) (3) (4) (5) (6) (7) (8) (9) (10) (11) (12)
15 02 26.89 48 37 11.5 0.29 34.26 0.020 18.24 1.97 DR3 Literature QSO 3.209 15 02 59.54 45 12 55.1 0.52 5.21 0.023 18.43 2.31 This work late-type star 15 06 43.81 53 31 34.4 0.46 14.63 0.015 17.89 3.06 DR3 QSO 3.79 15 09 39.01 43 46 48.8 0.53 1.02 0.015 18.47 >3.20 DR4 late-type star e 15 10 02.93 57 02 43.4 0.34 254.97 0.012 19.23 >2.04 DR3 Literature QSO 4.309 15 16 01.52 43 09 31.5 0.63 1.34 0.027 18.50 >3.11 DR3 Paper I QSO 2.59 e 15 39 38.48 55 10 33.4 1.38 4.20 0.014 19.15 >2.91 DR3 late-type star 15 46 17.71 40 00 35.6 1.03 2.41 0.015 18.38 2.63 DR4 late-type star e 15 48 43.10 39 14 58.4 1.25 2.59 0.010 18.45 2.91 DR4 late-type star e 15 50 59.05 37 07 22.5 0.43 6.07 0.021 17.40 2.14 DR4 QSO 0.588 e,g 15 56 33.78 35 17 57.4 0.29 31.72 0.023 19.07 2.14 DR4 Literature QSO 1.501 e 16 06 28.19 32 27 10.7 0.64 25.99 0.032 17.85 2.82 DR4 late-type star e 16 10 07.07 39 41 32.8 0.44 1.13 0.009 18.61 2.37 DR3 late-type star 16 11 50.68 43 44 12.8 0.24 1.20 0.012 17.97 3.02 DR3 late-type star 16 17 23.13 32 28 18.3 0.27 1.43 0.022 17.97 2.57 g 16 19 33.65 30 21 15.1 0.36 3.88 0.028 18.70 >3.18 DR4 QSO 3.794 e 16 21 11.28 37 46 04.9 0.17 643.09 0.013 18.85 2.38 DR3 QSO 1.273 16 24 53.48 37 58 06.6 0.10 56.44 0.011 18.47 2.03 DR3 Paper II QSO 3.377 16 33 17.71 42 51 08.4 0.14 1.45 0.008 19.18 1.65 This work QSO 3.130 16 35 35.35 35 24 17.2 0.43 5.18 0.026 18.50 2.76 DR3 Paper I late-type star 16 36 34.46 31 58 54.2 1.16 1.63 0.023 16.80 2.40 This work late-type star 16 39 50.52 43 40 03.7 0.37 25.23 0.012 17.68 3.55 DR3 Paper I QSO 3.99
Cols. (1,2): SDSS coordinates. (3): radio-optical (FIRST-SDSS) separation. (4): FIRST 1.4 GHz flux density (integrated forS1.4 GHz >10 mJy, otherwise peak, see fig. 4 in Ivezic et al. 2002). (5): E(B−V) Galactic extinction (Schlegel, Finkbeiner & Davis 1998). (6,7):E magnitude andO−E colour taken from McMahon et al. (2002) FIRST-optical identification catalogue (APM magnitudes recalibrated with respect to APS, for more accurate photometry), and corrected for Galactic reddening assuming A(E) = 2.7E(B−V) andA(O) = 4.4E(B−V) (see White et al. 2000); (8,9,10,11): source of spectrum, spectroscopic classification, and redshift. The references from the literature are as follows: FIRST 1011+4239 and FIRST 1502+4837, Snellen et al. 2001; FIRST 1039+4705, Kopylov, Artyukh & Kopylova 2004; FIRST 1057+4555, Peroux et al. 2001; FIRST 1510+5702, Storrie-Lombardi et al. 1996; and FIRST 1556+3517, Najita, Dey & Brotherton 2000. (12): Notes as follows: a = Not a QSO in the “DR3 Quasar Catalog”, probably because it doesn’t meet the requirementMi >−22 (H◦ = 70 km s−1 Mpc−1, ΩM = 0.3, and ΩΛ = 0.7), b = Classified in this work from the presence of CIII] and MgIIemission lines in the SDSS DR3 spectrum, c = Spectrum not published, d = The source is not included in McMahon et al. (2002), therefore the
APM calibration was adopted, e = spectrum not available on the SDSS website, f = See Section 4.5, g = Classified as a galaxy in 2MASS (The Two Micron All Sky Survey, Kleinmann et al. 1994)