Main Library Strickhofstrasse 39 CH-8057 Zurich www.zora.uzh.ch
Year: 2018
A systematic performance evaluation of clustering methods for single-cell
RNA-seq data
Duò, Angelo ; Robinson, Mark D ; Soneson, Charlotte
Abstract: Subpopulation identification, usually via some form of unsupervised clustering, is a fundamen-tal step in the analysis of many single-cell RNA-seq data sets. This has motivated the development and application of a broad range of clustering methods, based on various underlying algorithms. Here, we provide a systematic and extensible performance evaluation of 14 clustering algorithms implemented in R, including both methods developed explicitly for scRNA-seq data and more general-purpose methods. The methods were evaluated using nine publicly available scRNA-seq data sets as well as three simula-tions with varying degree of cluster separability. The same feature selection approaches were used for all methods, allowing us to focus on the investigation of the performance of the clustering algorithms themselves. We evaluated the ability of recovering known subpopulations, the stability and the run time and scalability of the methods. Additionally, we investigated whether the performance could be improved by generating consensus partitions from multiple individual clustering methods. We found substantial differences in the performance, run time and stability between the methods, with SC3 and Seurat showing the most favorable results. Additionally, we found that consensus clustering typically did not improve the performance compared to the best of the combined methods, but that several of the top-performing meth-ods already perform some type of consensus clustering. All the code used for the evaluation is available on GitHub ( https://github.com/markrobinsonuzh/scRNAseq_clustering_comparison). In addition, an R package providing access to data and clustering results, thereby facilitating inclusion of new methods and data sets, is available from Bioconductor ( https://bioconductor.org/packages/DuoClustering2018). DOI: https://doi.org/10.12688/f1000research.15666.2
Posted at the Zurich Open Repository and Archive, University of Zurich ZORA URL: https://doi.org/10.5167/uzh-182440
Journal Article Published Version
The following work is licensed under a Creative Commons: Attribution 4.0 International (CC BY 4.0) License.
Originally published at:
Duò, Angelo; Robinson, Mark D; Soneson, Charlotte (2018). A systematic performance evaluation of clustering methods for single-cell RNA-seq data. F1000Research, 7:1141.
Open Peer Review
Discuss this article
(0)
Comments
RESEARCH ARTICLE
A systematic performance evaluation of clustering
methods for single-cell RNA-seq data [version 2; referees: 2
approved]
Angelo Duò ,
Mark D. Robinson
, Charlotte Soneson
1,2
Institute of Molecular Life Sciences, University of Zurich, Zurich, 8057, Switzerland SIB Swiss Institute of Bioinformatics, Zurich, 8057, Switzerland Abstract Subpopulation identification, usually via some form of unsupervised clustering, is a fundamental step in the analysis of many single-cell RNA-seq data sets. This has motivated the development and application of a broad range of clustering methods, based on various underlying algorithms. Here, we provide a systematic and extensible performance evaluation of 14 clustering algorithms implemented in R, including both methods developed explicitly for scRNA-seq data and more general-purpose methods. The methods were evaluated using nine publicly available scRNA-seq data sets as well as three simulations with varying degree of cluster separability. The same feature selection approaches were used for all methods, allowing us to focus on the investigation of the performance of the clustering algorithms themselves. We evaluated the ability of recovering known subpopulations, the stability and the run time and scalability of the methods. Additionally, we investigated whether the performance could be improved by generating consensus partitions from multiple individual clustering methods. We found substantial differences in the performance, run time and stability between the methods, with SC3 and Seurat showing the most favorable results. Additionally, we found that consensus clustering typically did not improve the performance compared to the best of the combined methods, but that several of the top-performing methods already perform some type of consensus clustering. All the code used for the evaluation is available on GitHub ( ). In https://github.com/markrobinsonuzh/scRNAseq_clustering_comparison addition, an R package providing access to data and clustering results, thereby facilitating inclusion of new methods and data sets, is available from Bioconductor (https://bioconductor.org/packages/DuoClustering2018). Keywords Clustering, Single-cell RNA-seq, RNA-seq, Benchmarking, Clustering methods
This article is included in the
gateway.
Bioconductor
1,2
1,2
1,2
1 2 Referee Status: Invited Referees version 2 published 10 Sep 2018 version 1 published 26 Jul 2018 1 2 report report report report , Harvard Medical School, Jean Fan USA Harvard University, USA 1 , University of Saskia Freytag Melbourne, Australia 2 26 Jul 2018, :1141 (doi: )First published: 7 10.12688/f1000research.15666.1
10 Sep 2018, :1141 (doi: )
Latest published: 7 10.12688/f1000research.15666.2
Charlotte Soneson ( )
Corresponding author: [email protected]
: Data Curation, Formal Analysis, Investigation, Methodology, Software, Visualization, Writing – Original Draft Preparation,
Author roles: Duò A
Writing – Review & Editing; Robinson MD: Conceptualization, Data Curation, Formal Analysis, Funding Acquisition, Investigation, Methodology, Resources, Writing – Original Draft Preparation, Writing – Review & Editing; Soneson C: Conceptualization, Data Curation, Formal Analysis, Investigation, Methodology, Software, Visualization, Writing – Original Draft Preparation, Writing – Review & Editing No competing interests were disclosed. Competing interests: We acknowledge funding support from the Swiss National Science Foundation (Grant Number 310030_175841 to MDR) and Grant information: the Chan Zuckerberg Initiative (Grant Number 182828 to MDR).
The funders had no role in study design, data collection and analysis, decision to publish, or preparation of the manuscript.
© 2018 Duò A . This is an open access article distributed under the terms of the , which
Copyright: et al Creative Commons Attribution Licence
permits unrestricted use, distribution, and reproduction in any medium, provided the original work is properly cited. Duò A, Robinson MD and Soneson C.
How to cite this article: A systematic performance evaluation of clustering methods for single-cell
2018, :1141 (doi: )
RNA-seq data [version 2; referees: 2 approved]F1000Research 7 10.12688/f1000research.15666.2
26 Jul 2018, :1141 (doi: )
Amendments from Version 1 We thank the reviewers for their constructive comments. In response, we have made the following modifications to the manuscript:
- Clarified the rationale for including the selected data sets and methods
- Included two additional clustering methods; RaceID2 and monocle
- Exchanged the Venn diagrams in Supplementary Figure 2 for UpSet plots
- Investigated the scalability of each method by subsampling of the largest data set
- Clarified the use of random seeds by the different methods - Increased the size of Figure 5B
In addition, the text has been clarified in several places. Detailed responses to all points raised by the reviewers are available below.
To provide easy access to the data and clustering results from our study, and thereby simplify inclusion of additional clustering methods and data sets in the comparison, we now provide an R package (available from https://bioconductor.org/packages/ DuoClustering2018 and leveraging the ExperimentHub framework from Bioconductor) including accessor functions to retrieve all necessary data and result objects, as well as plotting functions to generate various types of plots illustrating the performance of the methods.
See referee reports
REVISED
Introduction
Recent advances in single-cell RNA-seq (scRNA-seq) technolo-gies have enabled the simultaneous measurement of expression levels of thousands of genes across hundreds to thousands of individual cells1–8. This opens up new possibilities for
decon-volution of expression patterns seen in bulk samples, detection of previously unknown cell populations and deeper charac-terization of known ones. However, computational analyses are complicated by the high variability, low capture efficiency and high dropout rates of scRNA-seq assays9–11, as well as by strong
batch effects that are often confounded by the experimental factor of interest12.
Given a collection of single cells, a common analysis task involves identification and characterization of subpopula-tions, e.g., cell types or cell states. With lower-dimensional single-cell assays such as flow cytometry, cell type detec-tion is often done manually, by visual inspecdetec-tion of a series of two-dimensional scatter plots of marker pairs (“gating”) and subsequent identification of clusters of cells with specific abundance patterns. With large numbers of markers, such strategies quickly become unfeasible, and they are also likely to miss previously uncharacterized cell populations. Instead, subpopulation detection in higher-dimensional single-cell experiments such as mass cytometry (CyTOF) and scRNA-seq is often done automatically, via some form of clustering. As a consequence, a large number of clustering approaches specifically designed for or adapted to these types of assays are available in the literature13.
While extensive evaluations of clustering methods have been performed for flow and mass cytometry data14,15, there are to date
fewer such studies available for scRNA-seq. The latter is complicated by the large number of different data generation protocols available for scRNA-seq, which in turn has a big effect on the data characteristics. Menon16 specifically evaluated
three methods (Seurat17, WGCNA18 and BackSPIN19),
illus-trating their different behavior in low and high read depth data. A recent paper20 compared 12 clustering tools on scRNA-seq
data sets from the 10x Genomics platform, showing that differ-ent methods generally produced clusterings with little overlap. An overview of several different types of clustering algorithms for scRNA-seq data is given by Andrews and Hemberg21.
Here, we extend these initial studies to a broader range of data sets with different characteristics and additionally consider simulated data with different degrees of cluster separability. We evaluate 14 clustering algorithms, including both methods specifically developed for scRNA-seq data, methods developed for other types of single-cell data, and more general approaches, on a total of 12 different data sets. In order to focus on the performance of the clustering algorithms themselves, we use the same preprocessing approach (specifically cell and gene filtering) for all methods, and investigate the impact of the preprocessing separately. In addition to investigating how well the clustering methods are able to recover the true partition if the number of subpopulations is known, we evaluate whether they are able to correctly determine the number of clusters. Further, we study the stability and run time of the methods and investigate whether performance can be improved by generating a consensus partition based on results from multiple individual clustering methods, and the impact of the choice of methods to include in such an aggregation.
We observed large differences in the clustering results as well as in the run times of the different methods. SC3 and Seurat generally performed favorably, with Seurat being several orders of magnitude faster. In addition, Seurat typically achieved the best agreement with the true partition when the number of clusters was the same, while other methods, like FlowSOM, achieved a better agreement with the truth if the number of clusters was higher than the true number. Finally, we show that generally, combining two methods into an ensemble did not improve the performance compared to the best of the individual methods.
Given the high level of activity in methods research for pre-processing, clustering and visualization of scRNA-seq data, it is expected that many new algorithms (or new flavors of existing ones) will be proposed. In order to facilitate re-assessment as new innovations emerge and to provide extensibility to new methods and data sets, all (filtered and unfiltered) data sets as well as all clustering results are accessible via an R/Bioconductor package, leveraging the Bioconductor ExperimentHub framework (https:// bioconductor.org/packages/DuoClustering2018). In addition, the complete code used to run all analyses is available on https:// github.com/markrobinsonuzh/scRNAseq_clustering_compari-son. The current system uses a Makefile to run a set of R scripts for clustering, summarization and visualization of the results.
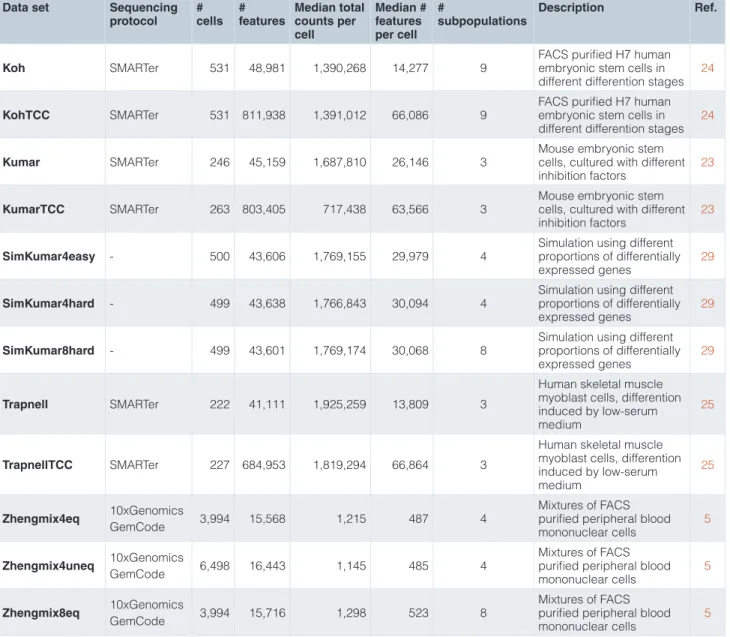
Table 1. Overview of the data sets used in the study. Data set Sequencing
protocol # cells # features Median total counts per cell Median # features per cell # subpopulations Description Ref. Koh SMARTer 531 48,981 1,390,268 14,277 9
FACS purified H7 human embryonic stem cells in different differention stages
24
KohTCC SMARTer 531 811,938 1,391,012 66,086 9
FACS purified H7 human embryonic stem cells in different differention stages
24
Kumar SMARTer 246 45,159 1,687,810 26,146 3
Mouse embryonic stem cells, cultured with different inhibition factors
23
KumarTCC SMARTer 263 803,405 717,438 63,566 3
Mouse embryonic stem cells, cultured with different inhibition factors
23
SimKumar4easy - 500 43,606 1,769,155 29,979 4
Simulation using different proportions of differentially expressed genes
29
SimKumar4hard - 499 43,638 1,766,843 30,094 4
Simulation using different proportions of differentially expressed genes
29
SimKumar8hard - 499 43,601 1,769,174 30,068 8
Simulation using different proportions of differentially expressed genes
29
Trapnell SMARTer 222 41,111 1,925,259 13,809 3
Human skeletal muscle myoblast cells, differention induced by low-serum medium
25
TrapnellTCC SMARTer 227 684,953 1,819,294 66,864 3
Human skeletal muscle myoblast cells, differention induced by low-serum medium 25 Zhengmix4eq 10xGenomics GemCode 3,994 15,568 1,215 487 4 Mixtures of FACS purified peripheral blood mononuclear cells
5
Zhengmix4uneq 10xGenomics
GemCode 6,498 16,443 1,145 485 4
Mixtures of FACS purified peripheral blood mononuclear cells
5
Zhengmix8eq 10xGenomics
GemCode 3,994 15,716 1,298 523 8
Mixtures of FACS purified peripheral blood mononuclear cells
5
Methods Real data sets
Three real scRNA-seq data sets were downloaded from conquer22 and used for our evaluations: GSE60749-GPL13112
(here denoted Kumar23), SRP073808 (Koh24) and
GSE52529-GPL16791 (Trapnell25). These data sets were chosen to
represent different degrees of “difficulty” in the clustering task. In particular, the Trapnell data set was not generated with the aim of detecting subpopulations, but rather to investigate a continu-ous developmental trajectory. Nevertheless, it was included in our evaluation as an example of a data set where the phenotype designated as the “true” cluster labels (see below) may not represent the strongest signal present in the data. Table 1 and
Supplementary Figure 1 give an overview of all data sets used in this study. For each of the data sets from conquer, the gene-level length-scaled TPM values (below referred to as “counts” since
they are on the same scale as the raw read counts) and the phenotype were extracted from the MultiAssayExperiment26
object provided by conquer and used to create a SingleCellEx-periment object. We also estimated transcript compatibility counts (TCCs) for each of these data sets using kallisto27,28
v0.44, and used these as an alternative to the gene-level count matrix as input to the clustering algorithms.
The selected cell phenotype was used to define the “true” partition of cells when evaluating the clustering methods. For the Kumar data set, we grouped the cells by the genetic perturbation and the medium in which they were grown. For the Trapnell data set we used the time point (after the switch of growth medium) at which the cells were captured, and for the Koh data set we used the cell type annotated by the data collectors (obtained through FACS sorting). We note that the definition of the ground
truth constitutes an intrinsic difficulty in the evaluation of clustering methods, since it is plausible that there are several different, but still biologically interpretable, ways of partitioning cells in a given data set, several of which can represent equally strong signals. Many public droplet-based data sets contain cell type labels, but these are typically inferred by clustering the cells using the scRNA-seq data, and thus any evaluation based on these labels risks being biased in favor of methods similar to the one used to derive the labels in the first place. By using ground truths that are defined independently of the scRNA-seq assay, we thus avoid artificial inflation of the signal that could result if the truth was derived from the scRNA-seq data itself.
In addition to the data sets from conquer, we obtained UMI counts from the Zheng data set5, generated by the 10x Genomics
GemCode protocol, from https://support.10xgenomics.com/ single-cell-gene-expression/datasets. We downloaded counts for eight pre-sorted cell types (B-cells, naive cytotoxic T-cells, CD14 monocytes, regulatory T-cells, CD56 NK cells, memory T-cells, CD4 T-helper cells and naive T-cells) and combined them into three data sets, with a mix of well-separated (e.g., B-cells vs T-cells) and similar cell types (e.g., different types of T-cells) and uniform and non-uniform cluster sizes. For the data set denoted Zhengmix4eq, we combined randomly selected B-cells, CD14 monocytes, naive cytotoxic T-cells and regulatory T-cells in equal proportions (1,000 cells per subpopulation). For the Zhengmix4uneq data set, we combined the same four cell types, but in unequal proportions (1,000 B-cells, 500 naive cytotoxic T-cells, 2,000 CD14 monocytes and 3,000 regulatory T-cells). For the Zhengmix8eq data set, we combined cells from all eight populations, in approximately equal proportions (400–600 cells per population). For these data sets, we used the annotated cell type (obtained by pre-sorting of the cells) as the true cell label.
Simulated data sets
Using one subpopulation of the Kumar data set as input, we simulated scRNA-seq data with known group structure, using
the splatter package29 v1.2.0. We generated three data sets,
each consisting of 500 cells, with varying degree of cluster separability. For the SimKumar4easy data set, we generated 4 subpopulations with relative abundances 0.1, 0.15, 0.5 and 0.25, and probabilities of differential expression set to 0.05, 0.1, 0.2 and 0.4 for the four subpopulations, respectively. The Sim-Kumar4hard data set consists of 4 subpopulations with relative abundances 0.2, 0.15, 0.4 and 0.25, and probabilities of differential expression 0.01, 0.05, 0.05 and 0.08. Finally, the SimKumar8hard data set consists of 8 subpopulations with relative abundances 0.13, 0.07, 0.1, 0.05, 0.4, 0.1, 0.1 and 0.05, and probabilites of differential expression equal to 0.03, 0.03, 0.03, 0.05, 0.05, 0.07, 0.08 and 0.1, respectively. The GitHub repository ( https://github.com/markrobinsonuzh/scRNAseq_cluster-ing_comparison) contains a link to a countsimQC report30,
comparing the main characteristics of the simulated data sets to those of the underlying Kumar data set.
Data processing
The scater package31 v1.6.3 was used to perform quality
control of the data sets. Features with zero counts across all cells,
as well as all cells with total count or total number of detected features more than 3 median absolute deviations (MADs) below the median across all cells (on the log scale), were excluded. Depending on the availability of manual annotation, we filtered out cells that were classified as doublets or debris. The scater package was also used to normalize the count values, based on normalization factors calculated by the deconvolu-tion method from the scran package32 v1.6.2, and to perform
dimension reduction using PCA33 and t-SNE34. Either the
raw feature counts or the log-transformed normalized counts were used as input to the clustering algorithms, following the recommendations by the authors (see Figure 4 for a summary of the input values used for each method).
Gene filtering
We evaluated three methods for reducing the number of genes provided as input to the clustering methods. For each filtering method, we retained 10% of the original number of genes (with a non-zero count in at least one cell) in the respective data sets. First, we retained only the genes with the highest average expression (log-normalized count) value across all cells (denoted Expr below). Second, we used Seurat17 to estimate the
vari-ability of the features and retained only the most highly variable ones (HVG). Finally, we used M3Drop35 to model the
drop-out rate of the genes as a function of the mean expression level using the Michaelis-Menten equation (M3Drop). The gene-wise Michaelis-Menten constants are computed and log-transformed, and the genes are then ranked by their p-value from a Z-test comparing the gene-wise constants to a global constant obtained by combining all the genes. After filtering, we used scran to renormalize each data set, excluding cells with negative size factors. Supplementary Figure 2 shows the overlap between the retained genes with the different filtering methods, for each of the 12 data sets, and Supplementary Table 1 provides the number of cells retained after each type of filtering.
Clustering methods
Fourteen clustering methods, publicly available as R pack-ages or scripts, were evaluated in this study (see Table 2 for an overview). We included general-purpose clustering methods, such as hierarchical clustering and K-means, as well as methods developed specifically for scRNA-seq data, such as Seurat
and SC3, and methods developed for other types of high-
throughput single-cell data (FlowSOM). The collection of methods include representatives for most types of algorithms commonly used to cluster scRNA-seq data. The type of the underlying clustering algorithm for the different methods is shown in Figure 4.
All methods except Seurat allow explicit specification of the desired number of clusters (k). Seurat instead requires a resolution parameter, which indirectly controls the number of clusters. For each data set, we ran each method with a range of k values (from 2 to either 10 or 15, depending on the true number of subpopulations in the data set). We ran Seurat with a range of resolution parameter values, yielding approximately the range of k values evaluated for the other methods. A subset of the methods provide an estimate of the true number of clusters; we record this estimate for comparison with the true number of
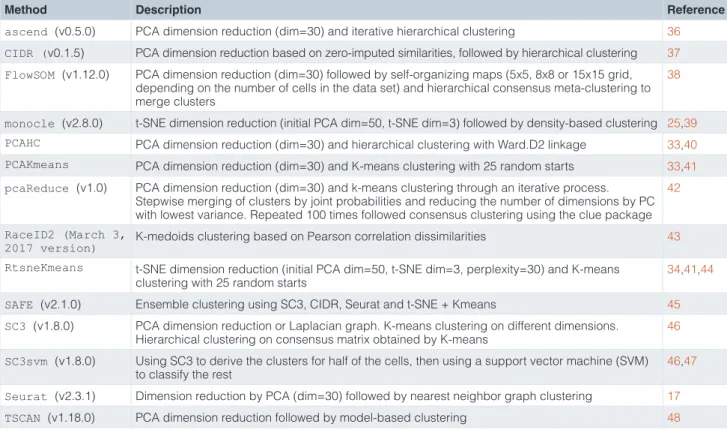
Table 2. Clustering methods.
Method Description Reference
ascend (v0.5.0) PCA dimension reduction (dim=30) and iterative hierarchical clustering 36
CIDR (v0.1.5) PCA dimension reduction based on zero-imputed similarities, followed by hierarchical clustering 37
FlowSOM (v1.12.0) PCA dimension reduction (dim=30) followed by self-organizing maps (5x5, 8x8 or 15x15 grid, depending on the number of cells in the data set) and hierarchical consensus meta-clustering to merge clusters
38
monocle (v2.8.0) t-SNE dimension reduction (initial PCA dim=50, t-SNE dim=3) followed by density-based clustering 25,39
PCAHC PCA dimension reduction (dim=30) and hierarchical clustering with Ward.D2 linkage 33,40
PCAKmeans PCA dimension reduction (dim=30) and K-means clustering with 25 random starts 33,41
pcaReduce (v1.0) PCA dimension reduction (dim=30) and k-means clustering through an iterative process. Stepwise merging of clusters by joint probabilities and reducing the number of dimensions by PC with lowest variance. Repeated 100 times followed consensus clustering using the clue package
42
RaceID2 (March 3, 2017 version)
K-medoids clustering based on Pearson correlation dissimilarities 43
RtsneKmeans t-SNE dimension reduction (initial PCA dim=50, t-SNE dim=3, perplexity=30) and K-means clustering with 25 random starts
34,41,44
SAFE (v2.1.0) Ensemble clustering using SC3, CIDR, Seurat and t-SNE + Kmeans 45
SC3 (v1.8.0) PCA dimension reduction or Laplacian graph. K-means clustering on different dimensions. Hierarchical clustering on consensus matrix obtained by K-means
46
SC3svm (v1.8.0) Using SC3 to derive the clusters for half of the cells, then using a support vector machine (SVM) to classify the rest
46,47
Seurat (v2.3.1) Dimension reduction by PCA (dim=30) followed by nearest neighbor graph clustering 17
TSCAN (v1.18.0) PCA dimension reduction followed by model-based clustering 48
subpopulations. For each choice of k (or resolution), we ran each method five times, allowing us to investigate the intrinsic stability of the obtained partitions. Note that the data is the same for all five instances, and thus only the stochasticity of the clustering method affects our stability evaluation. All parameter values except for the number of clusters were set to reasonable values following the authors’ recommendations or the respective manuals (Table 2). Gene and cell filtering within the clustering methods were disabled whenever possible, since these steps were performed in a uniform way during the preprocessing and gene selection steps.
Evaluation criteria
In order to evaluate how well the inferred clusters recovered the true subpopulations, we used the Hubert-Arabie Adjusted Rand Index (ARI) for comparing two partitions49. The metric is
adjusted for chance, such that independent clusterings have an expected index of zero and identical partitions have an ARI equal to 1, and was calculated using the implementation in the mclust R package v5.4. We also used the ARI to evaluate the stability of the clusters, by comparing the partitions from each pair of the five independent runs for each method with a given number of clusters.
We used a normalized Shannon entropy50 to evaluate whether
the methods preferentially partitioned the cells into clusters of equal size, or whether they preferred to generate some large
and some small clusters. Given proportions p1, . . . , pN of cells assigned to each of N clusters, the normalized Shannon entropy is defined by 2 1 2 . = = −
∑
N i i i max H log p p H log N(1)
Since the true degree of equality of the cluster sizes varies between data sets, we subtracted the normalized entropy calculated from the true partition to obtain the final performance index. To evaluate the similarities between the partitions obtained by different methods, we first calculated a consensus partition from the five independent runs for each method, using the
clue R package51 v0.3-55. Next, for each data set and each
imposed number of clusters, we calculated the ARI between the partitions for each pair of methods, and used hierarchical clustering based on the median of these ARI values across all data sets to generate a dendrogram representing the similarity among the clusters obtained by different methods. To investigate how representative this dendrogram is, we also clustered the methods based on each data set separately, and calculated the fraction of such dendrograms in which each subcluster in the overall dendrogram appeared.
Finally, we investigated whether clustering performance was improved by combining two methods into an ensemble. For
each data set, and with the true number of clusters imposed, we calculated a consensus partition for each pair of methods using
the clue R package, and used the ARI to evaluate the
agree-ment with the true cell labels. We then compared the ensemble performance to the performances of the two individual methods used to construct the ensemble.
Results
Large differences in performance across data sets and methods
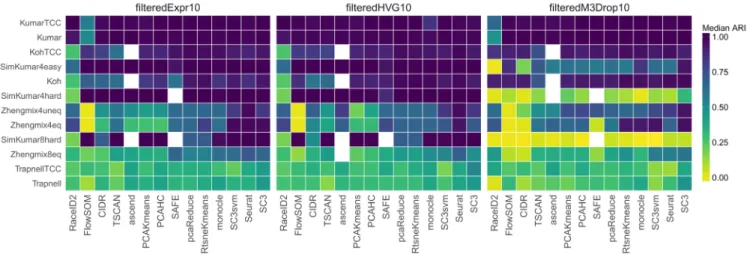
The 14 methods were tested on real data sets as well as simula-tions with a varying degree of complexity (Table 1) and across a range of the number of subpopulations. Focusing on the agree-ment between the true partitions and the clusterings obtained by imposing the true number of clusters showed a large difference between data sets as well as between methods (Figure 1; a summary across different numbers of clusters can be found in Supplementary Figure 3).
As expected, excellent performances were achieved for the well-separated data sets with a strong difference between the groups of cells (Kumar, KumarTCC and SimKumar4easy). When filtering by expression or variability, close to all methods achieved a correct partitioning of the cells in these data sets, while the
M3Drop
filtering led to a poorer performance for the simulated data set. All methods failed to recover the partition of the cells by time point in the Trapnell data sets, where the ARIs were consistently below 0.5. This indicates that there are other, stronger, signals in this data set that dominate the clustering.We note that the M3Drop filtering consistently led to a worse performance for the simulated data sets, while the performance was more similar to the other filterings for the real data sets, which may indicate that the simulated dropout pattern is not consist-ent with the one being modeled by the M3Drop package. Due
to negative size factor estimates, a larger number of cells had to be excluded in the Zhengmix data sets after the M3Drop filter-ing compared to the expression or HVG filterfilter-ing (Supplementary Table 1). At most just over 20% of the cells in the expression and HVG filtering and up to approximately 40% of the cells for the M3Drop filtering were excluded, making a direct com-parison between the filterings difficult. Furthermore, the genes retained in the M3Drop and expression filterings showed a low degree of overlap in many of the data sets (Supplementary Figure 2). Overall, only small differences were seen between the results for the data sets containing gene abundances and those containing transcript compatibility counts (TCCs).
While none of the methods consistently outperformed the others over the full range of the imposed numbers of clusters in all data sets, SC3 and Seurat often showed the best perform-ance. These methods were also the only ones that achieved a good separation of the cell types in the droplet-based Zhengmix data sets, which have a much higher degree of sparsity and a larger number of cells than the other data sets. This is consist-ent with a previous study16 showing that Seurat performed
better than other types of algorithms on data with low read depth. Generally, the performance of Seurat was also not strongly affected by the gene filtering approach (except for the simulated data sets), while other methods, like SAFE, were more sensi-tive to the choice of input genes for some data sets. FlowSOM showed a poor performance for the true number of clusters (see
Supplementary Figure 4 for an illustration, together with a selec-tion of other data set/method combinaselec-tions with poor ARI values). However, if the number of clusters was increased, the performance of FlowSOM improved considerably, and if the methods instead were compared at the number of clusters that gave the optimal performance for each method, FlowSOM showed a better performance (Supplementary Figure 5). RtsneKmeans, a general-purpose method, showed a higher average performance across the data sets and filterings than many of the clustering
Figure 1. Median ARI scores, representing the agreement between the true partition and the one obtained by each method, when the number of clusters is fixed to the true number. Each row corresponds to a different data set, each panel to a different gene filtering method, and each column to a different clustering method. The methods and the data sets are ordered by their mean ARI across the filterings and data sets. Some methods failed to return a clustering with the correct number of clusters for certain data sets (indicated by white squares).
algorithms specifically developed for scRNA-seq data. Compared
to SC3 and Seurat, RtsneKmeans showed poorer
perform-ance for the SimKumar8hard and Zhengmix4uneq data sets. The subpopulations in these data sets are nested in the t-SNE space, explaining the difficulty in clustering for the K-means algorithm (Supplementary Figure 1).
We also investigated whether the number of detected features per cell differed between the clusters, using a Kruskal-Wallis test52. No strong association was found for the simulated data sets
(Supplementary Figure 6), indicating that there is low inherent bias in the clustering algorithms. For most of the real data sets, we found highly significant differences in the number of detected features between cells in different clusters. However, it is unclear whether this represents a technical effect or a biological difference between the cell populations.
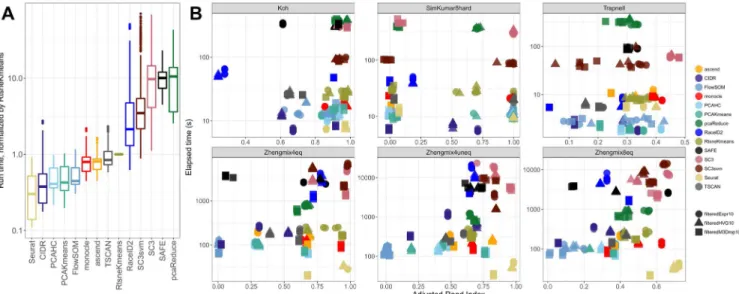
Run times vary widely between methods
We measured the elapsed time for each run, using a single core and excluding the time to estimate the number of clusters if this was done via a separate function. Since the run times are strongly dependent on the number of features and cells in a data set, we represent them as normalized run times, by dividing with the time required for RtsneKmeans for the same data set (Figure 2A).
Seurat was the fastest method, while pcaReduce, SAFE
and SC3 were the slowest, sometimes by a large margin.
Clus-tering only half of the cells with SC3 and predicting the class of the others with a Support Vector Machine (SC3svm) gave slightly shorter run times than applying the SC3 clustering to all cells. The method could potentially be accelerated by using a lower proportion of cells as a training subset. A detailed overview of the run time and the dependence on the number of clusters is given in Supplementary Figure 7 and Supplementary Figure 8. Apart from SC3 and SC3svm, the imposed number of clusters did not affect the run time.
Plotting the run time versus the ARI for a subset of the data sets (excluding the ones with the strongest signal, where all methods found the correct clusters, and the TCC data sets) (Figure 2B) further illustrated the variability between the methods. Interestingly,
Seurat
was generally the fastest method, especially for the droplet-based data sets, but at the same time provided among the best partitionings of the data. The scalability of the methods was investigated by subsampling the largest data set (Zhengmix4uneq) and plotting the run time as a function of the number of cells (Supplementary Figure 9). The majority of the methods showed a linear increase in run time as a function of the number of cells, while CIDR and RaceID2 scaled worse. The run time of SC3 and SC3svm, and to some extent SAFE, showed more complex patterns since these methods reduce the number of random starts of the Kmeans algorithm drastically if the number of cells exceeds 2,000.High stability between clustering runs
Figure 1 illustrated the average performance of each method across the five runs on each data set, for the true number of clusters. By comparing the partitions obtained in the individual runs, we could also obtain a measure of the stability of each method (Figure 3A).
CIDR, monocle, RaceID2, PCAHC, TSCAN, ascend
and Seurat returned the same clusters in all five instances
for all data sets, while the stability of the other methods depended on the data set. TSCAN and monocle set the random seed to a fixed value internally, which explains the high stability of these methods. Seurat, SC3 and RaceID2 allow the user to set the random seed via an input argument, and we explicitly set this to different values in the five independent runs. Again, the stability was lower for the simulated data sets after gene filtering by M3Drop (note that the same genes were
Figure 2. (A) Normalized run times, using RtsneKmeans as the reference method, across all data set instances and number of clusters. (B) Run time versus performance (ARI) for a subset of data sets and filterings, for the true number of clusters.
Figure 3. (A) Median stability (ARI across different runs on the same data set) for the methods, with the annotated number of clusters imposed. Some methods failed to return a clustering with the correct number of clusters for certain data sets (indicated by white squares). (B) The difference between the normalized entropy of the obtained clusterings and that of the true partitions, across all data sets and for the annotated number of clusters. (C) The difference between the number of clusters giving the maximal ARI and the annotated number of clusters, across all data sets.
used in all five runs), indicating that the selection of genes may be suboptimal.
A summary of the variability both within and between the different filterings is shown in Supplementary Figure 10. It is worth noting that comparing the performances between the different filtering approaches is difficult for two reasons: first, the variability of the clustering runs for a given filtering might exceed the variation between the filterings, and second, filter-ing with
M3Drop
led to the exclusion of a large number of cells in the Zhengmix data sets, and these cells can not be used for the comparison. For the stable methodsCIDR, TSCAN,
ascend
andPCAHC,
the type of filtering had a relatively large impact on the clustering solutions, and often filtering on the mean gene expression and the gene variability gave more similar clusters than filtering withM3Drop
. The stochastic methodsshowed both a high variability between the individual runs for a given filtering and between runs with different filterings.
Qualitative differences between cluster characteristics
By computing the Shannon entropy for the various partitions, we obtained a measure of the equality of the sizes of the clusters (Figure 3B). Since the true degree of cluster size uniformity as well as the number of clusters are different between data sets, we compared the normalized Shannon entropy of the clusterings to that of the true partitions. Thus, a positive value of this statistic indicates that a method tends to produce more equally sized clusters than the true ones, and a negative value instead indicates that the method tends to return more unequal clus-ter sizes, e.g., one large clusclus-ter and a few small ones. Most methods gave cluster sizes that were compatible with the true sizes for most data sets (a statistic close to 0), while especially
FlowSOM was more variable, and often tended to group the cells into one large cluster and a few very small ones (see
Supplementary Figure 4 for an example). One consequence of this was that FlowSOM often showed higher ARI values for a larger number of clusters, while the performance of many of the other methods decreased with increasing k (Supplementary Figure 3). These methods tended to have more equally sized clusters for larger numbers of clusters than the true number, leading to a higher disagreement between the true classification and the clusterings (the entropy across the range of k is shown in
Supplementary Figure 11).
The optimal number of clusters can differ from the ”true” one
Above, we investigated the performance and stability of the methods when the true number of clusters (the number of differ-ent labels in the partitioning considered as the ground truth) was imposed. Whether this number of clusters actually provided the highest ARI value (i.e., the best agreement with the ground truth) mainly depended on the difficulty of the clustering task (Figure 3C), and the choice of method. No method achieved the best performance at the annotated number of clusters in all the data sets, although generally, the methods reached their maximum performance at or near the annotated number of clusters. The notable exception was FlowSOM, which required a relatively large number of clusters to reach its maximal performance.
SC3, CIDR, ascend, SAFE and TSCAN all have built-in
functionality for estimating the optimal number of clusters. In most cases, the estimated number was close to the true one; however, ascend and CIDR had a tendency to underestimate the number of clusters, while SC3 and TSCAN instead tended to overestimate the number (Supplementary Figure 12). The tendency
of SC3 to overestimate the cluster number is consistent with a
previous publication16. The agreement with the true partition
at the estimated number of clusters is shown in Supplementary Figure 13. SC3 is still the best-performing method in this situation.
Inconsistent degree of similarity between methods
The similarity between each pair of methods was quantified by means of the ARIs for each pair of consensus clusterings (across the five runs of each method for each data set and number of clusters). Figure 4 shows a dendrogram of the methods obtained by hierarchical clustering based on the average ARI values across all data sets for the true number of clusters. The numbers shown at the internal nodes indicate the stability of the subclusters, that is, the fraction of the corresponding dendro-grams from the individual data sets where a particular subcluster could be found. In general, the groupings of the methods shown in the dendrogram were unstable across data sets, indicated by the low stability fractions of all subclusters. This is consistent with previous studies showing generally poor concordance that varied across data sets20,45. Even SC3 and SC3svm had
surprisingly different clusterings; in less than a third of the data sets, these two methods showed the most similar cluster-ings. In addition, no apparent association between the similarity of the clusterings and the type of input or the dimension reduction or underlying type of clustering algorithm was seen (Figure 4).
Ensembles often don’t improve clustering performance
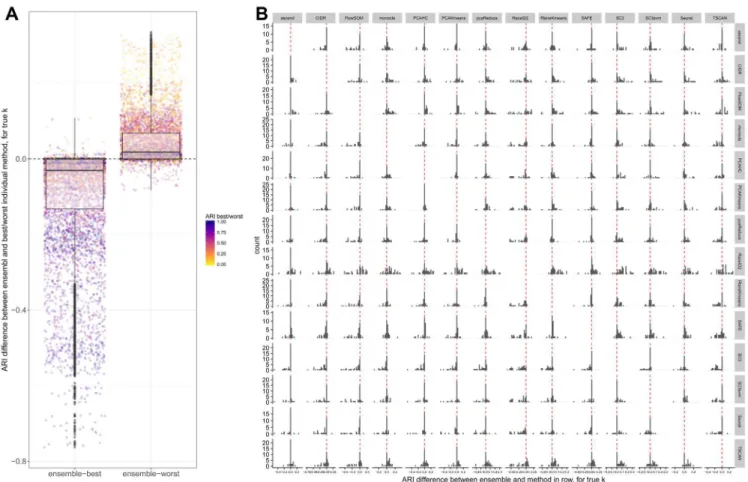
Next, we investigated whether we could improve the cluster-ing performance by combincluster-ing methods into an ensemble. For each pair of methods, we generated a consensus clustering and evaluated its agreement with the true partition using the ARI. In general, the performance of the ensemble was worse than the better of the two combined methods, and better than the worse of the two methods (Figure 5A), suggesting that we would obtain a better performance by choosing a single good clustering method rather than combining multiple different ones. This is Figure 4. Clustering of the methods based on the average similarity of their partitions across data sets, for the true number of clusters.
Figure 5. Comparison between individual methods and ensembles. (A) Difference between the ARI of each ensemble and the ARI of the best (left) and worst (right) of the two methods in the ensemble, across all data sets and for the true number of clusters. (B) Difference between the ARI of each ensemble and each of the components, across all data sets and for the true number of clusters. The histogram in row i, column j represents the differences between the ARIs of the ensemble of the methods in row i and column j and the ARI of the method in row i on its own.
largely consistent with a recent study evaluating the combination of four methods (SC3, CIDR, Seurat, tSNE+Kmeans), where the ensemble performance was generally on par with the best individual method45. It is still possible that an ensemble
method could provide a general improvement over a given single method, since it is unlikely that the same method will be the best performing in all conceivable data sets. In fact, among the methods we evaluated, both SC3 and SAFE combine multiple individual methods to achieve the final clustering result. Studying individual combinations in more detail, we observed that combining SC3 or Seurat with almost any other method led to a worse performance than obtained by these methods alone (consistent with the observation that they were among the meth-ods giving the best performance). On the other hand, methmeth-ods like CIDR, FlowSOM and TSCAN could often be improved by combining them with another method (Figure 5B).
Discussion and conclusions
In this study, we have evaluated 14 clustering methods on both real and simulated scRNA-seq data. There were large differences in the ability of the methods to recover the annotated clusters,
and performance was also strongly dependent on the degree of separation between the true classes. SC3 and Seurat, two clustering methods developed specifically for single-cell RNA-seq data, delivered the overall best performance, and were the only ones to properly recover the cell types in the droplet-based data sets. There was, however, a large difference in the run time, with SC3 being several orders of magnitude slower than Seurat. Another difference between these two methods is that SC3 includes a method for estimating the number of clusters (which has a tendency towards overestimation), while Seurat will determine the number of clusters based on a resolution parameter set by the user.
The same preprocessing steps and fixed gene sets were used for all clustering methods. This enabled us to investigate the impact of the clustering algorithm itself, rather than entire pipelines or workflows. The selection of the filtering approach had an impact on the majority of the methods and resulted in different clustering solutions. Specifically for the more difficult data sets there was a higher dissimilarity. However, this did not necessarily affect the performances of the methods.
The stability of clustering algorithms can be evaluated by generating perturbed subsamples of the data set and redoing the clusterings. These subsamples can be created in several ways, e.g., by random subsampling with or without replacement, by adding noise to the original data53 or by simulating technical
replicates54. Freytag20 showed that SC3, Seurat, CIDR and
TSCAN were stable under cell-wise perturbations. In our study, we evaluated the methods with respect to their sensitivity to random starts. Overall, the methods showed a high degree of stability across all data sets, except for the simulated data sets in combination with the M3Drop filtering, where the stochas-tic methods showed a decrease in stability. This may be due to a disagreement between the mean-dropout relationship in the simulated data and the one assumed by M3Drop, leading to a suboptimal gene selection.
The evaluated methods are based on a broad spectrum of approaches for dimensionality reduction and clustering. We note that the majority of the methods use PCA or PCoA for dimension reduction or Euclidean distances as the distance metric (ascend allows for other alternatives). Thus, no clear advice on the type of algorithm that is best suited for clustering single-cell RNA-seq data can be made based on our results. In fact, the two best- performing methods, SC3 and Seurat, rely on very different underlying clustering algorithms.
We investigated the impact of changing the imposed number of clusters for the different methods, which revealed that a subset of the methods, in particular
FlowSOM,
consistently showed a better agreement with the true subpopulations if the number of clusters was increased beyond the true number. The reason for this appears to be thatFlowSOM
tends to split off a few very small clusters. In addition to the number of clusters, most methods rely on other hyperparameters. In this study, we have fixed these to reasonable values. However, additional investiga-tions into the effect of these hyperparameters on the results would be an interesting direction for future research.Data availability
The R/Bioconductor data package DuoClustering2018 provides full access to the filtered (and unfiltered) data sets, the clustering results from our study and functions for sum-marizing the performance of different scRNA-seq clustering methods (https://bioconductor.org/ packages/DuoClustering2018). Additionally, helper functions and descriptions for the evaluation of new methods and data sets are provided.
Archived R scripts as at time of publication are available from
https://doi.org/10.5281/zenodo.1314743
Author contributions
AD: Data Curation, Formal Analysis, Investigation, Methodol-ogy, Software, Visualization, Writing-Original Draft Preparation, Writing-Review & Editing
MDR: Conceptualization, Data Curation, Formal Analysis, Funding Acquisition, Investigation, Methodology, Resources, Writing-Original Draft Preparation, Writing-Review & Editing CS: Conceptualization, Data Curation, Formal Analysis, Investi-gation, Methodology, Software, Visualization, Writing-Original Draft Preparation, Writing-Review & Editing
Grant information
We acknowledge funding support from the Swiss National Science Foundation (Grant Number 310030_175841 to MDR) and the Chan Zuckerberg Initiative (Grant Number 182828 to MDR). The funders had no role in study design, data collection and analysis, decision to publish, or preparation of the manuscript.
Acknowledgements
We would like to thank the members of the Robinson group at the UZH for valuable input.
Supplementary material
Supplementary File 1: PDF file containing Supplementary Figures 1–13 and Supplementary Table 1.
Click here to access the data
References
1. Tang F, Barbacioru C, Wang Y, et al.: mRNA-Seq whole-transcriptome analysis of a single cell.Nat Methods. 2009; 6(5): 377–382.
PubMed Abstract | Publisher Full Text
2. Picelli S, Björklund ÅK, Faridani OR, et al.: Smart-seq2 for sensitive full-length transcriptome profiling in single cells.Nat Methods. 2013; 10(11): 1096–1098. PubMed Abstract | Publisher Full Text
3. Klein AM, Mazutis L, Akartuna I, et al.: Droplet barcoding for single-cell transcriptomics applied to embryonic stem cells.Cell. 2015; 161(5): 1187–1201. PubMed Abstract | Publisher Full Text | Free Full Text
4. Macosko EZ, Basu A, Satija R, et al.: Highly Parallel Genome-wide Expression
Profiling of Individual Cells Using Nanoliter Droplets.Cell. 2015; 161(5): 1202–1214.
PubMed Abstract | Publisher Full Text | Free Full Text
5. Zheng GX, Terry JM, Belgrader P, et al.: Massively parallel digital transcriptional profiling of single cells.Nat Commun. 2017; 8: 14049.
PubMed Abstract | Publisher Full Text | Free Full Text
6. Svensson V, Natarajan KN, Ly LH, et al.: Power analysis of single-cell RNA-sequencing experiments.Nat Methods. 2017; 14(4): 381–387. PubMed Abstract | Publisher Full Text | Free Full Text
RNA-seq in the past decade.Nat Protoc. 2018; 13(4): 599–604. PubMed Abstract | Publisher Full Text
8. Ziegenhain C, Vieth B, Parekh S, et al.: Quantitative single-cell transcriptomics. Brief Funct Genomics. 2018; 17(4): 220–232.
PubMed Abstract | Publisher Full Text | Free Full Text
9. Grün D, Kester L, van Oudenaarden A: Validation of noise models for single-cell transcriptomics.Nat Methods. 2014; 11(6): 637–640.
PubMed Abstract | Publisher Full Text
10. Bacher R, Kendziorski C: Design and computational analysis of single-cell RNA-sequencing experiments.Genome Biol. 2016; 17(1): 63.
PubMed Abstract | Publisher Full Text | Free Full Text
11. Tung PY, Blischak JD, Hsiao CJ, et al.: Batch effects and the effective design of single-cell gene expression studies.Sci Rep. 2017; 7: 39921.
PubMed Abstract | Publisher Full Text | Free Full Text
12. Hicks SC, Townes FW, Teng M, et al.: Missing data and technical variability in single-cell RNA-sequencing experiments.Biostatistics. 2017; kxx053. PubMed Abstract | Publisher Full Text
13. Zappia L, Phipson B, Oshlack A: Exploring the single-cell RNA-seq analysis landscape with the scRNA-tools database.PLoS Comput Biol. 2018; 14(6): e1006245.
PubMed Abstract | Publisher Full Text | Free Full Text
14. Aghaeepour N, Finak G, FlowCAP Consortium, et al.: Critical assessment of automated flow cytometry data analysis techniques.Nat Methods. 2013; 10(3): 228–238.
PubMed Abstract | Publisher Full Text | Free Full Text
15. Weber LM, Robinson MD: Comparison of clustering methods for high-dimensional single-cell flow and mass cytometry data.Cytometry A. 2016;
89(12): 1084–1096.
PubMed Abstract | Publisher Full Text
16. Menon V: Clustering single cells: a review of approaches on high-and low-depth single-cell RNA-seq data.Brief Funct Genomics. 2018; 17(4): 240–245 PubMed Abstract | Publisher Full Text | Free Full Text
17. Satija R, Farrell JA, Gennert D, et al.: Spatial reconstruction of single-cell gene expression data.Nat Biotechnol. 2015; 33(5): 495–502.
PubMed Abstract | Publisher Full Text | Free Full Text
18. Langfelder P, Horvath S: WGCNA: an R package for weighted correlation network analysis.BMC Bioinformatics. 2008; 9: 559.
PubMed Abstract | Publisher Full Text | Free Full Text
19. Zeisel A, Muñoz-Manchado AB, Codeluppi S, et al.: Brain structure. Cell types in the mouse cortex and hippocampus revealed by single-cell RNA-seq.Science.
2015; 347(6226): 1138–1142. PubMed Abstract | Publisher Full Text
20. Freytag S, Tian L, Lönnstedt I, et al.: Comparison of clustering tools in R for medium-sized 10x Genomics single-cell RNA-sequencing data [version 1; referees: 1 approved, 2 approved with reservations].F1000Res. 2018; 7: 1297. Publisher Full Text
21. Andrews TS, Hemberg M: Identifying cell populations with scRNASeq.Mol Aspects Med. 2018; 59: 114–122.
PubMed Abstract | Publisher Full Text
22. Soneson C, Robinson MD: Bias, robustness and scalability in single-cell differential expression analysis.Nat Methods. 2018; 15(4): 255–261. PubMed Abstract | Publisher Full Text
23. Kumar RM, Cahan P, Shalek AK, et al.: Deconstructing transcriptional heterogeneity in pluripotent stem cells.Nature. 2014; 516(7529): 56–61. PubMed Abstract | Publisher Full Text | Free Full Text
24. Koh PW, Sinha R, Barkal AA, et al.: An atlas of transcriptional, chromatin accessibility, and surface marker changes in human mesoderm development. Sci Data. 2016; 3: 160109.
PubMed Abstract | Publisher Full Text | Free Full Text
25. Trapnell C, Cacchiarelli D, Grimsby J, et al.: The dynamics and regulators of cell fate decisions are revealed by pseudotemporal ordering of single cells.Nat Biotechnol. 2014; 32(4): 381–386.
PubMed Abstract | Publisher Full Text | Free Full Text
26. Ramos M, Schiffer L, Re A, et al.: Software for the integration of Multi-Omics experiments in Bioconductor.bioRxiv. 2017.
Publisher Full Text
27. Bray NL, Pimentel H, Melsted P, et al.: Near-optimal probabilistic RNA-seq quantification.Nat Biotechnol. 2016; 34(5): 525–527.
PubMed Abstract | Publisher Full Text
28. Ntranos V, Kamath GM, Zhang JM, et al.: Fast and accurate single-cell RNA-Seq analysis by clustering of transcript-compatibility counts.Genome Biol. 2016;
17(1): 112.
PubMed Abstract | Publisher Full Text | Free Full Text
29. Zappia L, Phipson B, Oshlack A: Splatter: simulation of single-cell RNA sequencing data.Genome Biol. 2017; 18(1): 174.
PubMed Abstract | Publisher Full Text | Free Full Text
30. Soneson C, Robinson MD: Towards unified quality verification of synthetic count data with countsimQC.Bioinformatics. 2018; 34(4): 691–692. PubMed Abstract | Publisher Full Text | Free Full Text
31. McCarthy DJ, Campbell KR, Lun AT, et al.: Scater: pre-processing, quality control, normalization and visualization of single-cell RNA-seq data in R. Bioinformatics. 2017; 33(8): 1179–1186.
PubMed Abstract | Publisher Full Text | Free Full Text
32. Lun AT, Bach K, Marioni JC: Pooling across cells to normalize single-cell RNA sequencing data with many zero counts.Genome Biol. 2016; 17(1): 75. PubMed Abstract | Publisher Full Text | Free Full Text
33. Pearson K: On lines and planes of closest fit to systems of points in space. Philos Mag. 1901; 2: 559–572.
Publisher Full Text
34. van der Maaten L, Hinton G: Visualizing data using t-SNE.J Mach Learn Res.
2008; 9: 2579–2605. Reference Source
35. Andrews TS, Hemberg M: Dropout-based feature selection for scRNASeq. bioRxiv. 2018.
Publisher Full Text
36. Senabouth A, Lukowski S, Alquicira J, et al.: ascend: R package for analysis of single cell RNA-seq data.bioRxiv. 2017.
Publisher Full Text
37. Lin P, Troup M, Ho JW: CIDR: Ultrafast and accurate clustering through imputation for single-cell RNA-seq data.Genome Biol. 2017; 18(1): 59.
PubMed Abstract | Publisher Full Text | Free Full Text
38. Van Gassen S, Callebaut B, Van Helden MJ, et al.: Flowsom: Using self-organizing maps for visualization and interpretation of cytometry data.Cytometry A. 2015;
87(7): 636–645.
PubMed Abstract | Publisher Full Text
39. Qiu X, Mao Q, Tang Y, et al.: Reversed graph embedding resolves complex single-cell trajectories.Nat Methods. 2017; 14(10): 979–982.
PubMed Abstract | Publisher Full Text | Free Full Text
40. Ward JH Jr: Hierarchical grouping to optimize an objective function.J Am Stat Assoc. 1963; 58(301): 236–244.
Publisher Full Text
41. Hartigan JA, Wong MA: Algorithm as-136: A k-means clustering algorithm.
J R Stat Soc Ser C Appl Stat. 1979; 28(1): 100–108. Publisher Full Text
42. Žurauskienė J, Yau C: pcaReduce: hierarchical clustering of single cell transcriptional profiles.BMC Bioinformatics. 2016; 17(1): 140. PubMed Abstract | Publisher Full Text | Free Full Text
43. Grün D, Muraro MJ, Boisset JC, et al.: De Novo Prediction of Stem Cell Identity using Single-Cell Transcriptome Data.Cell Stem Cell. 2016; 19(2): 266–277. PubMed Abstract | Publisher Full Text | Free Full Text
44. Van Der Maaten L: Accelerating t-SNE using tree-based algorithms.J Mach Learn Res. 2014; 15: 1–21.
Reference Source
45. Yang Y, Huh R, Culpepper HW, et al.: SAFE-clustering: Single-cell aggregated (from ensemble) clustering for single-cell RNA-seq data.bioRxiv. 2017. Publisher Full Text
46. Kiselev VY, Kirschner K, Schaub MT, et al.: SC3: consensus clustering of single-cell RNA-seq data.Nat Methods. 2017; 14(5): 483–486.
PubMed Abstract | Publisher Full Text | Free Full Text
47. Cortes C, Vapnik V: Support-vector networks.Mach Learn. 1995; 20(3): 273–297. Publisher Full Text
48. Ji Z, Ji H: TSCAN: Pseudo-time reconstruction and evaluation in single-cell RNA-seq analysis.Nucleic Acids Res. 2016; 44(13): e117.
PubMed Abstract | Publisher Full Text | Free Full Text
49. Hubert L, Arabie P: Comparing partitions.J Classif. 1985; 2(1): 193–218. Publisher Full Text
50. Shannon CE: A mathematical theory of communication.Bell Syst Tech J. 1948;
27(3): 379–423. Publisher Full Text
51. Hornik K: A CLUE for CLUster Ensembles.J Stat Softw. 2005; 14(12): 1–25. Publisher Full Text
52. Kruskal WH, Wallis WA: Use of ranks in one-criterion variance analysis.J Am Stat Assoc. 1952; 47(260): 583–621.
Publisher Full Text
53. Von Luxburg U: Clustering stability: an overview.Foundations and Trends in Machine Learning. 2010; 2(3): 235–274.
Publisher Full Text
54. Severson DT, Owen RP, White MJ, et al.: BEARscc determines robustness of single-cell clusters using simulated technical replicates.Nat Commun. 2018;
9(1): 1187.
Open Peer Review
Current Referee Status:
Version 2
11 September 2018 Referee Reportdoi:
10.5256/f1000research.17687.r38139
Saskia Freytag
Department of Medical Biology , University of Melbourne, Parkville, Vic, Australia
I am satisfied with the changes the authors have made.
Furthermore, I want to commend the authors for making the data accessible through an R package to
facilitate further benchmarking of single cell clustering methods.
No competing interests were disclosed.
Competing Interests:
I have read this submission. I believe that I have an appropriate level of expertise to confirm that
it is of an acceptable scientific standard.
10 September 2018 Referee Report