Himmelfarb Health Sciences Library, The George Washington University
Health Sciences Research Commons
Biochemistry and Molecular Medicine Faculty
Publications
Biochemistry and Molecular Medicine
1-1-2015
BioXpress: an integrated RNA-seq-derived gene
expression database for pan-cancer analysis.
Quan Wan
George Washington University
Hayley Dingerdissen
George Washington University
Yu Fan
George Washington University
Naila Gulzar
George Washington University
Yang Pan
George Washington University
See next page for additional authorsFollow this and additional works at:
http://hsrc.himmelfarb.gwu.edu/smhs_biochem_facpubs
Part of the
Biochemistry, Biophysics, and Structural Biology Commons
This Journal Article is brought to you for free and open access by the Biochemistry and Molecular Medicine at Health Sciences Research Commons. It has been accepted for inclusion in Biochemistry and Molecular Medicine Faculty Publications by an authorized administrator of Health Sciences Research Commons. For more information, please [email protected].
Recommended Citation
Quan Wan et als. BioXpress: An integrated RNA-seq-derived gene expression database for pan-cancer analysis. (n.d.). Database (Oxford). doi:10.1093/database/bav019
Quan Wan, Hayley Dingerdissen, Yu Fan, Naila Gulzar, Yang Pan, Tsung-Jung Wu, Cheng Yan, Haichen
Zhang, and Raja Mazumder
This journal article is available at Health Sciences Research Commons:http://hsrc.himmelfarb.gwu.edu/smhs_biochem_facpubs/ 185
Database tool
BioXpress: an integrated RNA-seq-derived gene
expression database for pan-cancer analysis
Quan
Wan
1, Hayley
Dingerdissen
1, Yu
Fan
1, Naila
Gulzar
1, Yang
Pan
1,
Tsung-Jung
Wu
1, Cheng
Yan
1, Haichen
Zhang
1and Raja
Mazumder
1,2,*
1Department of Biochemistry and Molecular Medicine and
2McCormick Genomic and Proteomic
Center, The George Washington University, Washington, DC 20037, USA
*Corresponding author: Phone: 202-994-5004, Fax: 202-994-8974, Email: [email protected]
Citation details: Wan,Q.,Dingerdissen,H.,Fan,Y.,et al.BioXpress: an integrated RNA-seq-derived gene expression data-base for pan-cancer analysis.Database(2015) Vol. 2015: article ID bav019; doi:10.1093/database/bav019
Received 11 November 2014; Revised 10 February 2015; Accepted 18 February 2015
Abstract
BioXpress is a gene expression and cancer association database in which the
expres-sion levels are mapped to genes using RNA-seq data obtained from The Cancer
Genome Atlas, International Cancer Genome Consortium, Expression Atlas and
publica-tions. The BioXpress database includes expression data from 64 cancer types, 6361
patients and 17 469 genes with 9513 of the genes displaying differential expression
be-tween tumor and normal samples. In addition to data directly retrieved from RNA-seq
data repositories, manual biocuration of publications supplements the available cancer
association annotations in the database. All cancer types are mapped to Disease
Ontology terms to facilitate a uniform pan-cancer analysis. The BioXpress database is
easily searched using HUGO Gene Nomenclature Committee gene symbol, UniProtKB/
RefSeq accession or, alternatively, can be queried by cancer type with specified
signifi-cance filters. This interface along with availability of pre-computed downloadable files
containing differentially expressed genes in multiple cancers enables straightforward
retrieval and display of a broad set of cancer-related genes.
Database URL:
http://hive.biochemistry.gwu.edu/tools/bioxpress
Introduction
Gene expression is considered a key molecular marker for diagnostic and prognostic assessment of cancer (1–8). More than a decade ago, gene expression analysis was pro-posed as a method to complement classification schemes based on tumor morphology because it was well known that tumors with similar histopathological appearance can have considerably different clinical outcomes (6, 9).
These efforts provided the framework by which linking gene expression with cancer research could be realized (10). Hanahan and Weinberg (11) in their seminal paper ‘The Hallmarks of Cancer’ discussed the role of over- and under-expression of key genes in several cancers. The con-jectures that both diagnosis of somatically acquired lesions in tumors and genome-wide expression profiling of tumors would become routine (11) have not yet been realized, but
VCThe Author(s) 2015. Published by Oxford University Press. Page 1 of 13 This is an Open Access article distributed under the terms of the Creative Commons Attribution License (http://creativecommons.org/licenses/by/4.0/),
which permits unrestricted reuse, distribution, and reproduction in any medium, provided the original work is properly cited.
(page number not for citation purposes) Database, 2015, 1–13 doi: 10.1093/database/bav019 Database tool at GWU on October 14, 2015 http://database.oxfordjournals.org/ Downloaded from
we anticipate that this will likely change within the next decade. With advances in next-generation sequencing (NGS) technologies, several national and international pro-jects are underway that aim to capture and analyze the ex-pression profiles of thousands of tumors (12–14). Additionally, there are already thousands of publications that describe over- and under-expression of specific genes in cancer. Currently, to the best of our knowledge, there is no integrated view of the expression profiles of the human genes obtained from NGS technology such as RNA sequencing (RNA-seq). Moreover, no singular effort is underway to manually curate data from publications on cancer-related gene expression, enabling easy comparison of expression data and knowledge from both small publi-cations and large-scale studies like The Cancer Genome Atlas (TCGA: http://cancergenome.nih.gov/) and International Cancer Genome Consortium (ICGC: https:// icgc.org/). Lack of such efforts prevents us from tracking our knowledge of expression profiles of genes in different cancer types as technology improves and more data and in-formation accumulate. Furthermore, as we move toward the translation of expression analysis through genomic or proteomic technologies to the clinic, there is no easy way to compare a patient’s expression data with that extant data. BioXpress has been developed as the first step toward the provision of easy access to gene expression data from tumor and normal samples, which will be useful for clin-ical research, diagnostics and prognostics of cancer.
The specific technology used to measure gene expres-sion significantly affects the cost, comprehensiveness and the time consumed to perform expression analysis. DNA microarray and quantitative polymerase chain reaction (q-PCR) are powerful approaches for measuring gene expres-sion and have been used for many years. DNA microarray technology is efficient and cost-effective at the gene expres-sion level, while q-PCR is considered more sensitive. However, neither of these approaches can meet the sensi-tivity and comprehensiveness of the newer RNA-seq tech-nology (15, 16). Despite the benefits of RNA-seq, microarrays are often preferentially used due to the higher cost and lack of standardization of pipelines using the RNA-seq technology. Once these obstacles are overcome, it is clear that RNA-seq will become the predominant tool for expression analysis (17). In addition to expression ana-lysis, RNA-seq provides a number of other benefits. A sin-gle RNA-seq experiment output can aid in the discovery of novel and unannotated transcripts (18), single nucleotide variation (SNV) identification (19) and more (20). As RNA-seq technology and the corresponding analytical approaches grow, the application of this method is becom-ing indispensable for many scientific disciplines (21–23). To address this growing presence of RNA-seq data, we
currently focus on large-scale integration of RNA-seq-based expression data in BioXpress complemented by manual curation of information from publications report-ing gene expression associated with cancer. The manual curation process allows us to collect valuable expression-related information from peer-reviewed publications from diverse platforms. Integration of information from both large-scale studies and publications allows users to easily compare and contrast expression profiles of their gene(s) of interest.
The advancement of expression analysis technology has led to the development of corresponding databases and standards. For example, the Minimum Information About a Microarray Dataset initiative (24) provides standards for microarray data, while databases like the National Center for Biotechnology Information (NCBI) Gene Expression Omnibus (GEO) (25) and Array Express (26) have signifi-cant amounts of microarray data. Secondary databases that store and provide results and analysis of microarray and other gene expression data related to cancer such as CGED (Cancer Gene Expression Database) (27), GENT (Gene Expression across Normal and Tumor tissue) (28) and Oncomine (29) are also available. Finally, TCGA and ICGC data portals and databases, such as Expression Atlas (30), provide RNA-seq-generated data. All the above-men-tioned databases provide mechanisms to retrieve gene-spe-cific information, but, to the best of our knowledge, none of them allows integrated pan-cancer analysis across mul-tiple projects. NCBI GEO and European Bioinformatics Institute (EBI) ArrayExpress, e.g. are public repositories for high-throughput microarray and NGS functional gen-omic datasets. A gene symbol-based search can result in thousands of profiles from GEO Profiles Database. CGED, on the other hand, provides data specifically obtained through collaborative efforts of Nara Institute of Science and Technology, Osaka University Medical School, Kyoto University Medical School and Osaka Medical Center for Cancer and Cardiovascular Diseases. GENT provides Affymetrix microarray data from tumor and normal sam-ples, while Expression Atlas at EBI provides differential and baseline expression from several organisms. Similar to other public repository data, a single search can retrieve data from many experiments in these resources. Furthermore, although tools do exist which aim to analyze the same scope of data, the tools and databases of which we are aware do not facilitate the expression analysis on RNA-seq desired here. cBioPortal (31) is a widely popular resource with an emphasis on mutation analysis. Currently, Oncomine (29) does provide the means to ana-lyze expression for microarray data, but not for RNA-seq. Thus, there is no single tool/resource available which integrates RNA-seq information that allows
at GWU on October 14, 2015
http://database.oxfordjournals.org/
expression analysis to identify, e.g. cancer relatedness. Although hundreds of cancer RNA-seq studies are pub-lished each year, a cancer-centric RNA-seq expression database that integrates all cancer-related RNA-seq-based expression data from databases and publications is not available to the community. Portals like TCGA data portal and ICGC data portal, which provide RNA-seq-based ex-pression data, only provide access to raw read counts and normalized counts: such data cannot be easily used for comparative analysis across several cancer types and exist-ing experimental results in publications. In addition, differ-ent normalization methods are employed by differdiffer-ent data providers, making comparison and cross-type analysis even more challenging.
The BioXpress database project collects RNA-seq data from several publicly available sources such as TCGA (http://cancergenome.nih.gov/), ICGC (12) and Gene Expression Atlas (30), and uses a standardized method to identify the expression levels of the genes. Expression levels of genes are also manually extracted from publications to
supplement information gathered from large-scale studies. Additionally, all cancer types are mapped to Disease Ontology (32) terms to facilitate pan-cancer analysis. Finally, all genes are linked to a comprehensive cancer-related non-synonymous SNV database, BioMuta (33). Together, BioMuta and BioXpress provide a detailed view of the expression and mutations of genes in cancer and therefore can be used for pan-cancer studies like the one performed by our group recently (34) and described in this manuscript.
Data Source and Metrics
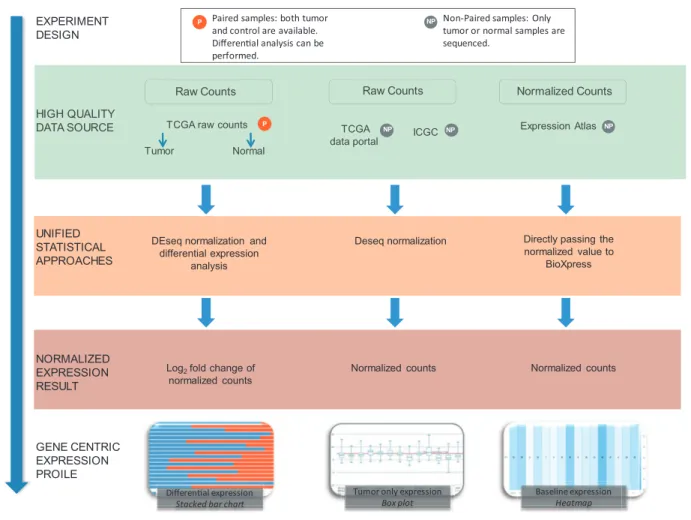
The majority of RNA-seq databases provide data either in FASTQ format (sequence reads) and/or raw read count data. Read count data are calculated by analyzing the map-ping file where the reads have already been aligned to a ref-erence genome. As shown inFigure 1, BioXpress processes data based on the availability of expression data from paired data that have both normal and tumor samples
TCGA raw counts TCGA
data portal ICGC
Expression Atlas Tumor Normal HIGH QUALITY DATA SOURCE UNIFIED STATISTICAL APPROACHES NORMALIZED EXPRESSION RESULT GENE CENTRIC EXPRESSION PROILE
Raw Counts Raw Counts Normalized Counts
DEseq normalization and differential expression
analysis
Deseq normalization Directly passing the normalized value to
BioXpress
Log2fold change of
normalized counts
Normalized counts Normalized counts
TCGA raw counts TCGA
data portal ICGC
Expression AtAA las
Tumor Normal
HIGH QUALITY DATAA ATT SOURCE
Raw Counts Raw Counts Normalized Counts
EXPERIMENT DESIGN
P Paired samples: both tumor NP
and control are available. Differenal analysis can be performed.
Non-Paired samples: Only tumor or normal samples are sequenced.
Differenal expression
Stacked bar chart
Tumor only expression
Box plot Baseline expression Heatmap NP NP P NP
Figure 1.Flow chart of the workflow used to create BioXpress. BioXpress processes short reads and read count data through distinct pipelines. Data are further divided into two groups: paired data that have both normal and tumor samples from the same patient, and non-paired, tumor-only data. Output in BioXpress is split into three different types: differential expression (stacked bar chart), tumor-only expression (box plot) and baseline ex-pression data (heatmap). In addition to the data integration approaches shown in the figure, gene exex-pression information is also extracted from publications.
Database, Vol. 2015, Article ID bav019 Page 3 of 13
at GWU on October 14, 2015
http://database.oxfordjournals.org/
from the same patient, and the non-paired data from just tumor and also from just normal tissue.
The data sources and statistics in terms of number of pa-tients from each data source are shown in Table 1. To achieve comprehensiveness, data are collected from TCGA, the Curated Short Read archive (CSR) (35), ICGC (12), Gene Expression Atlas (30) and publications (Table 1). It is important to note that ICGC, at the time of writing this art-icle, did not contain any data from paired normal and tumor samples which are not from TCGA. Therefore, the data in BioXpress are split into three different types: differ-ential expression, tumor-only expression and baseline ex-pression data from Illumina Human Body Map project (http://www.ebi.ac.uk/gxa/experiments/E-MTAB-513).
Data Processing
TCGA data portal
TCGA-Assembler was used to download RNA-seq data from TCGA data portal. Raw counts data with paired sam-ples (tumor and normal) were extracted and analyzed using DEseq R package with default parameters: method¼‘blind’, sharingMode¼‘fit-only’, fitType¼‘local’ (36). DEseq normalization method has been reported to out-perform other normalization methods (37). Fold changes, not absolute expression values, are displayed based on anal-ysis described above (38). False discovery rates are not defined due to the low number of replicates for samples. This approach allows the user to determine the significance of differentially expressed genes on an individual basis.
ICGC data portal
ICGC contains tumor-only data (normal samples are not sequenced by the consortium currently). Gene expression data from tumor samples was downloaded from ICGC data portal (12) and analyzed using DEseq R package with default parameters (36).
Expression atlas
Normalized baseline expression was downloaded via Expression Atlas (http://www.ebi.ac.uk/gxa/download.
html) (30). Because raw read counts are not available for all data retrieved from Expression Atlas, no additional nor-malization was performed in BioXpress.
Manual curation from publications
Decades of research on differential expression in tumor and normal samples has led to thousands of publications. Although many of these studies are based on samples from modest numbers of patients, there is value in the systematic capture and presentation of this information alongside large-scale studies such as those presented by TCGA and ICGC. Although it is possible that studies may exhibit discordance, it is equally possible for the consideration of such additional experiments to contribute to the ‘big picture’ of differential expression between tumor and normal samples. We leave it to the discretion of individual users to decide the significance of curated publications in application to their studies.
For manual curation of expression data, genes identified in our previous pan-cancer study were prioritized (34). In addition to this prioritization, genes annotated by UniProtKB/Swiss-Prot as associated with cancer and Cancer Gene Census (http://www.sanger.ac.uk/genetics/ CGP/Census/) (39) were also targeted for manual curation. This UniProtKB/Swiss-Prot gene list was obtained using the following search string: organism: ‘Homo sapiens [9606]’ AND reviewed:yes AND annotation:(type:disease cancer). Briefly, the manual curation protocol involved searching PubMed (40) using the gene name (including synonyms) with accompanying text ‘cancer’ and ‘expres-sion’. The curator then reviewed the title to shortlist art-icles which appear to contain gene expression information related to cancer and have full text available. Abstracts were then read to identify potential true positive articles. All such articles were downloaded and read to extract key information such as cancer type and expression informa-tion. All cancer types were then mapped to Disease Ontology terms (32) and added to the BioXpress database. To date, 536 papers have been filtered to maintain only those focusing on human cancer after reading the ‘Abstract’ and ‘Introduction’. Among this subset, only papers including direct evidence reflecting gene expression
Table 1.Statistics of data collected in BioXpress
Source Data type No. of samples/individualsa Tumor/normal
TCGA Raw read count 1320/660b Tumor and normal
ICGC and TCGA Raw read count 6397/6324 Tumor
Expression Atlas baseline Normalized count 1/1 Normal
Literature Published literature Not applicable (135 publications) Tumor and normal comparison aTypically, each patient contains more than one sequencing sample. Therefore, we provide the number of both samples and individuals.
bThe number of patients is collected from TCGA, ICGC and Expression Atlas baseline projects. Some TCGA patient IDs overlap with the ICGC patient IDs.
at GWU on October 14, 2015
http://database.oxfordjournals.org/
differentiation between normal and cancer tissues were kept. Filtering then continued with further inspection of the ‘Materials and Method’ and ‘Results’ sections of each paper. Some cancer-type abbreviations were taken from the TCGA Code Table Report (https://tcga-data.nci.nih. gov/datareports/codeTablesReport.htm), while the rest of them were named using the following conventions: first three letters from the first word and the last two let-ters from the second word. Thus, if the cancer types have a single word name, all five letters come from this word. In the event of duplication, letters from the third or fourth words are used to distinguish between types. Curators cross-check all manual curation processes. In total, 135 papers concerning 87 genes have been added to the BioXpress database through biocuration (supplementary Table S2).
Data Normalization and Analysis
DEseq method is regarded as one of the most robust RNA-seq normalization methods (37). In the BioXpress pipeline, raw counts data were normalized by DEseq method fol-lowed by differentially expressed gene analysis. To com-pare non-paired samples with normalized results from DEseq pipeline, the DEseq normalization method was used [Parameters: library(‘DESeq’), cds¼newCountDataSet (data,condition), cds¼estimateSizeFactors(cds), result¼
counts(cds,normalized¼TRUE)]. For differential expres-sion analysis, gene expresexpres-sion was normalized based on each patient, and case and control were considered to-gether. For tumor expression, all samples were collectively analyzed across different cancer types and then normal-ized. Heat map and clustering analysis were performed using the ‘heatmap’ function from the R package (http:// www.R-project.org/).
Usage and Utility
Scientists can find querying datasets useful to identify ex-pression levels between disease and normal pairs to dis-cover differential expression for a gene. They may also want to research on potential biomarkers or pathways that lead to tumor formation or want to explore the over-all expression of specific genes across multiple cancer types. Users can search BioXpress using HGNC-approved gene symbols (HUGO Gene Nomenclature Committee), UniProtKB/Swiss-Prot accessions or RefSeq accessions. Differentially expressed genes for a specific cancer type can also be retrieved. Additionally, all data in BioXpress, including lists of genes significantly differen-tially expressed in two or more cancer types, can be downloaded.
Searching using gene name (gene/protein-centric
search)
A search using the HGNC-approved gene symbol or UniProt/RefSeq accession retrieves differential expression information (cancer vs. normal), tumor-only expression data (where normal samples are not available) and baseline expression information from normal human tissues (Illumina Human Body Map Project). The example below provides an overview of a gene/protein-centric search.
Differential expression
The abnormal spindle-like microcephaly-associated (ASPM) gene is highly expressed in several tumor cell lines (41) and cancers (42, 43). Searching the BioXpress data-base using the gene ASPM users can retrieve the differential expression profile of this gene in different cancers. For ASPM gene, we can clearly see that this gene appears to be over-expressed in almost all cancers. Figure 2provides a view of the BioXpress interface where the Differential Expression tab on the top menu bar is selected, and below it ‘ASPM Expression Profile’ is shown. The default view provides expression frequency (over- or under-expression) in the patients. The number of patients for a particular can-cer type,Pvalue and a variety of additional information is available in the table below which can be downloaded. Full cancer names are available on clicking the cancer ab-breviations in figure and additional details about the data can be viewed by clicking the ‘Table column description’ link. All columns can be sorted and users can send an e-mail to the help desk with comments about a specific data element by clicking on the envelope link available from each row.
The tab at the top of the stacked bar chart provides an alternate view where users can see the frequency (number of patients) of significantly over- or under-expressed genes (based on aPvalue cutoff of 0.05). For ASPM, on clicking the Significant/Freq tab, we can see that this gene is signifi-cantly over-expressed in more than 25% of the patients in several cancers. For example, ASPM is over-expressed in breast invasive carcinoma (DOID:3459; 113 patients), lung adenocarcinoma (DOID:3907; 50 patients) and others. Combining the stacked bar frequency expression (Regulation/Freq) and the Significant/Freq, users can get a complete overview of the differential expression of a gene in all cancer types in the database.
Tumor expression
Clicking on the Tumor Expression tab on the top menu bar shows the expression profile for the ASPM gene from all pa-tient samples without paired normal data. Although ICGC does not currently collect any paired data, tumor-only
Database, Vol. 2015, Article ID bav019 Page 5 of 13
at GWU on October 14, 2015
http://database.oxfordjournals.org/
Figure 2. Snapshot of BioXpress interface. The stacked bar chart displays the percent of individuals with over-or under-expression of the ASPM gene. at GWU on October 14, 2015 http://database.oxfordjournals.org/ Downloaded from
expression data can provide an overview of the expression of a specific gene in different cancer types and can be used in conjunction with differential and baseline expression data to better understand the comprehensive expression profile of a gene. The box plot provides the minimum lower quartile, me-dian upper quartile and maximum expression value, and therefore provides a snapshot of the distribution of expression of a gene in all patients with a specific cancer. For the ASPM gene, we see that for cervical squamous cell carcinoma (CESC), the minimum, maximum and the lower and upper quartile are above the theoretical mean for all cancer types which could indicate that for CESC this gene has less variabil-ity in terms of expression in the patients and is expressed at a higher level compared with other cancers. Therefore, the box plot allows the user to identify cancer types where the lower and the upper quartile are short, signifying homogeneity in the expression of the gene for that specific cancer. The table below the box plot provides details such as UniProtKB acces-sion, RefSeq accession and number of samples.
Baseline expression
Clicking the Baseline Expression tab for ASPM gene shows the heatmap with testis being the only tissue with increased expression of ASPM. It has been known for some time that ASPM is over-expressed in testis (41,44), although the pre-cise function of this gene in testis development is still un-known (45).
Searching using cancer type (cancer type
centric search)
Users may want to retrieve a list of genes that are signifi-cantly differentially expressed in a specific cancer. From the Home page, clicking on the Search by cancer type tab allows users to select the cancer type of interest and then retrieve genes which are either over- or under-expressed. For example, selecting lung adenocarcinoma and the de-fault settings (over-expressed; adjusted P value and
P>0.1) retrieves the 2089 genes, out of which the top ex-pressed gene is FAM83A (Protein FAM83A; also called Tumor antigen BJ-TSA-9). It is interesting to note that FAM83A is considered a promising tumor biomarker of lung cancer (41). Similarly, the second highly expressed gene GREM1 (Gremlin) is also known to be over-ex-pressed in lung cancer (46).
Pan-cancer analysis
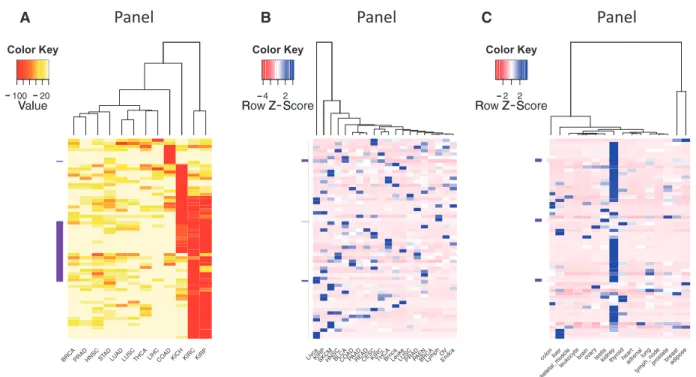
The ability to sort, filter and further analyze the gene ex-pression data collected in BioXpress allows users to com-pare and contrast expression of genes across many patients and cancer types. In addition to listing the genes that are significantly differentially expressed in multiple cancers (as described in the previous paragraph),Figure 3provides an overview of the types of analysis that users can perform
A B C
Figure 3.Clustering and heatmap view of the top 50 differentially expressed genes as reported by BioXpress. Although these graphics were gener-ated using external tools, the emphasis here is the ability of BioXpress to sort through large amounts of data and return candidate subsets for subse-quent analysis. (A) Clustering of these genes in different cancer types based on the frequency of patients who have significant differential expression. Darker colors indicate a higher percentage of patients with such differential expression. (B) For genes which do not have normal samples, the heat-map shows clustering based on normalized count. Darker colors indicate a higher expression level. (C) Clustering based on baseline expression for the 50 genes in different tissues. Darker colors indicate higher expression level.
Database, Vol. 2015, Article ID bav019 Page 7 of 13
at GWU on October 14, 2015
http://database.oxfordjournals.org/
using the downloaded data.Figure 3A heatmap and clus-tering were performed based on the percent of patients who have significantly differentially expressed genes. Clustering of samples or datasets across multiple cancer types, known as one type of pan-cancer analysis, is widely conducted by the community, especially by TCGA Research Network (47, 48), and is of great interest from the aspect of personalized and translational medicine. To select genes that have strong association with transcrip-tomic changes of tumors, we picked the top 50 genes that are differentially expressed in the highest percent of sam-ples. The darker colors in the figure show that several can-cer types have genes which are differentially expressed in a majority of the patients (red boxes). The clustering based on the heatmap indicates that several cancer types have similar patterns [kidney renal clear cell carcinoma (KIRC) and kidney renal papillary cell carcinoma (KIRP); head and neck squamous cell carcinoma (HNSC) and stomach adenocarcinoma (STAD); lung squamous cell carcinoma (LUSC) and pancreatic adenocarcinoma (PAAD); thyroid carcinoma (THCA) and lung adenocarcinoma (LUAD)].
Figure 3B shows analysis results of expression data where no normal samples are available. The figure provides a view of cancer types that cluster together based on gene ex-pression from cancer samples only. On the basis of the color distribution, it can be seen that several cancers have similar expression patterns and hence cluster together: breast cancer (BRCA) and lymphoma (Lymph); ovarian cancer (OV) and endometrial cancer (Endca); close to them are endocrine pancreas cancer (PAEN), prostate adenocarcinoma (PRAD), lung squamous cell carcinoma (LUSC), leukemia (Leuke) and brain cancer (Braca); KIRC and THCA; colon adenocarcinoma (COAD), PAAD and rectum adenocarcinoma (READ) are also clustered. Liver cancer (Livca) shows a distinct gene expression profile with all other cancer types listed based on the selected genes. Figure 3C provides a view of tissues which have similar expression patterns.
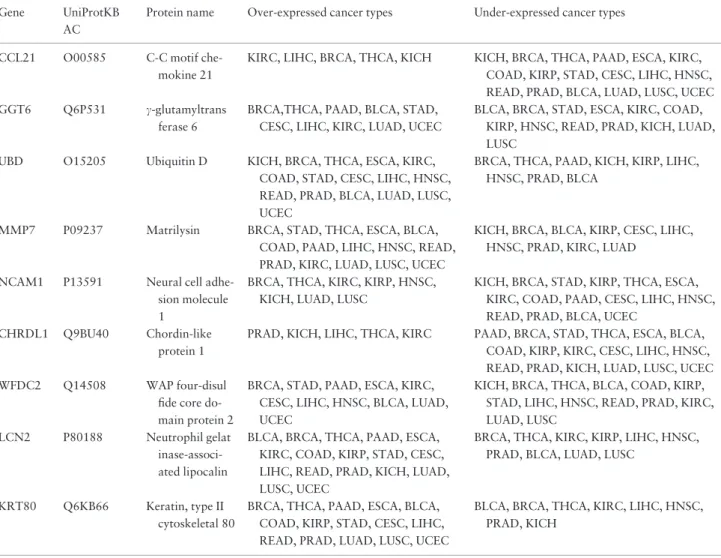
Collection of expression data from multiple cancers as presented insupplementary Table S1allow us to identify genes that are differentially expressed in more than one cancer type. For example, from this table we can see that nine genes are differentially expressed in all cancer types (Table 2). It is important to note that in this particular case we do not consider the number of patients who have these genes over- or under-expressed. Therefore, each gene and its expression in a cancer type needs to be carefully eval-uated on a case-by-case basis if one is interested in identify-ing genes which are differentially expressed in majority of the patients (please see examples in the next paragraph). It is interesting to note that five of the nine proteins are glycoproteins, two are phosphoproteins, six of them are
secreted and seven are involved in biological process regu-lation (based on UniProtKB keyword and Gene Ontology annotation). This type of filtering and sorting can reveal ideal candidates for further evaluation as diagnostic or therapeutic targets. Furthermore, literature evidence re-veals that eight of the 9 genes inTable 2are genes known to be associated with cancer. For example, the first gene listed in Table 2, CCL21, participates in leukocytes and cancer cell migration through the CCR7/CCL19 (CCL21) axis to promote the growth and metastasis of various tumors such as breast cancer, melanoma, non-small cell lung cancer, head and neck, gastrointestinal and hemato-logic cancer (49). Second,c-glutamyltransferase is involved in cellular glutathione homeostasis, its expression is often significantly increased in human tumors and its role in tumor progression, invasion and drug resistance has been repeatedly suggested (50). Third, alterations in the ubiqui-tin system have direct or indirect roles in the genesis of various tumors due to defects in the ubiquitin-dependent proteolysis of critical house-keeping genes or cell–cycle elements—p53 is a good example (51). The next genes, Matrilysin (MMP7), are frequently over-expressed in human cancer tissues and are associated with cancer pro-gression (52) and NCAM1 has been demonstrated to be one of the immunohistochemical markers for lung neuro-endocrine tumors diagnosis (53), its expression level is up-regulated in large cell lung tumor cell line H460-M (54). CHRDL1 is down-regulated (79–89% of 19) in follicular thyroid carcinoma (55) and the gene, WFDC2 (HE4), con-tains dispersed evidence: it has been demonstrated to be a biomarker for ovarian carcinoma (56) and it is known to be over-expressed in a range of different cell lines including ovarian, renal, lung, colon and breast lines, and cancers such as endometrial adenocarcinomas (57, 58) and lung adenocarcinoma (59). The next gene, LCN2, has a wide range of functions in different types of cancers (thyroid, pancreatic, breast and colon cancer), and it is a potential diagnostic and prognostic marker in both benign and ma-lignant human diseases (60). Finally, KRT80 and its role in cancer is not well studied although there is some evidence that this gene is differentially expressed in certain types of cancer (61, 62). In addition to this list, a separate, pre-computed table which lists all genes and their normalized expression values in tumors across all cancer types is also provided for download. This table can be used to identify genes which have, e.g. high variability in expression in cer-tain cancers or low variability (possible house-keeping genes).
As mentioned above, one of the key questions in pan-cancer analysis of gene expression is—are there any genes which are significantly over- or under-expressed in mul-tiple cancers in a large number of the patients.
at GWU on October 14, 2015
http://database.oxfordjournals.org/
Table 2.Genes significantly differentially expressed in tumor and normal samples in all cancer types in one or more patients Gene UniProtKB
AC
Protein name Over-expressed cancer types Under-expressed cancer types
CCL21 O00585 C-C motif che-mokine 21
KIRC, LIHC, BRCA, THCA, KICH KICH, BRCA, THCA, PAAD, ESCA, KIRC, COAD, KIRP, STAD, CESC, LIHC, HNSC, READ, PRAD, BLCA, LUAD, LUSC, UCEC GGT6 Q6P531 c-glutamyltrans
ferase 6
BRCA,THCA, PAAD, BLCA, STAD, CESC, LIHC, KIRC, LUAD, UCEC
BLCA, BRCA, STAD, ESCA, KIRC, COAD, KIRP, HNSC, READ, PRAD, KICH, LUAD, LUSC
UBD O15205 Ubiquitin D KICH, BRCA, THCA, ESCA, KIRC, COAD, STAD, CESC, LIHC, HNSC, READ, PRAD, BLCA, LUAD, LUSC, UCEC
BRCA, THCA, PAAD, KICH, KIRP, LIHC, HNSC, PRAD, BLCA
MMP7 P09237 Matrilysin BRCA, STAD, THCA, ESCA, BLCA, COAD, PAAD, LIHC, HNSC, READ, PRAD, KIRC, LUAD, LUSC, UCEC
KICH, BRCA, BLCA, KIRP, CESC, LIHC, HNSC, PRAD, KIRC, LUAD
NCAM1 P13591 Neural cell adhe-sion molecule 1
BRCA, THCA, KIRC, KIRP, HNSC, KICH, LUAD, LUSC
KICH, BRCA, STAD, KIRP, THCA, ESCA, KIRC, COAD, PAAD, CESC, LIHC, HNSC, READ, PRAD, BLCA, UCEC
CHRDL1 Q9BU40 Chordin-like protein 1
PRAD, KICH, LIHC, THCA, KIRC PAAD, BRCA, STAD, THCA, ESCA, BLCA, COAD, KIRP, KIRC, CESC, LIHC, HNSC, READ, PRAD, KICH, LUAD, LUSC, UCEC WFDC2 Q14508 WAP four-disul
fide core do-main protein 2
BRCA, STAD, PAAD, ESCA, KIRC, CESC, LIHC, HNSC, BLCA, LUAD, UCEC
KICH, BRCA, THCA, BLCA, COAD, KIRP, STAD, LIHC, HNSC, READ, PRAD, KIRC, LUAD, LUSC
LCN2 P80188 Neutrophil gelat inase-associ-ated lipocalin
BLCA, BRCA, THCA, PAAD, ESCA, KIRC, COAD, KIRP, STAD, CESC, LIHC, READ, PRAD, KICH, LUAD, LUSC, UCEC
BRCA, THCA, KIRC, KIRP, LIHC, HNSC, PRAD, BLCA, LUAD, LUSC
KRT80 Q6KB66 Keratin, type II cytoskeletal 80
BRCA, THCA, PAAD, ESCA, BLCA, COAD, KIRP, STAD, CESC, LIHC, READ, PRAD, LUAD, LUSC, UCEC
BLCA, BRCA, THCA, KIRC, LIHC, HNSC, PRAD, KICH
LIHC¼liver hepatocellular carcinoma; BLCA¼bladder urothelial carcinoma; KICH¼kidney chromophobe; UCEC¼uterine corpus endometrial carcinoma; ESCA¼esophageal carcinoma; CESC¼cervical squamous cell carcinoma and endocervical adenocarcinoma.
Table 3.Top five genes significantly differentially expressed in tumor and normal samples in>50% of the patients Gene UniProtKB AC Protein name Over-expressed cancer types Under-expressed cancer types COL10A1 Q03692 Collagen alpha-1(X) chain BRCA, STAD, BLCA, COAD, HNSC,
LUAD
COL11A1 P12107 Collagen alpha-1(XI) chain BRCA, COAD, HNSC, LUAD, LUSC,
MMP11 P24347 Stromelysin-3 BRCA, BLCA, COAD, HNSC, LUAD
TMPRSS4 Q9NRS4 Transmembrane protease serine 4
KIRC, LUAD, LUSC, THCA, UCEC MMP1 P03956 Interstitial collagenase COAD, LUAD, LUSC, HNSC
ADH1B P00325 Alcohol dehydrogenase 1B BLCA, THCA, KIRC, COAD, KIRP,
HNSC, KICH, LUSC, UCEC
MT1H P80294 Metallothionein-1H KICH, KIRC, KIRP, LIHC, THCA
MT1G P13640 Metallothionein-1G KICH, KIRC, KIRP, LIHC, THCA
CHRDL1 Q9BU40 Chordin-like protein 1 BLCA, KICH, KIRC, THCA, UCEC
CA4 P22748 Carbonic anhydrase 4 BRCA, COAD, KIRP, LUAD, LUSC
The genes were sorted based on the number of cancer types they were differentially expressed in.
LIHC¼liver hepatocellular carcinoma; BLCA¼bladder urothelial carcinoma; KICH¼kidney chromophobe; CESC¼cervical squamous cell carcinoma and endocervical adenocarcinoma.
Database, Vol. 2015, Article ID bav019 Page 9 of 13
at GWU on October 14, 2015
http://database.oxfordjournals.org/
Supplementary Tables S3andS4provide the list of genes that are significantly differentially expressed in greater than 30% and 50% of the patients.Table 3lists the top 5 genes (sorted based on the number of cancer types it is dif-ferentially expressed in) that are significantly over- and under-expressed in more than 50% of the patients. The first gene COL11A1 is known to be over-expressed in various epithelial cancers and is prominently correlated with invasion and metastasis (63). Its over-expression is associated with colorectal cancer (64), non-small cell lung cancer (65) and several other cancers (66). The next gene MMP11 over-expression is correlated with the aggression and invasion status of various types of carcinoma and is almost absent in normal adult organs and can be con-sidered as a biomarker for diagnosis and prognosis (67,
68). TMPRSS4 is highly expressed in pancreatic, colon, lung and gastric cancers, and is also expressed in a wide range of human cancer cell lines and has been demon-strated to facilitate the invasion, migration and metastasis of tumor cells (69,70). MMP1 is highly expressed in gas-tric carcinoma, breast cancer, lung and other cancers (71–78). ADH1B is the first gene in the table that is known to be under-expressed in multiple cancers such as oral tongue squamous cell carcinoma (79) and intrahe-patic cholangiocarcinoma (80). MT1H is under-expressed in adenoid cystic carcinoma of salivary gland, prostate and liver cancer due to hypermethylation of its promoter (81,82). In the next gene MT1G, the promoter is hyper-methylated which results in its down-regulation in hepato-blastoma and prostate cancer (83, 84). CHRDL1 interestingly is under-expressed in colorectal cancer (85) while over-expressed in pancreatic cancer (86) and for CA4 there is currently no publication associated with ex-pression of these gene in cancers. We believe that filtering and sorting of data in BioXpress will help researchers to focus on expression profiles of genes which currently have very little published information. Another gene SFRP1 which is also found to be under-expressed in our dataset in five cancers (>50% of the patients) is known to be under-expressed in nine cancer types: cancers of the kid-ney, stomach, small intestine, pancreas, parathyroid, ad-renal gland, gall bladder, endometrium, ad-renal cell carcinoma and testis (87).
Downloadable files
Websites are ideal for performing gene and cancer-centric searches as described above. Some users may wish to per-form large-scale analysis or filter the data based on add-itional parameters. To accommodate such users, all data can be downloaded in tab-delimited format. Additionally, a table of significantly under- or over-expressed genes in
one or more patients is provided that has the following col-umns: gene name, UniProtKB accession, protein name, cancer types where the gene is expressed and count of the number of cancer types (supplementary Table S1). This table can be used to quickly identify genes that are differ-entially expressed in multiple cancer types in one or more patients. Additional downloads include PubMed Identifiers (PMIDs) and accessions that were manually curated (supplementary Table S2) and all data associated with differential and tumor-only expression. Future plans include addition of additional tables based on user requests.
Future Perspective
BioXpress will be updated every 6 months and detailed statistics for each release will be provided. Such statistics will allow users to track changes in the database over time. We will also integrate BioXpress in the High-performance Integrated Virtual Environment (HIVE) NGS and prote-omics analysis platform. This integration will allow users to upload RNA-seq data, map reads to the reference gen-ome using HIVE Hexagon (88), perform expression ana-lysis and directly compare results with those available from BioXpress. As proteomic data become available for differ-ent cancer types through programs similar to the Clinical Proteomic Tumor Analysis Consortium (CPTAC) (89), we will map such data to the genes. We also plan to augment both data and function based on input from our users. Some potential new features include the following: add-ition of cancer subtypes; linking BioXpress to BioMuta (33) to obtain comprehensive view of expression as it may relate to mutation; integration of clinical annotations; in-clusion of additional graphical elements and more. Our preliminary results show that there is a correlation between mutation density of a gene and its expression in certain types of cancer. We intend to explore this further in our fu-ture studies.
Supplementary Data
Supplementary dataare available atDatabaseOnline.
Acknowledgments
We want to thank J. Torcivia and K. Smith for useful comments.
Funding
This project was partially funded by NCI/EDRN Associate Member contract #156620. Funding open access charge: RM research funds.
Conflict of interest.None declared.
at GWU on October 14, 2015
http://database.oxfordjournals.org/
References
1. Sotiriou,C. and Piccart,M.J. (2007) Taking gene-expression profiling to the clinic: when will molecular signatures become relevant to patient care?Nat. Rev. Cancer,7, 545–553. 2. Normanno,N., De Luca,A., Carotenuto,P. et al. (2009)
Prognostic applications of gene expression signatures in breast cancer.Oncology,77(Suppl. 1), 2–8.
3. Mehta,S., Shelling,A., Muthukaruppan,A. et al. (2010) Predictive and prognostic molecular markers for cancer medi-cine.Ther. Adv. Med. Oncol.,2, 125–148.
4. van’t Veer,L.J. and Bernards,R. (2008) Enabling personalized cancer medicine through analysis of gene-expression patterns. Nature,452, 564–570.
5. van ’t Veer,L.J., Dai,H., van de Vijver,M.J.et al.(2002) Gene ex-pression profiling predicts clinical outcome of breast cancer. Nature,415, 530–536.
6. Golub,T.R., Slonim,D.K., Tamayo,P. et al. (1999) Molecular classification of cancer: class discovery and class prediction by gene expression monitoring. Science, 286, 531–537.
7. Wang,Y., Klijn,J.G., Zhang,Y. et al. (2005) Gene-expression profiles to predict distant metastasis of lymph-node-negative pri-mary breast cancer.Lancet,365, 671–679.
8. Ntzani,E.E. and Ioannidis,J.P. (2003) Predictive ability of DNA microarrays for cancer outcomes and correlates: an empirical as-sessment.Lancet,362, 1439–1444.
9. Chung,C.H., Bernard,P.S. and Perou,C.M. (2002) Molecular portraits and the family tree of cancer.Nat. Genet.,32(Suppl), 533–540.
10. Editorial. (2002) Gene expression and cancer: getting it together. Nat. Genet.,31, 1–2.
11. Hanahan,D. and Weinberg,R.A. (2000) The hallmarks of can-cer.Cell,100, 57–70.
12. Zhang,J., Baran,J., Cros,A.et al.(2011) International Cancer Genome Consortium Data Portal—a one-stop shop for cancer genomics data.Database (Oxford),2011, bar026.
13. Hoadley,K.A., Yau,C., Wolf,D.M.et al.(2014) Multiplatform analysis of 12 cancer types reveals molecular classification within and across tissues of origin.Cell,158, 929–944.
14. Hudson,T.J., Anderson,W., Artez,A. et al. (2010) International network of cancer genome projects. Nature,
464, 993–998.
15. Shendure,J. (2008) The beginning of the end for microarrays? Nat. Methods,5, 585–587.
16. Mortazavi,A., Williams,B.A., McCue,K.et al. (2008) Mapping and quantifying mammalian transcriptomes by RNA-Seq.Nat. Methods,5, 621–628.
17. Zhao,S., Fung-Leung,W.P., Bittner,A.et al. (2014) Comparison of RNA-Seq and microarray in transcriptome profiling of acti-vated T cells.PLoS One,9, e78644.
18. Haas,B.J. and Zody,M.C. (2010) Advancing RNA-Seq analysis. Nat. Biotechnol.,28, 421–423.
19. Quinn,E.M., Cormican,P., Kenny,E.M. et al. (2013) Development of strategies for SNP detection in RNA-seq data: application to lymphoblastoid cell lines and evaluation using 1000 genomes data.PLoS One,8, e58815.
20. McGettigan,P.A. (2013) Transcriptomics in the RNA-seq era. Curr. Opin. Chem. Biol.,17, 4–11.
21. Saliba,A.E., Westermann,A.J., Gorski,S.A.et al. (2014) Single-cell RNA-seq: advances and future challenges. Nucleic Acids Res.,42, 8845–8860.
22. Miller,A.C., Obholzer,N.D., Shah,A.N. et al. (2013) RNA-seq-based mapping and candidate identification of muta-tions from forward genetic screens. Genome Res., 23, 679–686.
23. Soon,W.W., Hariharan,M. and Snyder,M.P. (2013) High-throughput sequencing for biology and medicine. Mol. Syst. Biol.,9, 640.
24. Brazma,A., Hingamp,P., Quackenbush,J. et al. (2001) Minimum information about a microarray experiment (MIAME)-toward standards for microarray data.Nat. Genet.,
29, 365–371.
25. Barrett,T., Wilhite,S.E., Ledoux,P. et al. (2013) NCBI GEO: archive for functional genomics data sets—update. Nucleic Acids Res.,41, D991–D995.
26. Parkinson,H., Sarkans,U., Kolesnikov,N. et al. (2011) ArrayExpress update—an archive of microarray and high-throughput sequencing-based functional genomics experiments. Nucleic Acids Res.,39, D1002–D1004.
27. Kato,K., Yamashita,R., Matoba,R.et al. (2005) Cancer gene ex-pression database (CGED): a database for gene exex-pression profil-ing with accompanyprofil-ing clinical information of human cancer tissues.Nucleic Acids Res.,33, D533–D536.
28. Shin,G., Kang,T.W., Yang,S.et al. (2011) GENT: gene expres-sion database of normal and tumor tissues.Cancer Inform.,10, 149–157.
29. Rhodes,D.R., Kalyana-Sundaram,S., Mahavisno,V. et al. (2007) Oncomine 3.0: genes, pathways, and networks in a col-lection of 18,000 cancer gene expression profiles.Neoplasia,9, 166–180.
30. Kapushesky,M., Emam,I., Holloway,E.et al. (2010) Gene ex-pression atlas at the European bioinformatics institute.Nucleic Acids Res.,38, D690–D698.
31. Gao,J., Aksoy,B.A., Dogrusoz,U.et al.(2013) Integrative ana-lysis of complex cancer genomics and clinical profiles using the cBioPortal.Sci. Signal.,6, pl1.
32. Schriml,L.M., Arze,C., Nadendla,S.et al. (2012) Disease ontol-ogy: a backbone for disease semantic integration.Nucleic Acids Res.,40, D940–D946.
33. Wu,T.J., Shamsaddini,A., Pan,Y.et al. (2014) A framework for organizing cancer-related variations from existing databases, publications and NGS data using a High-performance Integrated Virtual Environment (HIVE). Database (Oxford), 2014, bau022.
34. Pan,Y., Karagiannis,K., Zhang,H.et al. (2014) Human germline and pan-cancer variomes and their distinct functional profiles. Nucleic Acids Res.,42(18), 11570–88.
35. Cole,C., Krampis,K., Karagiannis,K. et al. (2014) Non-syn-onymous variations in cancer and their effects on the human proteome: workflow for NGS data biocuration and proteome-wide analysis of TCGA data.BMC Bioinformatics,
15, 28.
36. Anders,S. and Huber,W. (2010) Differential expression analysis for sequence count data.Genome Biol.,11, R106.
37. Dillies,M.A., Rau,A., Aubert,J.et al.(2013) A comprehensive evaluation of normalization methods for Illumina
high-Database, Vol. 2015, Article ID bav019 Page 11 of 13
at GWU on October 14, 2015
http://database.oxfordjournals.org/
throughput RNA sequencing data analysis.Brief. Bioinform.,
14, 671–683.
38. R core team. (2014) A language and environment for statistical computing. R Foundation for Statistical Computing. Vienna, Austria. http://www.R-project.org/.
39. Futreal,P.A., Coin,L., Marshall,M. et al. (2004) A census of human cancer genes.Nat. Rev. Cancer,4, 177–183.
40. NCBI_Resource_Coordinators. (2014) Database resources of the National Center for Biotechnology Information. Nucleic Acids Res.,42, D7–D17.
41. Kouprina,N., Pavlicek,A., Collins,N.K.et al.(2005) The micro-cephaly ASPM gene is expressed in proliferating tissues and en-codes for a mitotic spindle protein. Hum. Mol. Genet., 14, 2155–2165.
42. Alsiary,R., Bruning-Richardson,A., Bond,J. et al. (2014) Deregulation of microcephalin and ASPM expression are corre-lated with epithelial ovarian cancer progression.PLoS One,9, e97059.
43. Hagemann,C., Anacker,J., Gerngras,S.et al. (2008) Expression analysis of the autosomal recessive primary microcephaly genes MCPH1 (microcephalin) and MCPH5 (ASPM, abnormal spindle-like, microcephaly associated) in human malignant gliomas. Oncology Rep.,20, 301–308.
44. Bond,J., Roberts,E., Springell,K. et al. (2005) A centrosomal mechanism involving CDK5RAP2 and CENPJ controls brain size.Nat. Genet.,37, 353–355.
45. Montgomery,S.H., Capellini,I., Venditti,C.et al. (2011) Adaptive evolution of four microcephaly genes and the evolution of brain size in anthropoid primates.Mol. Biol. Evol.,28, 625–638. 46. Mulvihill,M.S., Kwon,Y.W., Lee,S.et al. (2012) Gremlin is
over-expressed in lung adenocarcinoma and increases cell growth and proliferation in normal lung cells.PLoS One,7, e42264. 47. Weinstein,J.N., Collisson,E.A., Mills,G.B. et al. (2013) The
Cancer Genome Atlas Pan-Cancer analysis project.Nat. Genet.,
45, 1113–1120.
48. Ashworth,A. and Hudson,T.J. (2013) Genomics: comparisons across cancers.Nature,502, 306–307.
49. Chew,A.L., Tan,W.Y. and Khoo,B.Y. (2013) Potential combina-torial effects of recombinant atypical chemokine receptors in breast cancer cell invasion: a research perspective.Biomed. Rep.,
1, 185–192.
50. Pompella,A., De Tata,V., Paolicchi,A.et al. (2006) Expression of gamma-glutamyltransferase in cancer cells and its significance in drug resistance.Biochem. Pharmacol.,71, 231–238.
51. Hoeller,D., Hecker,C.M. and Dikic,I. (2006) Ubiquitin and ubiquitin-like proteins in cancer pathogenesis.Nat. Rev. Cancer,
6, 776–788.
52. Ii,M., Yamamoto,H., Adachi,Y.et al. (2006) Role of matrix metalloproteinase-7 (matrilysin) in human cancer invasion, apoptosis, growth, and angiogenesis. Exp. Biol. Med. (Maywood),231, 20–27.
53. Kashiwagi,K., Ishii,J., Sakaeda,M. (2012) Differences of molecu-lar expression mechanisms among neural cell adhesion molecule 1, synaptophysin, and chromogranin A in lung cancer cells. Pathol. Int.,62, 232–245.
54. de Lange,R., Dimoudis,N. and Weidle,U.H. (2003) Identification of genes associated with enhanced metastasis of a large cell lung carcinoma cell line.Anticancer Res.,23, 187–194.
55. Aldred,M.A., Ginn-Pease,M.E., Morrison,C.D. et al. (2003) Caveolin-1 and caveolin-2, together with three bone morpho-genetic protein-related genes, may encode novel tumor suppres-sors down-regulated in sporadic follicular thyroid carcinogenesis.Cancer Res.,63, 2864–2871.
56. Hellstrom,I., Raycraft,J., Hayden-Ledbetter,M.et al. (2003) The HE4 (WFDC2) protein is a biomarker for ovarian carcinoma. Cancer Res.,63, 3695–3700.
57. DeSouza,L.V., Grigull,J., Ghanny,S.et al. (2007) Endometrial carcinoma biomarker discovery and verification using differen-tially tagged clinical samples with multidimensional liquid chro-matography and tandem mass spectrometry. Mol. Cell. Proteomics,6, 1170-1182.
58. Drapkin,R., von Horsten,H.H., Lin,Y.et al. (2005) Human epi-didymis protein 4 (HE4) is a secreted glycoprotein that is overex-pressed by serous and endometrioid ovarian carcinomas.Cancer Res.,65, 2162–2169.
59. Yamashita,S., Tokuishi,K., Hashimoto,T. et al. (2011) Prognostic significance of HE4 expression in pulmonary adeno-carcinoma.Tumour Biol.,32, 265–271.
60. Chakraborty,S., Kaur,S., Guha,S.et al. (2012) The multifaceted roles of neutrophil gelatinase associated lipocalin (NGAL) in in-flammation and cancer. Biochim. Biophys. Acta, 1826, 129–169.
61. Abelson,S., Shamai,Y., Berger,L.et al. (2013) Niche-dependent gene expression profile of intratumoral heterogeneous ovarian cancer stem cell populations.PLoS One,8, e83651.
62. Bateman,N.W., Sun,M., Hood,B.L.et al. (2010) Defining central themes in breast cancer biology by differential proteomics: con-served regulation of cell spreading and focal adhesion kinase. J. Proteome Res.,9, 5311–5324.
63. Kim,H., Watkinson,J., Varadan,V. et al. (2010) Multi-cancer computational analysis reveals invasion-associated variant of desmoplastic reaction involving INHBA, THBS2 and COL11A1.BMC Med. Genomics,3, 51.
64. Fischer,H., Stenling,R., Rubio,C.et al. (2001) Colorectal car-cinogenesis is associated with stromal expression of COL11A1 and COL5A2.Carcinogenesis,22, 875–878.
65. Chong,I.W., Chang,M.Y., Chang,H.C.et al.(2006) Great po-tential of a panel of multiple hMTH1, SPD, ITGA11 and COL11A1 markers for diagnosis of patients with non-small cell lung cancer.Oncol. Rep.,16, 981–988.
66. Chapman,K.B., Prendes,M.J., Sternberg,H. et al. (2012) COL10A1 expression is elevated in diverse solid tumor types and is associated with tumor vasculature. Future Oncol, 8, 1031–1040.
67. Peruzzi,D., Mori,F., Conforti,A.et al. (2009) MMP11: a novel target antigen for cancer immunotherapy.Clin. Cancer Res.,15, 4104–4113.
68. Yang,Y.H., Deng,H., Li,W.M.et al. (2008) Identification of ma-trix metalloproteinase 11 as a predictive tumor marker in serum based on gene expression profiling.Clin. Cancer Res.,14, 74–81. 69. Jung,H., Lee,K.P., Park,S.J.et al.(2008) TMPRSS4 promotes
in-vasion, migration and metastasis of human tumor cells by facili-tating an epithelial-mesenchymal transition. Oncogene, 27, 2635–2647.
70. Sercu,S., Zhang,L. and Merregaert,J. (2008) The extra-cellular matrix protein 1: its molecular interaction
at GWU on October 14, 2015
http://database.oxfordjournals.org/
and implication in tumor progression. Cancer Invest., 26, 375–384.
71. Nomura,H., Fujimoto,N., Seiki,M.,et al. (1996) Enhanced pro-duction of matrix metalloproteinases and activation of matrix metalloproteinase 2 (gelatinase A) in human gastric carcinomas. Int. J. Cancer.,69, 9–16.
72. Przybylowska,K., Kluczna,A., Zadrozny,M. et al. (2006) Polymorphisms of the promoter regions of matrix metalloprotei-nases genes MMP-1 and MMP-9 in breast cancer.Breast Cancer Res. Treat.,95, 65–72.
73. Minn,A.J., Gupta,G.P., Siegel, P.M.,et al. (2005) Genes that me-diate breast cancer metastasis to lung.Nature,436, 518–524. 74. Overall,C.M. and Kleifeld,O. (2006) Tumour microenvironment—
opinion: validating matrix metalloproteinases as drug targets and anti-targets for cancer therapy.Nat. Rev. Cancer,6, 227–239. 75. Xiao,T., Ying,W., Li,L.et al.(2005) An approach to studying
lung cancer-related proteins in human blood. Mol. Cell. Proteomics,4, 1480–1486.
76. Zhu,Y., Spitz,M.R., Lei,L.et al. (2001) A single nucleotide poly-morphism in the matrix metalloproteinase-1 promoter enhances lung cancer susceptibility.Cancer Res.,61, 7825–7829. 77. Sunami,E., Tsuno,N., Osada,T.et al. (2000) MMP-1 is a
prog-nostic marker for hematogenous metastasis of colorectal cancer. Oncologist,5, 108–114.
78. Murray,G.I., Duncan,M.E., O’Neil,P.et al. (1996) Matrix met-alloproteinase-1 is associated with poor prognosis in colorectal cancer.Nat. Med.,2, 461–462.
79. Ye,H., Yu,T., Temam,S.et al. (2008) Transcriptomic dissection of tongue squamous cell carcinoma.BMC Genomics,9, 69. 80. Wang,A.G., Yoon,S.Y., Oh,J.H.et al.(2006) Identification of
intrahepatic cholangiocarcinoma related genes by comparison with normal liver tissues using expressed sequence tags. Biochem. Biophys. Res. Commun.,345, 1022–1032.
81. Bell,A., Bell,D., Weber,R.S.et al. (2011) CpG island methylation profiling in human salivary gland adenoid cystic carcinoma. Cancer,117, 2898–2909.
82. Han,Y.C., Zheng,Z.L., Zuo,Z.H.et al. (2013) Metallothionein 1 h tumour suppressor activity in prostate cancer is mediated by euchromatin methyltransferase 1.J. Pathol.,230, 184–193.
83. Sakamoto,L.H., DE Camargo B.,Cajaiba M.,et al. (2010) MT1G hypermethylation: a potential prognostic marker for hep-atoblastoma.Pediatr. Res.,67, 387–393.
84. Henrique,R., Jeronimo,C., Hoque,M.O. et al. (2005) MT1G hypermethylation is associated with higher tumor stage in pros-tate cancer. Cancer Epidemiol. Biomarkers Prev., 14, 1274–1278.
85. Berdiel-Acer,M., Cuadras,D., Diaz-Maroto,N.G.et al.(2014) A monotonic and prognostic genomic signature from fibroblasts for colorectal cancer initiation, progression, and metastasis. Mol. Cancer Res.,12, 1254–1266.
86. Liu,J., Li,J., Li,H. et al. (2014) A comprehensive analysis of candidate genes and pathways in pancreatic cancer. Tumour Biol. doi: 10.1007/s13277-014-2787-y.
87. Dahl,E., Wiesmann,F., Woenckhaus,M.et al.(2007) Frequent loss of SFRP1 expression in multiple human solid tumours: asso-ciation with aberrant promoter methylation in renal cell carcin-oma.Oncogene,26, 5680–5691.
88. Santana-Quintero,L., Dingerdissen,H., Thierry-Mieg,J. et al. (2014) HIVE-hexagon: high-performance, parallelized sequence alignment for next-generation sequencing data analysis.PLoS One,9, e99033.
89. Ellis,M.J., Gillette,M., Carr,S.A.et al.(2013) Connecting gen-omic alterations to cancer biology with protegen-omics: the NCI Clinical Proteomic Tumor Analysis Consortium. Cancer Discov.,3, 1108–1112.
Database, Vol. 2015, Article ID bav019 Page 13 of 13
at GWU on October 14, 2015
http://database.oxfordjournals.org/