Contents lists available at ScienceDirect
Expert
Systems
with
Applications:
X
journal homepage: www.elsevier.com/locate/eswax
Mutual
information
inspired
feature
selection
using
kernel
canonical
correlation
analysis
Yan Wang
a, Shuang Cang
b ,∗, Hongnian Yu
c ,d ,∗∗a SchoolofElectricandInformationEngineering,ZhongyuanUniversityofTechnology,Zhengzhou,450007,China b SchoolofEconomicsandManagement,YanshanUniversity,Qinhuangdao066004,China
c SchoolofElectricalEngineering,ZhengzhouUniversity,Zhengzhou450001,China
d SchoolofEngineeringandtheBuiltEnvironment,EdinburghNapierUniversity,EdinburghEH105DT,UK
a
r
t
i
c
l
e
i
n
f
o
Articlehistory:
Received22September2018 Revised10July2019 Accepted2August2019 Availableonline3August2019
Keywords:
Featureselection Jointredundancy
Kernelcanonicalcorrelationanalysis Mutualinformation
IncompleteCholeskyDecomposition
a
b
s
t
r
a
c
t
Thispaperproposesafilter-basedfeature selection methodbycombiningthe measurementofkernel canonicalcorrelationanalysis(KCCA)withthemutualinformation(MI)-basedfeatureselectionmethod, named mRMJR-KCCA. The mRMJR-KCCA maximizes the relevance between the feature candidate and thetargetclasslabelsand simultaneouslyminimizes thejointredundancybetweenthefeature candi-dateandthealreadyselectedfeaturesintheviewofKCCA.Toimprovethecomputationefficiency,we adopt theIncompleteCholeskyDecomposition toapproximatethe kernelmatrix inimplementing the KCCAinmRMJR-KCCAforlarger-sizedatasets.Theproposed methodisexperimentallyevaluatedon13 classification-associateddatasets.Comparedwithcertainpopularfeatureselectionmethods,the experi-mentalresultsdemonstratethebetterperformanceoftheproposedmRMJR-KCCA.
© 2019 Published by Elsevier Ltd. ThisisanopenaccessarticleundertheCCBY-NC-NDlicense. (http://creativecommons.org/licenses/by-nc-nd/4.0/)
1. Introduction
Hand-crafted features, as the inputs for most machine learn-ing methods, are the quantitative and informative variables generated from the original data. Features can be time-domain (Machado, Gomes, Gamboa, Paixão, & Costa, 2015 ), frequency-domain(Suto, Oniga, & Sitar 2016 ),andhybrid(Montalto, Guerra, Bianchi, De Munari, & Ciampolini, 2015 ).The initial features usu-allyincluderedundancyormaybetoolargetobeefficientlydealt with,whichresultsinseveralissues,suchashighercomputational cost involved in learning, low learning efficiency, over-fitting on unseendata, etc. (Chu, Liao, Ng, & Zhang, 2013; Gheid & Challal, 2016; Guyon & Elisseeff, 2003 ). Feature selection (FS), commonly usedasadimensionalityreduction strategy,selectsa smaller-size subset oftheoriginal feature setbyremoving the redundantand irrelevant features. The selected features are part of the original features without any feature transformation and maintain the physical meanings of the original features. In this way, FS helps users acquire a better understanding of their data by figuring
∗ Correspondingauthor.
∗∗Correspondingauthorat:SchoolofEconomicsandManagement,Yanshan
Uni-versity,Qinhuangdao066004,ChinaandSchoolofEngineeringandtheBuilt Envi-ronment,EdinburghNapierUniversity,EdinburghEH105DT,UK.
E-mailaddresses:[email protected](S.Cang),[email protected](H.Yu).
out the mostinformative features, and hence to facilitate learn-ing, enhance the generation performance and improve model interpretability(Tang, Alelyani, & Liu, 2014 ).
Supervised FS methods, designed for the classification or re-gression tasks, are generally seen as the following types: filter (Gheid & Challal, 2016 ),wrapper(Bolón-Canedo, Sánchez-Maroño, & Alonso-Betanzos, 2013 ), and embedded approaches (Li, Cheng et al., 2017; Li, Zhu et al., 2017 ).Filtermethodsfilteroutirrelevant featuresbyevaluatingtherelevance ofafeaturetotheclasslabel using a specific selection criterion (Urbanowicz, Meeker, LaCava, Olson, & Moore, 2017 ). A filteralgorithm first ranks the original features based on the criterion, then selects the features with higherrankings.Theaboveselectionprocessisindependentofany classifier,computationally efficientandusually obtains atrade-off betweenperformanceandefficiency.
Selectioncriteriaplayacriticalroleinfilter-basedFS methods. A range of criteria has been explored in the past decades, such as distance measure, similarity, dependency, mutual information (MI), correlation measure, canonical correlation analysis (CCA) (Dessì et al., 2015; Gheid et al., 2016 , Li, Cheng et al., 2017; Li, Zhu et al., 2017 ).Asthelargest familyinfilter-basedFS methods, an MI-based FS algorithm measures the importance of a feature by its selection criterion withthe class label, assuming that the feature with a stronger correlation with the label will improve
https://doi.org/10.1016/j.eswax.2019.100014
classification performance. The popular algorithms in MI family areminimumRelevanceMaximumRelevance(mRMR)(Peng, Long, & Ding, 2005 ), JointMutualInformation(JMI) (Bennasar, Hicks, & Setchi, 2015 ), Conditional Mutual Information Maximum (CMIM) (Gao, Ver Steeg, & Galstyan, 2016 ), etc. MI considers the correla-tion of variables in pairs and then uses a simple approximation strategy,i.e., the sumortheaverage,to approximatethe relation betweenone variable(afeature oralabel) andmultidimensional variables (e.g., a set of features) (Brown, Pocock, Zhao, & Luján, 2012 ). As a result, the MI-based FS shares a common problem, i.e., it doesn’t fully consider the complementarity within a set ofvariables. Different fromthe MI, the CCA measures the linear correlation between two sets of multidimensional variables by maximizing the correlation coefficients between them. The CCA maynotextractausefuldescriptionofthedataduetoitslinearity. TheKCCA isanonlinearcorrelationmeasurementbymappingthe data into a higher-dimensional feature space with kernel tricks (Hardoon, Szedmak, & Shawe-Taylor, 2004 ). TheCCA ortheKCCA areeasily employedasafeatureselector(Mehrkanoon & Suykens, 2017; Yoshida, Yoshimoto, & Doya, 2017 ).
Inspired by MI-based FS methods and CCA-based measure-ments, this paper proposes and implements a new FS method, named mRMJR-KCCA.The mRMJR-KCCA maximizes the relevance between the feature candidate and the class labels and simul-taneously minimizes the joint redundancy between the feature candidate and the already selected features by using KCCA. The proposed mRMJR-KCCA is experimentally evaluated over the 10 classification–relatedbenchmarkdatasetsfromUCI1 andourthree ground-truthdatasetsinvolving17 dailyactivities from21 volun-teers.WealsocomparemRMJR-KCCAwithotheravailablepopular FS methods, including MCR-CCA and mRMR-CCA (Kaya, Eyben, Salah, & Schuller, 2014 ),Autoencoder(Wang, 2016 ),SparseFiltering (Ngiam, Chen, Bhaskar, Koh, & Ng, 2011 ), fourMI-basedmethods (Brown et al., 2012 ).The contributions ofthis paperare summa-rizedas (1):mRMR uses the approximation of sumoperation
when measuring the redundancy between the feature candidate andthe already selected features in pairs, which somehow does notfullyconsiderthecomplementaritywithinthealreadyselected features.Ourproposed mRMJR-KCCAintroducesthemeasurement ofKCCA intomRMR,whichreplaces theapproximationofsumin mRMR with the KCCA analysis to measure the joint redundancy betweenthe feature candidateand the alreadyselected features. (2): We apply Incomplete Cholesky Decomposition (ICD) (Li, Bi, Kwok, & Lu, 2015 ) to reduce the dimensionality of the kernel matrix in the implementation of mRMJR-KCCA on the large-size groundtruth datasets.(3): We alsoinvestigate theimpact ofthe kernel parameter and the number of components decomposed fromthekernelmatrixbyICDontheclassificationaccuracies.
The rest of the paper is organized as follows. Section 2 de-scribes the fundamentals of MI and CCA and related studies. Section 3 presents the proposed method, mRMJR-KCCA, and its implementation. Section 4 givestheexperimental resultsandthe discussions.Theconclusionisprovidedin Section 5 .
2. Relatedworksandfundamentals
2.1.EntropyandMI-basedFS
This paper considers two groupsof FS methods, and thefirst oneistheMI-basedFS.TheMIisoneofthemosteffectivecriteria tomeasure thecorrelation betweenvariables. Letxandybe two discreterandom variables, bothx andy haveN observations,the
1 http://archive.ics.uci.edu/ml/.
MIbetweenxandyisdefinedas I
(
x;y)
=H(
y)
−H(
y|
x)
=x,y
p
(
x, y)
p(
x, y)
p
(
x)
p(
y)
(1) whereH(y)representstheentropyofywhichquantifiesthedegree ofuncertainty ina discrete ordiscretized random variable yand H(x|y) representsthe conditional entropyof xgiven y;p(.) isthe probability massfunction(Bennasar et al., 2015 ).The MIsignifies how much information x andy share, which is nonnegativeand equalszeroifxandyareindependent.TheminimumRedundancy MaximumRelevance(mRMR)algorithm(Peng et al., 2005 ),which directlyusesMItovaluetheredundancyandrelevanceofinvolved variables, is one of the most popular FS methods. The ranking criterionofthemRMRis JmRMR(
fk)
= max fl∈S,fk∈F−S I(
fk;C)
− 1|
S|
I(
fk;fl)
(2)where I(; ) is givenin Eq. (1) , fk is a feature candidate; F isthe
whole featureset; Sis thealready selectedfeature set; fl can be any feature in S; and C is the class labels. The second term in Eq. (2) considers the redundancy betweenthe feature candidate and any already selected features in terms of paired variables, which doesn’t fully consider the joint relevance and the condi-tionalredundancygiventhethirdormorevariables.Theimproved mutualinformationmeasurescandealwiththeMIbetweenthree variables, one ofwhich is ConditionalMutual Information Maxi-mization(CMIM)(Brown et al., 2012 ).Thecorresponding criterion oftheCMIMis
Jcmim
(
fk)
=I(
fk;C)
−max[I(
fk;fl)
−I(
fk;fl|
C)
] (3)where the additional term I(fk; fl|C) includes the redundancy giventhe class labels C compared withthe mRMR criterion. The other twotypicalMI-basedmethodsareJointMutualInformation (JMI) thatincludesthe complementaryinformationthat isshared between the feature candidate and the already selected features giventheclasslabels.ThecriterionofJMIisgivenin Eq. (4) below (Brown et al., 2012 ). Double Input SymmetricalRelevance (DISR) isthemodificationofJMIbyestimatingthenormalizationH(fk,fl; C).
JJMI
(
fk)
=max
fl∈S
I
(
fk, fl;C)
(4)where I(fk,fl; C) is the joint mutual information of variables fk, flandC.
2.2. CCAandKCCA
CCAstatisticallyfindsthecorrelationbetweentwosetsof ran-dom variables X and Y(Hotelling, 1936 ). Denote X=
(
x1,...xp)
∈ RN×p, Y=(
y1,...yq
)
∈RN×q. X and Ycan be two feature spaces,or a feature space and a label space. To obtain the correlation between the two sets of variables, CCA finds a linear projection uinthespaceofX,andalinearprojection vinthespaceofYto maximize the following sample correlation in Eq. (5) . Such that theprojecteddatauXandvYhaveamaximumcorrelation.
ρ
CCA=argmaxu∈Rp,v∈Rq
uXY
v
(
uXXu)
(
v
YYv
)
(5)CCA-based filter FS methods intend to use the correlation (measured by Eq. (5) ) between the two projections of the vari-able sets to figure out the most important original features. Kaya et al. (2014) propose two CCA-based FS methods. The first methodiscalledmRMR-CCA,whichreplacestheMIindicatorwith the CCA coefficient, as presented in Eq. (6) . The second term in Eq. (6) ischangedfromasumofpairedredundanciesin Eq. (2) to
redundancy which is handled once from multidimensional vari-ables.
JmRMR−CCA
(
fk)
=max[ρ
CCA(
fk;C)
−ρ
CCA(
fk;S)
] (6)where
ρ
CCA is given in Eq. (5) . The second method inKaya et al. (2014) istheMaximumCollectiveRelevance(MCR-CCA), similar to the JMI, which maximizesthe collective correlation of thefeaturecandidateandthealreadyselectedfeaturesagainstthe classlabels.ThecriterionoftheMCR-CCAis
JMCR−CCA
(
fk)
=max[ρ
CCA(
fk∪S;C)
] (7)The CCA describes the linear correlation between two sets of variables, which are often insufficient to reveal the highly non-linear correlation withmanyreal-world data(Wang et al., 2015 ). The KCCA provides a nonlinear extension of CCA, which catches the nonlinear correlation by mapping the data into a higher-dimensional feature spacebefore performing CCA (Sakar, Kursun, & Gurgen, 2012 ). The KCCA-applied correlation betweentwo sets ofrandom variables XandYis thusto identifythe weights
α
,β
thatmaximizeρ
KCCA=argmax α,βα
KXKYβ
(
α
KXKXα
)
(
β
KYKYβ
)
(8)whereKX=XXandKY=YY arethekernelmatrices
correspond-ing to the variable sets X and Y. However, the kernelized CCA problemin Eq. (8) causes an ill-posed inverseproblem, andthus a regularization approach is needed to construct a meaningful estimator of the canonical correlation (Ashad Alam & Fukumizu, 2015; Bach & Jordan, 2002 ).Theobjectivefunctionforregularized kernelCCAbecomes
ρ
KCCA=argmax α,βα
KXKYβ
(
α
KXKXα
+α
KXα
)
·(
β
KYKYβ
+β
KYβ
)
(9)where
isa regularizationparameterthat shouldbea smalland positivevalueandapproacheszerowithanincreasingsamplesize N(Lisanti, Masi, & Del Bimbo, 2014 ).
In KCCA, the inputs X=
{
xp}
1N and Y={
yq}
N1 caused kernelmatrix KX and KY are both withthe size of N×N. Thus, solving
Eq. (9) involvesaneigenvalueproblemofsizeN×N,whichis ex-pensivebothinmemory(storingthekernelmatrices)andintime with naively costs O(N3
)
(Wang & Livescu, 2015 ). To overcomethisissue,a rangeof kernelapproximation techniqueshavebeen proposedtoscaleupKCCA,includingsingularvaluedecomposition (SVD) (Chakraborty, Chatterjee, Dey, Ashour, & Hassanien, 2017 ), Nyström method (Patel, Goldstein, Dyer, Mirhoseini, & Baraniuk, 2016 ), Incomplete Cholesky Decomposition (ICD) (Li, Bi, Kwok, & Lu, 2015 ), and so on. After applying the above approximation methods,theefficiencyofcalculatingKCCAcanbemuchimproved (Wang & Livescu, 2015 ).
3. TheproposedKCCAbasedfeatureselectionmethod
Over the last two decades,the KCCA has been using for var-ious purposes in statistic and machine learning, such as feature learning (Sakar et al., 2012 ), computational vision (Bilenko and Gallant, 2016 ), statistical independence measurement (Lopez- Paz, Hennig, & Schölkopf, 2013 )andsoon. Lisanti et al. (2014) in-vestigate matching people across cameras views by applying a learning method based on KCCA to find a common substance between their proposed descriptors, and their experimental results demonstrate the superiority of the proposed method. Sakar et al. (2012) propose a filter method for feature selection with the aim to find the unique information, which exploits correlated functions explored by KCCA as the inputs to mRMR.
They demonstrate the effectiveness of their method on some benchmark datasets. Considering Eqs. (6)–(9) ,we propose a new kernelversionFS method,i.e.,mRMJR-KCCA,byapplyingKCCA in Eq. (9) to Eq. (6) .ThecriterionofmRMJR-KCCAis
JmRMJR−KCCA
(
fk)
= max fk∈F−S[
ρ
KCCA(
fk;C)
−ρ
KCCA(
S;fk)
] (10)where
ρ
KCCA is thecorrelation coefficient calculated byKCCAbe-tweentwosetsofvariables,givenin Eq. (9) .Itisnotedthatwein factuse
ρ
corr(thePearson’scorrelation)incalculatingthefirstitem(i.e.,therelevanceofthefeaturecandidateandthetargetlabels)in Eq. (10) ,sincetheCCAorKCCAessentiallyperformthecalculation ofthePearson’scorrelation(Zou, Zeng, Cao, & Ji, 2016 )whenboth XandYaretwovectors(suchasfkandC)in Eq. (5) or Eq. (8) ,The
mRMJR-KCCAcombinestheidea ofthemRMRandKCCA to max-imizethe relevancebetweenthefeaturecandidateandthetarget class labels, and simultaneously minimize the joint redundancy betweenthealreadyselectedfeaturesandthefeaturecandidate.
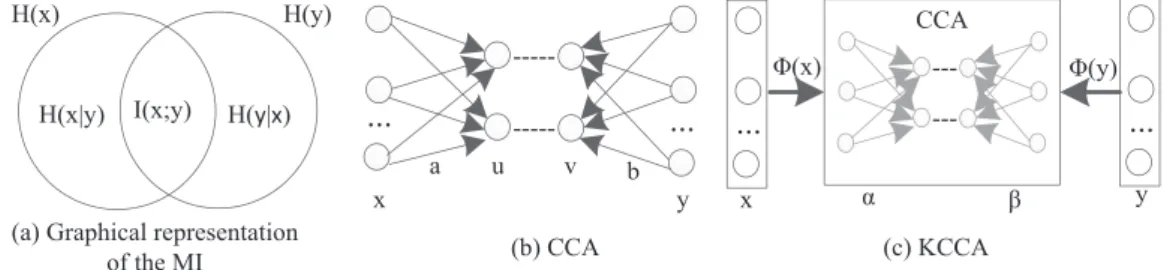
The MI betweentwo variables in Eqs. (1) and (2) is the sum ofMIbetweenthediscrete variatesxandyiftherearenohigher order statisticdependencies than correlation (Fig. 1 (a)). The CCA in Eq. (5) finds a pair of linear transformations from X and Y such that the correlation coefficient between extracted features ismaximized (Fig. 1 (b)). The KCCA in Eq. (8) finds pairs of non-linear projections of the two views, and the optimal projections can maximize the correlation between X and Y by mapping the data-casestofeaturevectors
(x)and
(y),asshownin Fig. 1 (c).
The second term in Eq. (2) (Brown et al., 2012 ) is replaced from an approximation of sum of the paired redundancies with a new redundancy measurement in Eq. (6) (Kaya et al., 2014 ) whichishandledonceformultidimensionalvariablesbyCCA.Our proposed mRMJR-KCCAfurther changes the measurement ofCCA in Eq. (6) totheKCCA,aspresentedin Eq. (10) .
To implement the mRMJR-KCCA especially for the large-size datasets, we apply Incomplete Cholesky Decomposition (ICD) for kernel matrix approximation to improve the computation effi-ciency due to its accurate matrix approximation with far fewer samples(Patel et al., 2016 ).ICDgeneratesalow-rankmatrixN×M (MN) by performing a standard Cholesky Decomposition but terminating the decomposition considering a small number of columns (M). So that the complexity to the eigenvalue problem ofsize N×N in Eq. (9) turns to O(M2N
)
(Hardoon et al., 2004 ).Table 1 details theprocedure to implement mRMJR-KCCAin this paper.
ThemRMJR-KCCAalgorithmranksthefeatures bythemaximal relevancebetweenthefeaturecandidateandthetargetclasslabels andtheminimaljoint redundancybetweenthefeature candidate and the already selected features, as presented in Eq. (10) . It is noted that the nonlinear correlation coefficient is used to rank the feature candidates following Eq. (10) , which is acquired by the transformation in KCCA. However, the coefficient is only for ranking the features, the selected features with higher ranking arestill theoriginalfeaturesinstead ofthetransformed data.The steps of the mRMJR-KCCAalgorithm in Table 1 are explained in detailbelow:
Step1: Normalizefeaturesvalueto[01]range.Thisstepensures thatallfeatureshavethesameimportance.
Step2: Calculate the relevance score of each feature candidate withtheclasslabelsbasedonthefirstitemin Eq. (10) . Step3: Select the first feature fs which has maximal relevance
scoreinStep2.
Step4: UpdateS=S∪
{
fs}
, F=F|{
fs}
.Step5: Calculate themRMJR-KCCA using Eq. (10) . Also, theICD is adopted to improve the implementation of KCCA in Eq. (10) .
Fig.1. TherepresentationofMI,CCA,andKCCA.
Table1
PseudocodeofthemRMJR-KCCA.
AlgorithmmRMJR-KCCA:MaximumRelevanceandMinimumJointRedundancyKernelCCA
Input:anoriginalfeaturesetF,thenumberoffeaturestobeselectedU
Output:aselectedfeaturesetS
InitializeF={f1 ,f2 ,...fl,...fn},S={},U
Normalizefeaturesto[01]
CalculateρKCCA(fn,C)usingEq.(9)foreachfnwiththeclasslabelsC
SelectthefirstfeaturefswithmaximumρKCCA(fn,C)
UpdateS=S∪{fs},F=F|{fs}
IfU<desirednumbers
CalculatemRMJR-KCCA:ρKCCA(fk;C)−ρKCCA(S;C)followingEq.(10)
SelectthenextfeaturethatmaximizingmRMJR-KCCA
UpdateS,F End
WriteStoanexcelfile
Table2
DescriptionsofUCIdatasetsandground-truthdatasetsusedintheexperiments. Dataset Datatype #Feature #Class #Instance Year 1Blood Real 4 2 748 2008 2Diabetes Integer,Real 8 2 768 1990 3Heart Categorical,Real 13 2 270 N/A
4Iris Real 4 3 150 1988
5Parkinsons Real 22 2 195 2008 6Seeds Real 7 3 210 2012 7Wdbc Real 30 2 569 1995 8Wine Integer,Real 13 3 178 1991 9Wine_red Real 11 6 1599 2009 10Wpbc Real 33 2 198 1995 11X_HAR Real 75 17 32,844 2015 12Y_HAR Real 296 17 32,844 2015 13Z_HAR Real 371 17 32,844 2015
Step6: Select the next feature which maximizes the mRMJR-KCCA.
Step7: Goto Step4 ifthenumber ofthealready selected fea-turesislowerthanthenumberoffeaturestobeselected. ItisnotedthatthemaindifferencecomparedwiththeCCA ap-proachin Kaya et al. (2014) isinStep5.Duetoapplying Eq. (9) in theproposed Eq. (10) ,weutilizetheICDto approximatea kernel matrixand map the features into the nonlinear spaceespecially forthelarger-size dataset,such asthe datasetsof X_HAR,Y_HAR andZ_HARin Table 2 .
4. Experimentationsandresults
4.1.Benchmarkdatasetsandlearningalgorithms
Weemploy10UCIbenchmarkdatasetsandthreeground-truth datasetstoevaluatetheperformanceofmRMJR-KCCA.Thedatasets are all related to classification problems, covering both binary-class and multi-class; the data type includes real, integer and categorical;thenumberoforiginal featuresrangesfrom4to371; thesamplenumberofeachdatasetvariesfrom150to32,844.The groundtruthdatasets10–12containthedailyactivitiesperformed in a home environment using five wearable sensors. The data
sets11,12and13record17activitiesfrom21subjectswith20Hz samplingrate.X_HARrepresentsthefeaturesetextractedfromthe wearable’sattitude(roll,pitch,andyaw)andY_HARisthefeature set generated from the sensor readings of an accelerometer, a gyroscope and a magnetometer, a barometer and a temperature individually.Z_HARisthecombinationofX_HAR andY_HAR. The detailsofallthedatasetsusedinthisworkareshownin Table 2 .
We experimentally evaluate mRMJR-KCCA using two learning algorithms onthe selectedsubset offeatures, i.e., SupportVector Machines (SVM) and Random forest (RF) due to their excellent performance in classification applications (Alickovic, Kevric, & Subasi, 2018; Chernbumroong, Cang, & Yu, 2014; Sani, Massie, Wiratunga, & Cooper, 2017 ).Thepair ofparameters gammaandc inSVM,andthenumberoftreesinRF aredetermined in10-fold cross validation process individually. The results report the aver-age accuracy from10 times test. At the same time, we compare our proposed method with other available popular FS methods presentedin Section 1 .
4.2. Experimentalresultsontheuseddatasets
The classification accuracies with SVM and RF are shown in Table 3 and Table 4 , respectively, in which the best method for
Table3
Classificationaccuracy(%)withSVMclassification. Dataset(#ofthe
selectedbestfeatures)
mRMJR-KCCA (proposed)
mRMR-CCAa MCR-CCAa Sparse
Filteringb
Autoencoderc mRMRd JMId CMIMd DISRd
Blood(4) 77.94 77.94 77.94 77.94 77.94 77.94 77.94 77.94 77.94 Diabetes(7) 77.98 77.98 78.12 72.26 70.18 77.98 77.79 77.99 77.79 Heart(5) 84.07 84.93 84.81 71.48 80.37 83.33 83.85 83.33 83.70 Iris(4) 96.67 96.67 96.67 96.67 96.67 96.67 96.67 96.67 96.67 Parkinsons(5) 92.21 91.74 91.24 91.26 92.76 92.21 90.74 89.58 90.21 Seeds(3) 93.81 91.43 93.81 94.76 96.19 94.29 92.86 93.81 93.81 Wdbc(12) 97.71 97.01 97.07 95.25 95.78 96.31 96.31 96.32 96.52 Wine(10) 99.44 97.78 99.44 97.78 96.22 96.11 99.44 99.44 99.44 Wine_red(4) 68.35 68.98 68.29 70.1 66.48 68.17 68.04 68.04 68.05 Wpbc(5) 80.82 79.26 80.37 76.82 78.82 81.37 78.26 78.82 78.79 X_HAR(20) 96.51 94.90 96.10 95.75 94.61 93.46 96.82 96.82 96.78 Y_HAR(20) 97.29 96.14 96.01 95.92 94.3 89.81 86.83 88.26 86.98 Z_HAR(30) 98.50 97.75 97.75 98.04 97.51 91.19 90.61 91.74 90.63 Rank∗ 6 3 4 3 4 3 4 4 3
Rank∗denoteseachFSmethod’srankingmeasuredbythetimesoftheFSmethodbeststheothersonthe13datasets,i.e.,thebiggernumbermeanshigherranking. a Kayaetal.(2014).
b Ngiametal.(2011). cWang(2016). d Brownetal.(2012).
Table4
Classificationaccuracy(%)withRFclassification. Dataset(#ofthe
selectedbestfeatures)
mRMJR-KCCA (proposed)
mRMR-CCAa MCR-CCAa SparseFilteringb Autoencoderc mRMRd JMId CMIMd DISRd
Blood(3) 75.94 75.94 75.94 75.94 75.94 75.94 75.94 75.94 75.94 Diabetes(6) 76.29 77.47 77.07 71.62 68.22 77.46 76.68 77.46 76.51 Heart(3) 84.44 82.22 83.33 71.11 80.74 82.22 82.22 82.22 81.48 Iris(2) 96.67 96.67 96.67 96.67 96.67 96.67 96.67 96.67 96.67 Parkinsons(10) 94.34 92.26 92.79 90.26 89.18 90.13 90.66 92.26 91.68 Seeds(4) 92.86 90.48 94.29 93.81 95.24 94.76 94.29 94.29 94.29 Wdbc(5) 96.84 96.08 96.08 94.02 96.14 96.39 96.19 96.05 95.93 Wine(7) 97.75 95.57 97.78 96.6 96.86 96.29 97.78 97.78 97.78 Wine_red(8) 64.29 64.29 63.66 60.91 70.98 64.60 62.23 63.29 62.23 Wpbc(3) 76.87 76.76 76.79 76.76 81.79 76.76 76.32 77.29 76.29 X_HAR(30) 96.62 95.63 96.65 93.55 92.74 94.28 96.55 96.63 96.57 Y_HAR(30) 97.80 95.79 95.79 94.17 93.39 96.25 96.52 96.69 96.80 Z_HAR(30) 98.80 97.88 97.87 95.81 95.67 96.71 95.88 96.86 95.92 Rank∗ 7 3 4 2 5 2 3 3 3
Rank∗denoteseachFSmethod’srankingmeasuredbythetimesoftheFSmethodbeststheothersonthe13datasets,i.e.,thebiggernumbermeanshigherranking. a Kayaetal.(2014).
b Ngiametal.(2011). c Wang(2016). dBrownetal.(2012).
each datasetishighlightedinbold.Based ontheSVM-based clas-sification results in Table 3 , the mRMJR-KCCAproduces the best performancewiththelargestnumber (6) ofhigherrankingonthe total 13 datasets. The mRMJR-KCCA bests the other FS methods on the datasetsBlood, Iris, Wdbc, Wine, Y_HAR, and Z_HAR.The CCA-based methods show better performance than the MI-based methods regarding the Rank∗ in Table 3 . The accuracies of MI-based methods on datasets Y-HAR and Z-HAR are much lower, whichlowersdowntheRank∗oftheMI-basedmethods.However, themRMRpresentsthehighestaccuracyof81.37%onthedataset Wpbc. On the datasets Blood and Iris, all the nine FS methods present the same performances since the original size of Blood andIrisis small(=4) andall thefourfeatures are used for clas-sificationrespectively,theperformancesarethereforeindependent of the feature selection methods. The Autoencoder presents the highestaccuraciesof92.76% and96.19onthedatasetsParkinsons andSeeds respectively. TheSparse Filteringperforms best onthe datasetWine_red(70.1%).RegardingtheRank∗ofeachFSmethod in Table 3 , the Autoencoder, MCR-CCA, JMI, and CMIM can still providetheperformancefourtimesbetterthantheothermethods. ConsideringtheRFclassificationresultsin Table 4 ,the mRMJR-KCCA and Autoencoder rank the first two on the 13 datasets
regarding the Rank∗, followed by the MCR-CCA. Meanwhile, the mRMJR-KCCA bests the other methods seven times with RF. The Autoencoder outperforms others four times with SVM in Table 3 and fivetimes withRF in Table 4 .The JMI, CMIM, DISR, andMCR-CCAperformbestonthedatasetWinewithRF classifica-tion.TheAutoencoderandtheSparseFilteringobtainsmuchlower results on datasets of Heart and Diabetes with both SVM and RF;thisbrings downtheperformance ofthe Autoencoderon the used datasets.The Autoencoder and Sparse Filteringfail to show their superiority in this paper, which could be attributedto the factthat we onlyuseone-layer SparseFilteringandAutoencoder. The superiority may be revealed when increasing the layers of AutoencoderandSparseFiltering.ThemRMRproducesthehighest accuracy of 70.98%on the dataset Wine_red with RF in Table 4 , whileitperformsbest(81.37%)onWpbcin Table 3 withSVM.This impliesthat differentclassification methodscanproducedifferent resultseven on thesame featuresets due tothe parameters op-timizationortheintrinsicqualityofa classificationmethod.From theresultsin Tables 3 and 4 ,theperformanceofthemRMJR-KCCA remains consistent, which rank the first with both SVM and RF classification; the Autoencoder performs well in both Tables 3 and 4 .
Fig.2. Classificationaccuracyvariationswiththevaluesofγ(0.1∼100)ondatasetsofSeedsandParkinsons.
4.3.Impactofkernelparameterofontheobtainedperformanceof KCCA
To produce kernel matrices in KCCA in this paper, we use a Gaussian RBF kernel, given in Eq. (11) . Here, x and x represent two feature vectors. The parameter
γ
in Eq. (11) differs from the choice of kernel bandwidth, which affects the shape of the distributionofcanonicalfeatures.k
x, x=e−γx−x2(11)
We therefore choose three datasets in Table 2 to explore the impact of the kernel parameter
γ
on different datasets in this section. Fig. 2 showsthevariationsofclassificationaccuracyalong withthedifferentkernelparameterγ
inmRMJR-KCCAondatasets of Seeds and Parkisons. Here, we setγ
from 0.1 to 100 with differentsteps. Fig. 2 only presents partof the results based on the setγ
values since someγ
values yield similar results, e.g.,γ
= 80–100. Thevalues ofγ
havedifferentimpacts on different datasets.Forinstance,thevaluesofγ
=0.9,1and2producebetter performance on dataset Seeds with both SVM and RF classifica-tion,whilethevaluesofγ
=0.1and1performbetterondataset Parkinsons.γ
= 1 exhibits robust and steady performance on bothdatasets.It isnotedthatwe setγ
as1formostdatasets in Tables 3 and 4 . Fig. 3 presentstheimpact ofγ
on theaccuracies of dataset X_HAR when we fix the number of selected featuresFig.3. ClassificationaccuraciesversusvariedγvaluesintheRBFkernelonX_HAR.
as30,fromwhichwe canseethat when
γ
= 0.3,0.5, 0.9, 1and 2,better andsimilarresults withbothSVM andRF are achieved. This furtherdemonstratesγ
= 1 exhibits betterresults formost of the datasets used in this paper. The choice of theγ
values has different effects on the performance of the mRMJR-KCCA in Figs. 2 and 3 . For other datasets in Table 2 , the optimization ofFig. 4. Classification accuracies versus the number of components in ICD on datasetsofX_HAR,Y-HAR,andZ_HAR.
the parameter
γ
inRBFkernelwhen usingthemRMJR-KCCAcan bestudiedbytrialsoneachdatasetordeployingsomealgorithms (suchasgeneticalgorithm)toattaintheoptimizedγ
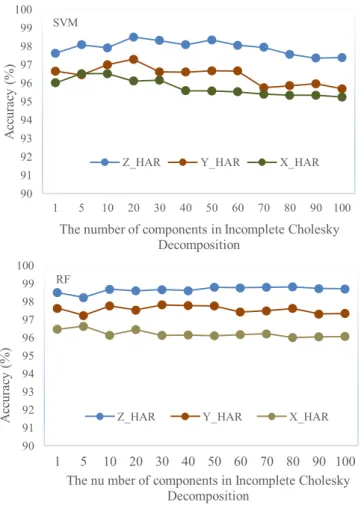
.4.4. ImpactofthenumberofthecomponentsdecomposedinICD fromkernelmatricesontheobtainedperformance
In Table 2 ,thesamplesizesofthefirst10datasetscanbe eas-ily dealtwith to complete the full kernel matrixin KCCA. How-ever,thesamplesizesofthedatasetsofX_HAR,Y_HARandZ_HAR aremuchlarger(e.g.,N=32,844),whichismemoryintensiveand computationexpensivetorealizeaO(N3
)
kernelmatrixsolution.Apositivesemi-definitematrixKcanbedecomposedasLL∗,whereL isanN×Nmatrix,thedecompositioninIncompleteCholesky De-composition (ICD)istofindamatrixL˜ofsize N×M,forsmallM, such that the difference K-L˜L˜T has norm less than a given value
(Bach et al., 2002 ).ThispaperappliesICD ontheKCCAforkernel matrixapproximation,whichreducesthecomputational complex-ityofKCCA toO(M2N
)
,here, Misthemaximal rankofthesolu-tion.WesetarangeofMfrom1to100toinvestigatetheimpact of the numberof the components inICD onX_HAR, Y_HAR and Z_HARusingthetop30selectedfeatures. Fig. 4 presentstheeffect of increasing the number of components decomposed in ICD on theperformanceofmRMJR-KCCAevaluatedbySVMandRF.Itcan beseenin Fig. 4 thatthenumberofcomponentsinICDhasaslight impactondatasetsofX_HAR,Y_HARandZ_HARwithRF classifica-tion,whilst,ithasabiggerimpactwhenusingSVMclassification. ThismaybeattributedtothattheoptimalparametersinRF mod-elsareeasiertoobtainthanthecounterpartinSVMmodels.
From Fig. 4 , we also observe that increasing the number of components decomposed in ICD from kernel matrices does not necessarilyincreasetheperformance.WhenM=1,20and50,the betterperformances areachieved onmRMJR-KCCAandRF; when M=20,the best performance is achievedwith mRMJR-KCCAand SVM.Consequently,theimpact ofthe numberofthecomponents inKCCA maydepend onthe datasetitself fromtheexperimental results.
4.5.ImpactofthefeaturesextractedbylinearCCAandnonlinear KCCAontheperformance
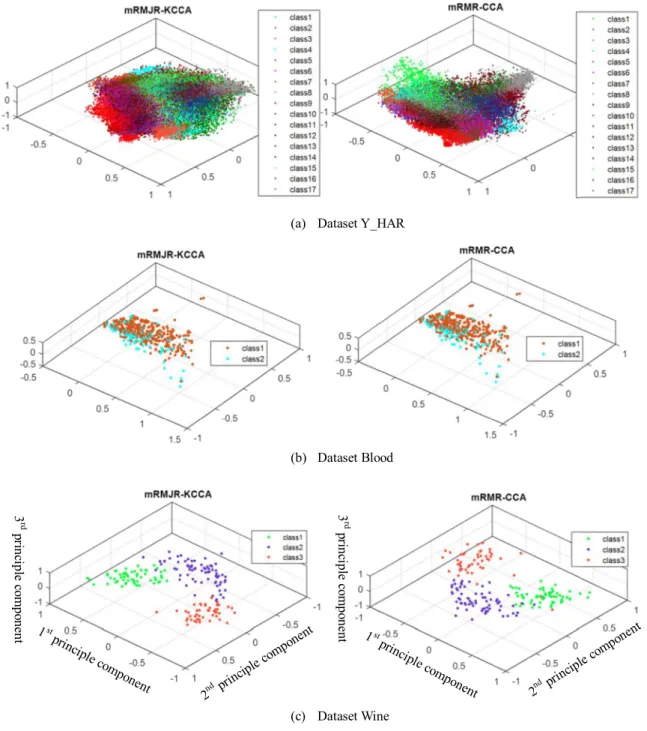
CCAfinds pairs ofbasis vectorsthat maximise thecorrelation ofasetofpairedofvariables,andthesepairscanbeconsideredas twoviewsofthesameobject.TheKCCAisatechniquethat gener-alisesthelinearCCAtononlinearsetting.Thisallowsustoextract the nonlinear relation of two sets of variables. This paper uses thelinearcorrelationcoefficientsin Eq. (6) formRMR-CCAfeature selection and nonlinear correlation coefficient in Eq. (10) for mRMJR-KCCAfeatureselection. Whilst, itis difficulttotell which real datasets imply linear or nonlinear correlation among the features. Tables 3 and 4 show that the mRMJR- KCCA produces thehighestaverageperformanceandrankontheusedbenchmark datasets. However, the mRMJR-KCCA does not perform best on all the datasets. For example, the mRMR-CCA and mRMJR-KCCA perform the same on the dataset Blood, and the latterperforms better thanthe formeron mostdatasets. Tovisualize the impact of CCA- andKCCA-extracted features on the performance in this paper,we usePrincipal Component Analysis (PCA) (Jolliffe et al., 2016 ) to derive the first 3 principle components of each feature dataset. Fig. 5 presents the scatter plot of each feature set after being applied PCA. From Fig. 5 (a) presenting the dataset Y-HAR, wecanobservethatitisdifficulttoseethedifferenceofthetwo expressions since the sample size is too large (32,844) even we canseetheKCCAperformsbetterin Tables 3 and 4 onthedataset. Fig. 5 (b) is the scatter plot of dataset Blood, which appears the same for the CCA and KCCA feature selection. This implies that features in dataset Blood may not contain nonlinear correlation. From Fig. 5 (c)which presentsthe datasetWine, we can seethat the resultsof mRMJR-KCCAmay be better since some dots from class3aremixedwithclass1inmRMR-CCA.
5. Conclusions
Thispaperpresentsafeatureselectionmethod,named mRJMR-KCCA,whichreplacesthecorrelationmeasureoftheMIinmRMR with the KCCA. Experimental results demonstrate the superior performance of mRMJR-KCCA on the 13 classification associated datasetsusedinthispaperespeciallyonthelarger-dimensionality dadasets(suchasY_HARandZ_HARin Tables 3 and 4 ),compared with the other eight benchmark feature selection methods. The mRMJR-KCCAranksfirstregarding thetimesanditisbetter than the other FS methods with both SVM and RF classification in Tables 3 and 4 . From the mRMR to the mRMJR-KCCA, the FS measurechangesfromtheentropyto theKCCA.The mRMRgives anentropy-basedscorebetweentwovariables andutilizesasum approximationtomeasurethe correlationbetweenavariableand a set of variables. Instead, the KCCA searches for the nonlinear correlation between two sets of variables in mRMJR-KCCA. The mRMJR-KCCA can avoid the sum approximation in mRMR when measuring the joint redundancy between the feature candidate and the already selected features, which somehow considers the complementarity between the already selected features in the view of KCCA. Whilst, both mRMR andmRJMR-KCCA cannot completely remove the dependencies and redundancies among
Fig.5. ScatterplotoftheprinciplecomponentsofthefeaturesetsselectedbyCCAandKCCA.
features since thetwo methods relyon a same selection criteria structure as shown in Eqs. (2) and (10 ). Meanwhile, from the results in Tables 3 and 4 , we can also see that Autoencoder performs best on Wine_red and Wpbc with RF and the other FS methods can also yield comparable or similar results on the smaller-dimensionalitydatasets. The mRMJR-KCCAdo not always beat other FS methods; however, it performs much better on thedatasets with larger dimensionalitysince these datasets may contain nonlinear correlations with another set of variables. The resultsfurtherprovethatthereisnota“bestmethod” foralltasks. The choice of the best feature set is usually withthe aid of FS methodsorempiricalevaluationofdifferentcombinationsof fea-tures.As previouslymentioned,theoptimizedparametersinSVM (c,gamma) orRF(the numberoftrees)classificationinthepaper are achieved by searching in the preset ranges during 10-fold cross validation. The parameters involved in the classification in
Tables 3 and 4 and Fig. 3 canrefertothesupplementaldocument. Thenumberoftheparametersin Fig. 2 aretoobigtobeincluded. It is worth mentioning that the parameters shown in the doc-ument are not the only ones to yield the corresponding results. This means differentparameters or parametercombinations may producethesimilarresultsinclassification.
Forthefuturework,we havethefollowingissuesremainedto beinvestigated.
(1) The further work can be carried out to discover different kernelsinKCCAmeasurement.
(2) The computational cost in the KCCA-based feature selec-tion methods can be further reduced especially for larger datasets. The further study can consider employing other state-of-artmatrixapproximation methods toimprove effi-ciencyandaccuracy.
(3) The performance oftheKCCA-based featureselection is af-fectedby thekernelparameters,andother associated CCA-based selection criteriacan be explored to apply on larger datasets, such assparseKCCA, group sparse KCCA, ordeep CCA.
DeclarationofCompetingInterest
Wewishtoconfirmthattherearenoknownconflictsof inter-estassociatedwiththispublication andtherehasbeenno signifi-cantfinancialsupportforthisworkthatcouldhaveinfluencedits outcome.
CRediTauthorshipcontributionstatement
Yan Wang: Conceptualization, Data curation, Formal analy-sis, Investigation, Methodology, Software,Writing - original draft.
Shuang Cang: Conceptualization, Data curation, Formal analysis, Fundingacquisition,Investigation,Methodology,Software, Supervi-sion,Validation,Writing-review&editing.HongnianYu: Concep-tualization,Datacuration,Formalanalysis,Fundingacquisition, In-vestigation,Methodology,Supervision,Validation,Writing-review &editing.
Acknowledgments
This work was supported by the Erasmus Mundus Fusion Project (grant numbers 545831-EM-1-2013-1-IT- ERAMUNDUSEMA21 ), in part by the European Commission Marie Skłodowska-Curie SMOOTH (Smart Robots for Firefighting) Project under Grant H2020-MSCA-RISE-2016-734875 , CHARMED (Characterisation of a green microenvironment and to study its impactuponhealthandwell-beingintheelderlyasawayforward for health tourism) Project under Grant H2020-MSCA-RISE-2016- 734684 ,andinpartby the RoyalSocietyInternationalExchanges Scheme (Adaptive Learning Control of a Cardiovascular Robot Using Expert Surgeon Techniques) Project under Grant IE151224 . The authors would like to thankthe volunteers who involvedin thisworkfordatacollection.
Supplementarymaterial
Supplementary material associated with this article can be found,intheonlineversion,atdoi:10.1016/j.eswax.2019.10 0 014 .
References
Alickovic,E., Kevric,J., &Subasi,A.(2018). Performanceevaluation ofempirical modedecomposition,discretewavelettransform,andwaveletpacked decom-positionfor automatedepilepticseizuredetectionand prediction.Biomedical SignalProcessingandControl,39,94–102.
AshadAlam,M.,&Fukumizu,K.(2015).Higher-orderregularizedkernelcanonical correlationanalysis.InternationalJournalofPatternRecognitionandArtificial In-telligence,29,1551005.
Bach,F.R.,&Jordan,M.I.(2002).Kernelindependentcomponentanalysis.Journal ofMachineLearningResearch,3,1–48.
Bennasar,M.,Hicks,Y.,&Setchi,R.(2015).Featureselectionusingjointmutual in-formationmaximisation.ExpertSystemswithApplications,42,8520–8532. Bilenko,N.Y.,&Gallant,J.L.(2016).Pyrcca:Regularizedkernelcanonicalcorrelation
analysisinpythonanditsapplicationstoneuroimaging.Frontiersin neuroinfor-matics,10,49.
Bolón-Canedo,V.,Sánchez-Maroño,N.,&Alonso-Betanzos,A.(2013).Areviewof featureselectionmethodsonsyntheticdata.KnowledgeandInformationSystems, 34,483–519.
Brown,G.,Pocock,A.,Zhao,M.-J.,&Luján,M.(2012).Conditionallikelihood maximi-sation:Aunifyingframeworkforinformationtheoreticfeatureselection.Journal ofMachineLearningResearch,13,27–66.
Chakraborty,S.,Chatterjee,S.,Dey,N.,Ashour,A.S.,&Hassanien,A.E.(2017). Com-parativeapproachbetweensingularvaluedecompositionandrandomized sin-gularvaluedecomposition-basedwatermarking.InIntelligenttechniquesin sig-nalprocessingformultimediasecurity(pp.133–149).Springer.
Chernbumroong,S.,Cang,S.,&Yu,H.(2014).Apracticalmulti-sensoractivity recog-nitionsystemforhome-basedcare.DecisionSupportSystems,66,61–70. Chu,D.,Liao,L.,Ng,M.,&Zhang,X.(2013).Sparsekernelcanonicalcorrelation
anal-ysis.InProceedingsofInternationalMulticonferenceofEngineersandComputer Scientists.
Dessì,N.,&Pes,B.(2015). Similarityoffeature selectionmethods:Anempirical studyacrossdataintensiveclassificationtasks.ExpertSystemswithApplications, 42,4632–4642.
Gao, S., Ver Steeg,G., &Galstyan, A.(2016). Variationalinformation maximiza-tionforfeatureselection.InAdvancesinNeuralInformationProcessingSystems
(pp.487–495).
Gheid, Z., & Challal, Y. (2016). Novel efficient and privacy-preserving proto-colsforsensor-basedhumanactivityrecognition.InUbiquitousintelligence& computing, advanced and trusted computing, scalable computing and commu-nications, cloud and bigdata computing, internet ofpeople, and smart world congress (UIC/ATC/ScalCom/CBDCom/IoP/SmartWorld),2016 intl IEEE conferences
(pp.301–308).IEEE.
Guyon,I.,&Elisseeff,A.(2003).Anintroductiontovariableandfeatureselection.
JournalofMachineLearningResearch,3,1157–1182.
Hardoon,D.R.,Szedmak,S.,&Shawe-Taylor,J.(2004).Canonicalcorrelation analy-sis:Anoverviewwithapplicationtolearningmethods.NeuralComputation,16, 2639–2664.
Hotelling,H.(1936).Relationsbetweentwosetsofvariates.Biometrika,28,321–377. Jolliffe,I.T.,&Cadima, J.(2016). Principalcomponentanalysis:Areviewand re-centdevelopments.PhilosophicalTransactionsoftheRoyalSocietyA: Mathemati-cal,PhysicalandEngineeringSciences,374,20150202.
Kaya,H.,Eyben,F.,Salah,A.A.,&Schuller,B.(2014).CCAbasedfeatureselection withapplicationtocontinuousdepressionrecognitionfromacousticspeech fea-tures.InAcoustics,speechandsignalprocessing(ICASSP),2014IEEEinternational conferenceon(pp.3729–3733).IEEE.
Li,J.,Cheng,K.,Wang,S.,Morstatter,F.,Trevino,R.P.,Tang,J.,etal.(2017).Feature selection:Adataperspective.ACMComputingSurveys(CSUR),50,94. Li,M.,Bi,W.,Kwok,J.T.,&Lu,B.-L.(2015).Large-scaleNyströmkernelmatrix
ap-proximationusingrandomizedSVD.IEEETransactionsonNeuralNetworksand LearningSystems,26,152–164.
Li,Q.,Zhu,D.,Zhang,J.,Hibar,D.P.,Jahanshad,N.,Wang,Y.etal.(2017).Large-scale featureselectionofriskgeneticfactorsforAlzheimer’sdiseaseviadistributed grouplassoregression.arXiv:1704.08383.
Lisanti,G.,Masi,I.,&DelBimbo,A.(2014).Matchingpeopleacrosscameraviews usingkernelcanonicalcorrelationanalysis. InProceedingsofthe international conferenceondistributedsmartcameras(p.10).ACM.
Lopez-Paz,D.,Hennig,P.,&Schölkopf,B.(2013).Therandomizeddependence coef-ficient.AdvancesinNeuralInformationProcessingSystems,1–9.
Machado,I. P.,Gomes,A.L.,Gamboa,H.,Paixão,V., &Costa, R.M. (2015). Hu-manactivitydatadiscoveryfromtriaxialaccelerometersensor:Non-supervised learningsensitivitytofeatureextractionparametrization.InformationProcessing &Management,51,204–214.
Mehrkanoon,S.,&Suykens,J.A.(2017).RegularizedsemipairedkernelCCAfor do-mainadaptation.IEEETransactionsonNeuralNetworksandLearningSystems,29, 3199–3213.
Montalto,F.,Guerra,C.,Bianchi,V.,DeMunari,I.,&Ciampolini,P.(2015).MuSA: Wearablemultisensorassistantforhumanactivityrecognitionandindoor lo-calization.InAmbientassistedliving(pp.81–92).Springer.
Ngiam,J.,Chen,Z.,Bhaskar,S.A.,Koh,P.W.,&Ng,A.Y.(2011).Sparsefiltering.
AdvancesinNeuralInformationProcessingSystems,1125–1133.
Patel,R.,Goldstein,T.,Dyer,E.,Mirhoseini,A.,&Baraniuk,R.(2016).Deterministic columnsamplingforlow-rankmatrixapproximation:Nyströmvs.incomplete Choleskydecomposition.InProceedingsofthe2016SIAMinternationalconference ondatamining(pp.594–602).SIAM.
Peng,H.,Long,F.,&Ding,C.(2005).Featureselectionbasedonmutualinformation criteriaofmax-dependency,max-relevance,andmin-redundancy.IEEE Transac-tionsonPatternAnalysisandMachineIntelligence,27,1226–1238.
Sakar,C.O.,Kursun,O.,&Gurgen,F.(2012).Afeatureselectionmethodbasedon kernelcanonicalcorrelationanalysisandtheminimumredundancy–maximum relevancefiltermethod.ExpertSystemswithApplications,39,3432–3437. Sani,S.,Massie,S.,Wiratunga,N.,&Cooper,K.(2017).Learningdeepandshallow
featuresforhumanactivityrecognition.InInternationalconferenceonknowledge science,engineeringandmanagement(pp.469–482).Springer.
Suto,J.,Oniga,S.,&Sitar,P.P.(2016).Featureanalysistohumanactivityrecognition.
InternationalJournalofComputersCommunications&Control,12,116–130. Tang,J.,Alelyani,S.,&Liu,H.(2014).Featureselectionforclassification:Areview.
DataClassification:AlgorithmsandApplications,37.
Urbanowicz,R.J.,Meeker,M.,LaCava,W.,Olson,R.S.,&Moore,J.H.(2017). Relief-basedfeatureselection:Introductionandreview.arXiv:1711.08421.
Wang,L.(2016). Recognitionofhuman activitiesusingcontinuousautoencoders withwearablesensors.Sensors,16,189.
Wang,W.,&Livescu,K.(2015).Large-scaleapproximatekernelcanonicalcorrelation analysis.arXiv:1511.04773.
Yoshida,K.,Yoshimoto,J.,&Doya,K. (2017).Sparsekernel canonicalcorrelation analysisfordiscoveryofnonlinearinteractionsinhigh-dimensionaldata.BMC Bioinformatics,18,108.
Zou,Q.,Zeng,J.,Cao,L.,&Ji,R.(2016).Anovelfeaturesrankingmetricwith appli-cationtoscalablevisualandbioinformaticsdataclassification.Neurocomputing, 173,346–354.