Haverford College
Haverford College
Haverford Scholarship
Haverford Scholarship
Faculty Publications
Physics
2014
Searching for Pulsars Using Image Pattern Recognition
Searching for Pulsars Using Image Pattern Recognition
W. W. Zhu
A. Berndsen
E. C. Madsen
M. Tan
Fronefield Crawford
Haverford College, [email protected]
Follow this and additional works at: https://scholarship.haverford.edu/physics_facpubs
Repository Citation
Repository Citation
"Searching for Pulsars Using Image Pattern Recognition" W. W. Zhu, A. Berndsen, E. C. Madsen, M. Tan, I. H. Stairs, A. Brazier, P. Lazarus, R. Lynch, P. Scholz, K. Stovall, S. M. Ransom, S. Banaszak, C. M. Biwer, S. Cohen, L. P. Dartez, J. Flanigan, G. Lunsford, J. G. Matinez, A. Mata, M. Rohr, A. Walker, B. Allen, N. D. R. Bhat, S. Bogdanov, F. Camilo, S. Chatterjee, J. M. Cordes, F. Crawford, J. S. Deneva, G. Desvignes, R. D. Ferdman, J. W. T. Hessels, F. A. Jenet, D. Kaplan, V. M. Kaspi, B. Knispel, K. J. Lee, J. van Leeuwen, A. G. Lyne, M. A. McLaughlin, L. G. Spitler, and A. Venkataraman, Astrophysical Journal, 781, 117 (2014).
This Journal Article is brought to you for free and open access by the Physics at Haverford Scholarship. It has been accepted for inclusion in Faculty Publications by an authorized administrator of Haverford Scholarship. For more information, please contact [email protected].
The Astrophysical Journal, 787:137 (10pp), 2014 June 1 doi:10.1088/0004-637X/787/2/137
C
2014. The American Astronomical Society. All rights reserved. Printed in the U.S.A.
ARECIBO PULSAR SURVEY USING ALFA. III. PRECURSOR SURVEY AND POPULATION SYNTHESIS
J. K. Swiggum1, D. R. Lorimer1, M. A. McLaughlin1, S. D. Bates1,2, D. J. Champion3, S. M. Ransom4, P. Lazarus3, A. Brazier5, J. W. T. Hessels6,7, D. J. Nice8, J. Ellis9, T. R. Senty1, B. Allen9,10,11, N. D. R. Bhat12, S. Bogdanov13,
F. Camilo13,14, S. Chatterjee5, J. M. Cordes5, F. Crawford15, J. S. Deneva14, P. C. C. Freire3, F. A. Jenet16, C. Karako–Argaman17, V. M. Kaspi17, B. Knispel10,11, K. J. Lee3,18, J. van Leeuwen6,7, R. Lynch17, A. G. Lyne2,
P. Scholz17, X. Siemens9, I. H. Stairs19, B. W. Stappers2, K. Stovall20, A. Venkataraman14, and W. W. Zhu19 1Department of Physics and Astronomy, West Virginia University, Morgantown, WV 26506, USA
2Jodrell Bank Centre for Astrophysics, School of Physics and Astronomy, University of Manchester, Manchester, M13 9PL, UK 3Max-Planck-Institut f¨ur Radioastronomie, D-53121 Bonn, Germany
4NRAO, Charlottesville, VA 22903, USA
5Astronomy Department, Cornell University, Ithaca, NY 14853, USA
6ASTRON, Netherlands Institute for Radio Astronomy, Postbus 2, 7990 AA, Dwingeloo, The Netherlands
7Astronomical Institute “Anton Pannekoek,” University of Amsterdam, Science Park 904, 1098 XH Amsterdam, The Netherlands 8Department of Physics, Lafayette College, Easton, PA 18042, USA
9Physics Department, University of Wisconsin – Milwaukee, Milwaukee WI 53211, USA 10Leibniz Universit¨at Hannover, D-30167 Hannover, Germany
11Max-Planck-Institut f¨ur Gravitationsphysik, D-30167 Hannover, Germany
12Center for Astrophysics and Supercomputing, Swinburne University, Hawthorn, Victoria 3122, Australia 13Columbia Astrophysics Laboratory, Columbia University, New York, NY 10027, USA
14Arecibo Observatory, HC3 Box 53995, Arecibo, PR 00612, USA
15Department of Physics and Astronomy, Franklin and Marshall College, Lancaster, PA 17604-3003, USA 16Center for Gravitational Wave Astronomy, University of Texas at Brownsville, TX 78520, USA
17Department of Physics, McGill University, Montreal, QC H3A 2T8, Canada 18Kavli Institute for Radio Astronomy, Peking University, Beijing 100871, China
19Department of Physics and Astronomy, University of British Columbia, 6224 Agricultural Road Vancouver, BC V6T 1Z1, Canada 20Department of Physics and Astronomy, University of New Mexico, NM, 87131, USA
Received 2013 October 23; accepted 2014 April 20; published 2014 May 13 ABSTRACT
The Pulsar Arecibo L-band Feed Array (PALFA) Survey uses the ALFA 7-beam receiver to search both inner and outer Galactic sectors visible from Arecibo (32◦ 77◦and 168◦ 214◦) close to the Galactic plane (|b| 5◦) for pulsars. The PALFA survey is sensitive to sources fainter and more distant than have previously been seen because of Arecibo’s unrivaled sensitivity. In this paper we detail a precursor survey of this region with PALFA, which observed a subset of the full region (slightly more restrictive inand|b| 1◦) and detected 45 pulsars. Detections included 1 known millisecond pulsar and 11 previously unknown, long-period pulsars. In the surveyed part of the sky that overlaps with the Parkes Multibeam Pulsar Survey (36◦50◦), PALFA is probing deeper than the Parkes survey, with four discoveries in this region. For both Galactic millisecond and normal pulsar populations, we compare the survey’s detections with simulations to model these populations and, in particular, to estimate the number of observable pulsars in the Galaxy. We place 95% confidence intervals of 82,000 to 143,000 on the number of detectable normal pulsars and 9000 to 100,000 on the number of detectable millisecond pulsars in the Galactic disk. These are consistent with previous estimates. Given the most likely population size in each case (107,000 and 15,000 for normal and millisecond pulsars, respectively), we extend survey detection simulations to predict that, when complete, the full PALFA survey should have detected 1000+330
−230normal pulsars and 30+200−20 millisecond pulsars. Identical estimation techniques predict that 490+160−115 normal pulsars and 12+70−5 millisecond pulsars would be detected by the beginning of 2014; at the time, the PALFA survey had detected 283 normal pulsars and 31 millisecond pulsars, respectively. We attribute the deficiency in normal pulsar detections predominantly to the radio frequency interference environment at Arecibo and perhaps also scintillation—both effects that are currently not accounted for in population simulation models.
Key words: methods: statistical – pulsars: general – surveys 1. INTRODUCTION
Our current knowledge of the non-recycled (hereafter
normal) pulsar and millisecond pulsar (MSP) Galactic popu-lations21—their spatial, period, and luminosity distributions— 21 Although a number of traits separate normal from millisecond pulsars, the
most distinct is an MSP’s short spin period, which is the result of angular momentum transferred by material from a binary companion. For the remainder of this paper, we useP=30 ms andBsurf=1010G as period and
surface magnetic field thresholds to differentiate between MSPs (P <30 ms,
Bsurf<1010G) and normal pulsars (P >30 ms,Bsurf>1010G), although
there are certainly exceptions to this simple separation. A complete list of currently known Galactic MSPs can be found at
http://astro.phys.wvu.edu/GalacticMSPs
primarily comes from the results of the Parkes Multibeam Pulsar Survey (PMPS; Manchester et al. 2001; Morris et al. 2002; Kramer et al.2003; Hobbs et al. 2004; Faulkner et al. 2004; Lorimer et al. 2006). Analyses of these results have shown that the Galactic normal pulsar population is made up of 30,000±1100 sources beaming toward Earth with luminosi-ties above 0.1 mJy kpc2; their radial density profile is best de-scribed by a gamma function and their distance from the Galactic plane, by an exponential function with a scale height of 0.33 kpc (Lorimer et al.2006). A more physically realistic treatment of pulsar luminosities involves using a log-normal luminosity func-tion, which is demonstrated from pulsar population syntheses (e.g., Faucher-Gigu`ere & Kaspi2006). The advantage of this
approach is that it allows predictions of thetotalnormal pulsar population size—not just the number above a certain luminosity cutoff; Faucher-Gigu`ere & Kaspi (2006) predict that there are 120,000±20,000 detectable, normal pulsars in the Galaxy.
Since there are only∼10% as many known MSPs as normal pulsars (Manchester et al.2005), we do not have the same level of knowledge about recycled pulsars’ population parameters. The High Time Resolution Universe (HTRU) Survey (Keith et al.2010) has added more normal pulsar discoveries to the PMPS haul and many MSPs as well (e.g., Bates et al.2011; Burgay et al. 2013; Morris et al. 2002; Hobbs et al. 2004; Mickaliger et al. 2012). Recent analysis of the intermediate latitude portion of HTRU MSP detections by Levin et al. (2013) uses a scale factor method (Vivekanand & Narayan 1981; Lorimer et al.1993) and 50 detected MSPs to place a lower limit of 30,000±7000 on the Galactic MSP population size (considering sources whose luminosities exceed 0.2 mJy kpc2). The scale height of the MSP population is fairly well established to be 500 pc (Lorimer2005; Cordes & Chernoff1997), but the spatial, period and luminosity functions are currently less well understood. Although many models can be ruled out, plausible MSP populations with a variety of underlying distributions are consistent with the observed sample (Lorimer2010).
Despite the fact that Arecibo’s latitude does not permit obser-vations close to Galactic center like those at Parkes, the unique combination of Arecibo’s sensitivity, paired with the high spec-tral resolution of its back-ends, provides a much deeper view through the Galaxy’s dispersive medium, which often smears out signals from distant sources. Although the PMPS and HTRU surveys have sampled much of the sky surrounding the Galac-tic center—an area of the sky with high pulsar density—and have discovered over 1000 pulsars, Pulsar Arecibo L-band Feed Array (PALFA) provides a glimpse of the population density at larger Galactic radii (R >5kpc), which will help improve the spatial features of future pulsar population models. Arecibo’s ability to reach competitive sensitivity limits with short integra-tion times (one to five minutes) makes acceleraintegra-tion searches for binaries unnecessary for all but the most exotic systems. Finally, Arecibo’s unrivaled sensitivity allows PALFA to probe the low-luminosity end of the Galactic pulsar population, leading to a better understanding of the underlying luminosity distribution.
With Arecibo’s unique capabilities, PALFA has great poten-tial to discover many normal pulsars as well as MSPs, thus improving our statistical picture of each population’s character-istics. Given the number of discoveries by PMPS, it has histor-ically been used to refine pulsar population modeling assump-tions for normal pulsars. Recent efforts have been made to dis-cover additional MSPs in archival PMPS data (Mickaliger et al. 2012) with motivation to improve MSP population models. With higher sensitivity to dispersed sources and MSPs, the PALFA survey’s influence on normal and millisecond pulsar population studies will complement those of the PMPS and HTRU surveys. MSPs are essential for the direct detection of gravitational waves by pulsar timing array projects (e.g., Demorest et al.2013). The best way to increase our sensitivity to the stochastic background is to add new MSPs to the array (Siemens et al.2013).
In this paper, we present the detections and discoveries from the initial phase of the PALFA survey, hereafter referred to as the “precursor survey.” In Section2, we describe the PALFA precursor survey parameters and sky coverage and introduce two pipelines used to process the raw data. We present the 45 detections made by the precursor survey in Section3 and include an evaluation of the survey’s efficacy based on measured
and theoretically calculated signal-to-noise (S/N) ratios. In Section4we discuss the portion of sky in the precursor survey that overlapped with the PMPS and show preliminary evidence that PALFA will indeed be probing more distant, fainter sources. Comparing population simulations to precursor survey detection statistics, we generate probability density functions (PDFs) for normal and millisecond pulsar populations in Section 5. These PDFs inform the predictions we make about the total number of pulsars (normal and MSP) we expect to have detected when the full PALFA survey is complete. We conclude in Section 6, stating the most probable normal and millisecond pulsar population sizes according to the precursor survey results.
2. SKY COVERAGE AND DATA ANALYSIS The PALFA precursor survey covered portions of two Galac-tic sectors—an inner Galaxy region, 36◦ 75◦, tiled with 865 pointings, and an outer Galaxy region, 170◦ 210◦, covered by 919 pointings. All pointings were within one degree of the Galactic plane (|b| < 1◦) and had dwell times of 134 and 67 s for inner- and outer-Galaxy regions respectively. The precursor survey used the Arecibo L-band Feed Array (ALFA) 7-beam receiver in conjunction with the Wideband Arecibo Pul-sar Processor (WAPP) back-end (Dowd et al.2000), which was set up to record 256 channels covering a 100 MHz bandwidth, centered at 1.42 GHz, every 64μs. Each ALFA pointing in-cludes seven distinct beam positions in a hexagonal pattern. As PALFA continues, the sky coverage will increase slightly in Galactic longitude (32◦ 77◦ and 168◦ 214◦) and will extend to Galactic latitude ±5◦. For the remainder of the paper, we will refer to this extended spatial coverage (accompanied by a three-fold increase in bandwidth) as thefull PALFA survey. The precursor survey, optimized for maximum efficiency and sensitivity, used a “sparse sampling” technique described in detail in Cordes et al. (2006); gaps left by the precur-sor survey will be covered in multiple passes by the full PALFA survey. PMPS overlaps with the southernmost regions covered by Arecibo in the PALFA precursor survey, corresponding to 36◦50◦. In Section3, we will compare the performance of the two surveys in this overlap region to make a statement about the efficacy of the PALFA precursor survey.
Data from the PALFA precursor were previously analyzed in Cordes et al. (2006). That analysis used a quasi-real-timeQuicklookpulsar search pipeline in which the data were decimated in time and frequency by factors of 8 and 16, respec-tively, yielding 32 spectral channels and 1024μs time resolu-tion. Using the decimated data, 11 pulsars were discovered and 29 previously known pulsars were detected. Timing and spec-tral characteristics from follow-up observations of the newly discovered pulsars are given in Nice et al. (2013).
We have analyzed these same data files at native full time-and frequency-resolution using the PALFA survey’sPresto1 pipeline. The full resolution search of the precursor survey data did not yield any pulsar discoveries (and in fact missed some sources flagged by theQuicklookpipeline), but revealed two more previously known normal pulsars (J1946+2611, B1924+16) and the bright MSP B1937+21. The Presto 1 zaplist, a list of frequencies and their harmonics related to known sources of radio frequency interference (RFI), may be responsible for this scant improvement overQuicklookresults since it was fairly restrictive, “zapping”∼8% of the spectral region between 0 and 10 Hz (∼84% of known pulsars have spin frequencies in this range). At least one previously known
The Astrophysical Journal, 787:137 (10pp), 2014 June 1 Swiggum et al. source, B1925+188, fell inside a zapped portion of the
spec-trum, but its fourth harmonic was still detectable inPresto1 results. Four other sources that were detected byQuicklook (J1913+1000, B1919+14, J2002+30 and J2009+3326) were not detectable inPresto1 results. Of the 12,488 PALFA precursor beams, 183 (1.5%) were not processed by thePresto1 pipeline, including beams where J1913+1000 and B1919+14 should have been detected. PSRs J2002+30 and J2009+3326 were processed byPresto1 and their spin frequencies were outside zapped por-tions of the spectrum; why these two sources were not detectable remains unknown, although it is plausible that harmonics of their true spin frequencies could have been “zapped,” causing these sources to fall below a detectable threshold.
After the precursor survey was complete, raw data products were decimated to 4-bit resolution and saved in that form. In the process, some files were lost or corrupted (i.e., detection data files for J1913+1000, B1919+14 and B1924+16), so results from Cordes et al. (2006) were used when necessary. We used a complete list of precursor beam positions to determine minimum offset angles from each known source in the survey region, then refolded corresponding 4-bit data files, yielding two additional detections (J1906+0649 and J1924+1631). Table1outlines the means by which all sources in the PALFA precursor survey were detected.
2.1.Presto 1Pipeline
The PALFAPresto 1 pipeline22 used to analyze pre-cursor survey data first converted WAPP-format data to SIGPROC filterbank-format (Lorimer 2001). Each filterbank file, one per beam, was then processed independently using various programs from thePrestosuite of pulsar analysis soft-ware23(Ransom et al.2002). Strong narrow-band impulsive and periodic signals were identified as interference by rfifind. The filterbank files were then cleaned and reduced-frequency-resolution sub-band files were created at various dispersion measures (DMs). Each group of sub-band files was then used to create time series with DMs close to the DM of the sub-band file. In total 1056 trial DM values were used between 0 DM 1003.2 pc cm−3. The upper limit was chosen to reflect the maximum expected DM in the sky region surveyed (Cordes & Lazio2003).
Each dedispersed time series was searched for single pulses usingsingle_pulse_search.py. Significant pulses (σ > 6) with widths up to 0.1 s were identified and a diagnostic plot was generated for human inspection. The time series were also Fourier transformed and searched for periodic signals using
accelsearch. The periodicity search was done in two parts, one for unaccelerated pulsars using up to 16 summed harmonics and the other for accelerated pulsars using up to 8 summed harmonics. The high-acceleration search used a Fourier-domain algorithm (Ransom et al.2002) with a maximum drift of 50 fast Fourier transform bins. Non-pulsar-like signals were removed from the candidate lists generated from the low and high-acceleration searches. The manicured low and high-high-acceleration candidate lists were then combined. Candidates harmonically related to a stronger candidate were discarded, while the top 50 candidates with σ > 6 were “folded” modulo the best Fourier-detected period using prepfold, which effectively 22 Many of the aspects of the PALFA precursor survey data processing
described here have since been augmented (e.g., Lazarus2013), including a new complementary pipeline based on the Einstein@Home distributed volunteer computing platform, e.g., Allen et al. (2013).
23 https://github.com/scottransom/presto
provides a fully coherent harmonic sum of the signal power. The resulting plots, along with basic metadata about the observations were loaded into a database hosted at Cornell University, where volunteers selected and inspected candidate plots.
2.2. Detection S/N Measurements
For all sources detected by the Quicklook andPresto 1 processing pipelines, we refolded data files from beam positions nearest those sources using known pulsar parameters and calculated measured signal-to-noise (S/N)measvalues. For each pulse profile, we used a simple algorithm to determine on- and off-pulse bins, then summed on-pulse intensities and divided by the maximum profile intensity to get an equivalent top-hat pulse widthWeq(in bins). Finally, (S/N)measis computed with
(S/N)meas = 1 σpWeq nbins i=1 (pi− ¯p), (1)
as in Lorimer & Kramer (2005), wherep¯andσpare the mean
and standard deviation of off-pulse intensities, respectively,pi is the intensity of an individual profile bin and each profile had
nbins =128. We dividedWeqby the number of bins in a profile
nbinsto convert to duty cycleδfor each detection. Computedδ and (S/N)measvalues are listed in Table1.
3. SURVEY RESULTS
To measure the effectiveness of a pulsar survey, we look at the known sources that fall inside the survey region and compare the number of detections to the number of expected detections. Effectiveness will then be evaluated by whether the survey meets/exceeds expectations for detecting individual sources.
3.1. Defining Detectability
The PALFA multibeam receiver is composed of seven beams, each with an average FWHM of ∼3.35; adjacent beams are separated by ∼5.5, or ∼1.6 half-power beamwidths. Outer beams and the central beam have gains of 8.2 and 10.4 K Jy−1 respectively (Cordes et al.2006). Although previous population studies have modeled gain patterns using Gaussian functions (e.g., Lorimer et al. 2006), we use an Airy disk function to better model the additional gain from the side lobes of individual beams. Although this is not a perfect representation of the PALFA survey’s true gain pattern—in fact, the side lobes of the outer ALFA beams are highly asymmetric (see Spitler et al.2014, for a more precise model)—the Airy disk captures Arecibo’s off-axis gain better than the Gaussian model and still provides the simplicity required to run population simulations quickly.
The theoretical signal-to-noise ratio (S/N)thfor a given pulsar with flux density (S1400) measured in mJy at 1400 MHz, spin periodP, and pulse widthWis given by
(S/N)th= S1400GnptobsΔf βTsys 1−δ δ , (2)
where δ = W/P is the pulse duty cycle; G is the gain in K Jy−1 of a specific beam,np = 2 is the number of summed polarizations,tobsis the integration time (134 s and 67 s for inner-and outer-Galaxy observations, respectively),Δf =100 MHz is the bandwidth,β =1.16 is a correction factor that accounts for losses in the digitization process and Tsys is the system
Table 1
Detections and Expected Detections by the Precursor Survey
PSR Name P DM b Δθ Duty Cycle Flux Density (S/N)th (S/N)meas Pipeline Detected? PALFA
(s) (pc cm−3) (◦) (◦) () (%) (mJy) (QL/P1/Refold) Discovery?
J0540+3207 0.524 61 176.7 0.8 1.43 2.1 0.34 62.6 32.8 QL, P1, Refold Yes J0628+0909 1.241 88 202.2 –0.9 2.30 1.4 0.06 4.6 21.0 QL, P1, Refold Yes J0631+1036 0.288 125 201.2 0.5 1.51 3.3 0.80 85.1 104.1 QL, P1, Refold J1855+0307 0.845 402 36.2 0.5 3.24 1.7 0.97 12.4 48.4 QL, P1, Refold J1901+0621 0.832 94 39.7 0.8 1.76 5.6 0.47 35.2 21.3 QL, P1, Refold Yes B1859+07 0.644 252 40.6 1.1 2.29 3.0 0.90 55.1 38.8 QL, P1, Refold J1904+0738 0.209 278 41.2 0.7 0.90 1.9 0.23 54.2 20.1 QL, P1, Refold Yes J1904+0800 0.263 438 41.5 0.9 1.99 2.8 0.36 41.0 21.2 QL, P1, Refold J1905+0616 0.990 256 40.1 –0.2 1.80 1.5 0.51 69.7 47.4 QL, P1, Refold B1903+07 0.648 245 40.9 0.1 0.52 5.6 1.80 266.2 171.3 QL, P1, Refold J1905+0902 0.218 433 42.6 1.1 0.50 1.9 0.10 21.1 22.2 QL, P1, Refold Yes B1904+06 0.267 472 40.6 –0.3 2.43 5.6 1.70 61.8 104.1 QL, P1, Refold J1906+0649 1.287 249 40.7 –0.2 2.53 6.3 0.30 9.2 20.2 Refold J1906+0746 0.144 217 41.6 0.1 2.60 1.6 0.55 28.8 15.0 QL, P1, Refold Yes J1906+0912 0.775 265 42.8 0.9 2.37 2.5 0.32 19.4 14.4 QL, P1, Refold J1907+0740 0.575 332 41.6 –0.1 2.24 2.2 0.41 30.5 25.3 QL, P1, Refold J1907+0918 0.226 357 43.0 0.7 3.00 1.6 0.29 7.5 21.8 QL, P1, Refold J1908+0734 0.212 11 41.6 –0.3 1.05 3.1 0.54 90.1 23.1 QL, P1, Refold J1908+0909 0.337 467 43.0 0.5 1.70 2.2 0.22 28.5 60.9 QL, P1, Refold B1907+10 0.284 149 44.8 1.0 1.92 2.3 1.90 206.9 83.8 QL, P1, Refold J1910+0714 2.712 124 41.5 –0.9 1.72 1.4 0.36 59.8 15.8 QL, P1, Refold B1910+10 0.409 147 44.8 0.2 2.32 3.7 0.22 11.0 . . . . . . J1913+1000 0.837 422 44.3 –0.2 1.69 3.8 0.53 66.5 26.0 QL J1913+1011 0.036 178 44.5 –0.2 2.69 4.1 0.50 14.1 19.9 QL, P1, Refold J1913+1145 0.306 637 45.9 0.5 2.06 4.7 0.43 23.4 . . . . . . B1911+11 0.601 100 45.6 0.2 1.90 4.2 0.55 43.9 . . . . . . B1913+10 0.405 241 44.7 –0.7 1.51 1.6 1.30 238.2 34.6 QL, P1, Refold B1914+13 0.282 237 47.6 0.5 1.78 2.4 1.20 152.8 230.4 QL, P1, Refold B1915+13 0.195 94 48.3 0.6 2.29 2.5 1.90 131.6 239.9 QL, P1, Refold B1916+14 1.181 27 49.1 0.9 3.04 1.4 1.00 26.9 21.7 QL, P1, Refold B1919+14 0.618 91 49.1 0.0 0.45 3.6 0.68 140.2 41.0 QL B1921+17 0.547 143 51.7 1.0 3.01 3.6 . . . . . . 46.8 QL, P1, Refold J1924+1631 2.935 518 51.4 0.3 0.65 1.0 0.09 35.4 10.5 Refold B1924+16 0.580 176 51.9 0.1 0.83 2.5 1.30 363.5 90.9 P1 B1925+188 0.298 99 53.8 0.9 1.92 5.9 . . . . . . 27.8 QL, P1, Refold J1928+1746 0.069 176 52.9 0.1 0.70 5.2 0.28 46.9 29.6 QL, P1, Refold Yes B1929+20 0.268 211 55.6 0.6 3.78 2.0 1.20 1.7 24.0 QL, P1, Refold B1937+21 0.00156 71 57.5 –0.3 2.41 14.9 13.20 327.0 180.5 P1, Refold J1946+2611 0.435 165 62.3 0.6 2.61 2.4 . . . . . . 18.5 P1, Refold B1952+29 0.427 7 66 0.8 2.53 4.5 8.00 325.8 117.3 QL, P1, Refold J1957+2831 0.308 138 65.5 –0.2 1.57 3.6 1.00 131.2 30.0 QL, P1, Refold J2002+30 0.422 196.0 67.9 –0.2 1.21 3.7 . . . . . . 60.7 QL, Refold B2000+32 0.697 142 69.3 0.9 2.16 1.8 1.20 121.7 49.1 QL, P1, Refold B2002+31 2.111 234 69.0 0.0 3.30 1.3 1.80 26.3 94.4 QL, P1, Refold J2009+3326 1.438 263 71.1 0.1 0.82 3.0 0.15 32.4 23.9 QL, Refold Yes J2010+3230 1.442 371 70.4 –0.5 0.60 2.2 0.12 32.6 23.4 QL, P1, Refold Yes J2011+3331 0.932 298 71.3 –0.0 2.50 2.6 0.38 21.2 39.4 QL, P1, Refold Yes J2018+3431 0.388 222 73.0 –0.8 1.70 2.0 0.24 47.4 31.7 QL, P1, Refold Yes
Notes.A comprehensive list of all pulsars detected by the precursor survey as well as those we expected to detect, given their high (S/N)thquantities. We list each
pulsar’s period (P), dispersion measure (DM), Galactic longitude (), Galactic latitude (b), angular offset from the closest beam (Δθ) and duty cycle (δ), as well as (S/N)th, (S/N)meas. PALFA precursor data were run through two processing pipelines, Quicklook andPresto1 (described in Section2), then converted into 4-bit
files and stored. Pulsars detected by Quicklook (QL) orPresto1 (P1) pipelines are marked accordingly; those detected after refolding archived, 4-bit data files have “Refold” in the “Pipeline Detected?” column. Previously unknown pulsars discovered by the precursor survey are marked with a “Yes” in the last column. For sources without an available flux density measurement, we did not compute (S/N)th. Previously determined parameters (P, DM,,band flux density) were obtained from the
ATNF Pulsar Catalog (Manchester et al.2005). Missing parameters, (S/N)thand (S/N)meas, for example, are denoted by dashes (—).
temperature measured in K (Dewey et al.1985). Flux densities
S1400were obtained from the ATNF Pulsar Catalog (Manchester et al.2005) for known pulsars and Nice et al. (2013) for pulsars discovered by the PALFA precursor survey. Equation (2) is
an approximation since this treatment assumes top-hat pulse profiles and ignores the considerable variability in pulse shape. The majority of pulsars have Gaussian-shaped profiles, however, so this approximation works well in most cases.
The Astrophysical Journal, 787:137 (10pp), 2014 June 1 Swiggum et al.
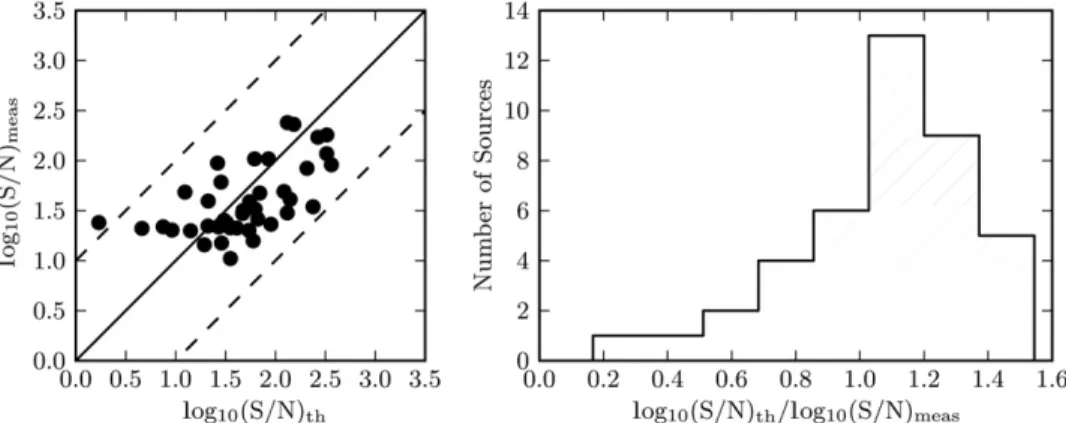
Figure 1.Left plot shows theoretical vs. measured S/Ns for each source with both quantities available. If the two values match for a given source, the data point for
that source should lie along the solid line with slope unity. The loose correlation shown here is a result of a combination of effects, but most notably, there can be as much as∼30% fractional error in (S/N)thdue to uncertainties in initial flux measurements, which were taken from the ATNF Pulsar Catalog (Manchester et al.2005);
interstellar scintillation and RFI also contribute to the large scatter. Dashed lines give a reference for sources whose theoretical and measured S/N values are different by a factor of 10. The right plot emphasizes the fact that, in addition to the significant dispersion, (S/N)measis smaller than (S/N)thin many cases. This systematic
offset implies a poor understanding of the noise environment and suggests that the maximum sensitivity limits of the survey have not yet been realized.
Hereafter (S/N)th will refer to theoretical signal-to-noise ratios, computed using Equation (2), while (S/N)meas refers to signal-to-noise ratios measured from PALFA detections as described in Section2.2and specifically Equation (1).
Since gain is a function of a source’s angular offset from the beam center, we model it as an Airy disk so that the gain
G=G0 2J1(kasin(θ)) kasin(θ) 2 , (3)
whereJ1is a Bessel function of the first kind,G0is the maximum on-axis gain of the beam,k = 2π/λ is the wavenumber (λ, the observation wavelength),ais the effective aperture radius (∼220 m), andθis the angular offset of a source from the beam center, measured in radians. In predicting S/N for a given pulsar, the pulsed nature of its emission must be taken into account, as shown by the final term in Equation (2). For all pulsars that were detected in the precursor survey, we computedWeq, thenδ as described in Section2.2. For sources that were not detected, we divide the pulse width at half maximum (W50), from the ATNF Pulsar Catalog (Manchester et al.2005), by the period to computeδ, then (S/N)th. Finally,Tsys includes the receiver temperature (Trec = 24 K) and sky temperature (Tsky), which varies as a function of position and frequency as shown by Haslam et al. (1982). Since this sky temperature map describes
Tsky at 408 MHz, we convert these values into 1.4 GHz sky temperatures using an assumed spectral index ofα=2.6, that isTsky ∝ν−α.
Although there are many factors involved, we assume a 1:1 relationship between (S/N)measand (S/N)thin order to use S/N as a prediction tool for the detectability of known sources. The true relationship between (S/N)measand (S/N)thcan be seen in Figure1.
Using a complete list of beam positions, we found the sur-vey observations carried out closest to known pulsars in the precursor region (i.e., minimizing angular offset,θ). For each of these positions, we found the maximum expected gain for a given pulsar using Equation (3). Previously measured param-eters for known pulsars allowed us to compute a theoretical signal-to-noise, (S/N)th, as shown in Equation (2). We define a known pulsar to be detectable if we find (S/N)th > 9 for that pulsar. A full list of pulsars detected by the precursor sur-vey as well as those considered detectable due to their (S/N)th values can be found in Table 1. Before PALFA began, there
Figure 2.Beam positions for the PMPS (light gray) and PALFA precursor
survey (dark gray) are shown here with known pulsar positions superimposed. The Parkes beam radii are about four times as large as those of Arecibo; the points indicating beam positions have been scaled appropriately relative to one another. Only PMPS beams within 1◦.2 of the Galactic plane are plotted since this more than covers the Galactic latitude limits of the PALFA precursor survey. Of the 58 previously known pulsars plotted here, many were too far from the nearest precursor survey beam center, making them undetectable (denoted by ×). Only 24 of 59 were deemed detectable, given the precursor survey’s patchy coverage of this Galactic sector, and were considered in comparing the two surveys. Known pulsars detected by the precursor survey are marked with + , while expected detections that were missed are marked withs. Filled circles indicate the positions of PALFA precursor survey discoveries in the region overlapping with PMPS.
were 84 known pulsars positioned inside the target precursor survey region, although this sky area was not covered uni-formly; 31 of 84 were deemed detectable, while 33 were ac-tually detected, and seven had no previous flux measurements. Of the 51 non-detections, most can be attributed simply to the sources not being close to a PALFA precursor survey beam pointing, as the survey had only limited coverage in this region. Figure2shows the portion of the precursor survey that overlaps with the PMPS), an example of this limited coverage. Three of the 51 non-detections (B1910+10, J1913+1145, and B1911+11) were unexpected, since (S/N)th >9 for these sources; one of the 33 detections (B1929+20) was also unexpected, given its low (S/N)th value. The non-detections could be due to a va-riety of factors—most likely RFI. Scintillation could have also suppressed the expected signal during precursor survey observa-tions or boosted the signal during initial flux measurements. It is unlikely scintillation affected the detectability of J1913+1145, however, because of this source’s high DM (637 pc cm−3). Given the short integration time near each of these sources (134 s), the pulse-to-pulse variability may have strongly affected (S/N)meas since relatively few pulses were recorded. Also, because of the
large error bars on (S/N)th(∼30% fractional error) due to un-certainties in flux measurements, the sources may simply be weaker than expected.
Although most sources with high (S/N)th values were de-tected by the precursor survey’s processing pipelines, five such sources were not. For each of these cases, we employed the same procedure as introduced in Section2.2, using known pe-riods and dispersion measures to dedisperse and fold the data from the closest pointing to each source. For the three sources mentioned earlier (B1910+10, B1911+11, and J1913+1145), no pulsations were detected; for the other two, J1906+0649 and J1924+1631, pulsations are evident, but relatively weak. PSR J1906+0649 was likely missed because of the RFI environment at Arecibo.
In addition to the 33 re-detected pulsars in the region, PSR J1924+1631 was discovered shortly after the precursor survey was completed, when the PALFA survey underwent an upgrade to a new backend with three times more bandwidth. This source was then retroactively found in precursor survey data with (S/N)meas just above the detection threshold and has therefore been included in analysis that follows. Strong RFI present in the refolded precursor data explains why this source was not discovered earlier. P. Lazarus (2014, in preparation) will describe the most recent processing pipeline in detail, address the RFI environment and its effect on the PALFA survey’s “true” sensitivity.
4. PMPS OVERLAP REGION
The PALFA precursor survey region overlaps the region covered by the PMPS in Galactic longitude, 36◦ 50◦. Although there were 58 previously known pulsars in this longitude range and within ∼1◦ of the Galactic plane when the precursor survey took place (see Figure2), we compare the PMPS and precursor survey detections only based on sources deemed detectable by the precursor survey. We justify this criterion based on the fact that, due to patchy coverage, only
∼10% of the overlap region lies within an angular offset
Δθ ∼ 1.2 of a precursor beam center. We choose 1.2 since this is the average angular offsetΔθ = FWHM/2√2 for the precursor survey. Half of all sources that fall within a radius
R =FWHM/2 of the nearest beam center will also be within the average angular offsetΔθ.
The PMPS discovered or detected all 24 of the previously known pulsars in this region considered detectable by the PALFA precursor survey. The precursor survey detected 21 of these, and discovered an additional four sources in this region. The PMPS retroactively detected two of these four precursor discoveries in archival data (e.g., Lorimer et al.2006).
One of the three detectable known pulsars that the precursor survey missed, B1910+10, had a (S/N)th value of ∼11 (see Table1), just above the detectability threshold of (S/N)th=9; the other two, J1913+1145 and B1911+11, were expected to be detected with (S/N)th = 23 and 36, respectively. Error in (S/N)this∼30%, which reflects the error in flux measurements and can easily explain the first non-detection. It is much harder to explain why J1913+1145 and B1911+11 were not detected, given their high (S/N)th values, but other systematics such as RFI and scintillation may explain these discrepancies.
The four precursor survey discoveries—J1901+0621, J1904+0738, J1905+0902 and J1906+0746—have relatively high dispersion measures and were all detected near the signal-to-noise threshold with 15<(S/N)meas <22, so it is not
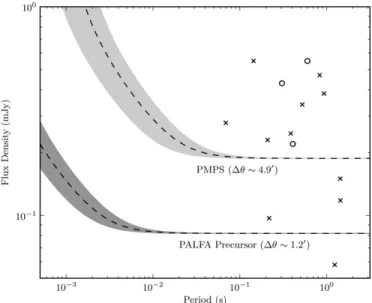
sur-Figure 3.Sensitivity as a function of period for the precursor survey is shown
in dark gray; the PMPS curve (light gray) is shown here for comparison. The dashed lines in each case show the sensitivity to DM=100 pc cm−3sources,
while upper and lower limits of the shaded regions give minimum flux density sensitivity to pulsars with DM=150 or 50 pc cm−3, respectively. These curves
are plotted using the average angular offsetΔθbetween a source and a beam position. For a random distribution of pulsars on the sky,∼50% should fall within an angle Δθfrom the nearest beam position. Precursor survey discoveries are superimposed as×, while expected detections B1910+10, B1911+11 and J1913+1145 that were missed by the PALFA precursor survey, but detected by PMPS are shows with.
prising that they were not detected by previous surveys. PSR J1906+0746 is a 144 ms pulsar in a relativistic, 3.98 hr orbit and was initially missed during manual inspection of PMPS candidate plots due to RFI with a period similar to that of the pulsar (Lorimer et al.2006). Both J1906+0746 and J1901+0621 were found retroactively in Parkes data, which was expected, given that both are moderately bright sources with flux densi-ties at 1400 MHz of about 0.5 mJy. The other two discover-ies, J1904+0738 and J1905+0902, are much fainter—0.23 and 0.097 mJy, respectively (Nice et al. 2013). These discoveries show preliminary evidence that with Arecibo’s high sensitiv-ity, the PALFA precursor survey probed a deeper and lower-luminosity pulsar population than previous surveys. However, the three unexpected non-detections suggest that the PALFA pre-cursor survey did not realize its full sensitivity and more work is required to better understand Arecibo’s RFI environment and develop mitigation techniques.
The relative sensitivity limits as a function of period and DM for the PMPS and precursor surveys are compared in Figure3. To generate these curves, we used an averageTskyvalue for each survey region, assumed a constant pulse duty cycle ofδ =0.05, and applied the empirical pulse broadening function from Bhat et al. (2004) to account for multipath scattering in the interstellar medium. For the three objects that were detected at Parkes, but not in the PALFA precursor survey (B1910+10, J1913+1145 and B1911+11), all have periods between 300 and 600 ms, a regime where the PMPS nominal sensitivity limit in Figure3 is about twice as high as the precursor survey’s. However, the angular offsets to these sources (6.6, 4.7 and 2.5, respectively, for PMPS and precursor values can be found in Table1) im-ply that both surveys were equally sensitive to them since the PALFA precursor beam (FWHM∼3.35) is much narrower than that of the PMPS (FWHM∼14.4) and its sensitivity therefore drops off more quickly as a function of Δθ. Taking angular
The Astrophysical Journal, 787:137 (10pp), 2014 June 1 Swiggum et al. offsets into account, B1910+10 (S1400=0.22 mJy) falls below
the adjusted minimum sensitivity limit (∼0.26 mJy for both sur-veys), but B1911+11 and J1913+1145 do not, so angular offsets alone do not explain why these sources went undetected. Since other sources with lower flux densities and similar angular off-setsweredetected (i.e., J0628+0909, J1906+0649, J1906+0912, J1907+0740, J1907+0918, J2011+3331), we conclude that tran-sient effects such as RFI decreased the signal-to-noise ratios of B1910+10, B1911+11 and J1913+1145 and possibly scintilla-tion for the former two.
5. POPULATION ANALYSIS
The analysis presented here usesPsrPopPy—a package that models the Galactic population and evolution of pulsars. With this software, we populated a synthetic galaxy with pulsars whose attributes like cylindrical spatial coordinates, period, DM, luminosity, etc. were chosen from pre-determined PDFs (Lorimer et al.2006).PsrPopPy24is a Python implementation ofPSRPOP,25 which was written in Fortran (Lorimer et al. 2011); it shares much of the same functionality, but the object-oriented nature of Python and improved modularity of the code make it more readable and easier to write plug-ins for specific modeling purposes. Further details on thePsrPopPy software package are forthcoming (Bates et al.2014).
5.1. Generating Pulsar Population PDFs
In order to deduce the sizes of the underlying Galactic normal and millisecond pulsar populations, we compared the results ofPsrPopPy simulations to the PALFA precursor survey’s detection statistics for each of these two classes of pulsar. In each case, we made a set of assumptions about the underlying population (see Table2) and drew spatial and intrinsic pulsar parameters from assumed distributions to form a synthetic Galactic population. We simulated a survey of this synthetic population by computing (S/N)thas was discussed in Section3. Again, detections were then defined as sources with (S/N)th > 9. The assumptions that went into our simulations, outlined in Table 2, were largely drawn from the work by Lorimer et al. (2006) for the normal pulsar population. In that paper, however, the luminosity distribution for normal pulsars was assumed to behave as a power law with a low-luminosity cutoff of 0.1 mJy kpc2. Since the PALFA precursor survey’s sensitivity dips below this cutoff value in some cases, we instead adopt a log-normal luminosity distribution, introduced by Faucher-Gigu`ere & Kaspi (2006).
Since far fewer MSPs are known, we have very little infor-mation about the population’s spatial and intrinsic parameter distributions, so some assumptions are simply adopted from the normal pulsar population (luminosity and radial distributions), while others are grounded in some preliminary experimental results (scale height, period, and duty cycle distributions). In this case, we used a Gaussian radial distribution with a standard deviation of 6.5 kpc and an exponential scale height larger than that of normal pulsars to reflect the fact that MSPs are distributed more uniformly across the sky. The Gaussian radial model for MSPs in the Galaxy is similar to that of normal pulsars, but makes no assumption about a deficiency of sources toward the Galactic center, an effect observed from fullnormalpulsar pop-ulation synthesis and modeled with a Gamma function (Lorimer et al.2006).
24 https://github.com/samb8s/PsrPopPy 25 http://psrpop.sourceforge.net/
Figure 4.This histogram shows the ad-hoc MSP period distribution used in
simulations, which peaks at periods close to 3 ms. A more precise, empirically based distribution is forthcoming and will be based on MSPs detected in the PMPS and HTRU surveys.
We adopted the period distribution shown in Figure4 from Lorimer (2013), where it was initially realized by adjusting the weights of various bins from a flat distribution (in logP) until preliminary simulations matched the sample of observed MSPs from PMPS. Unlike normal pulsar duty cycles, which show inverse proportionality to the square root of spin period (i.e., shorter-period pulsars have wider pulses), MSPs tend to exhibit relatively constant duty cycle across period, with larger scatter about some mean value than the normal pulsar population (Kramer et al.1998; Smits et al.2009). Therefore, our simulations assumed MSP duty cycles to be independent of period.
To make the simulated detections as realistic as possible, we used precursor survey parameters in signal-to-noise ratio calcu-lations, and modifiedPsrPopPyto accept the survey’s true point-ing positions, as well as correspondpoint-ing integration times and spe-cific beam gain values. For each population class, we performed simulated precursor surveys across a range of trial population sizes (85,000–130,000 for normal pulsars and 5000–50,000 for MSPs). For each trial, we performed 2000 simulated realiza-tions of independent Galactic popularealiza-tions for MSPs and normal pulsars respectively. To form a likelihood function describing pulsar population size, we compared the results of these simula-tions to the true number of detecsimula-tions for each population class in the precursor survey. The precursor survey only detected a single MSP (B1937+21), so the likelihood was computed by dividing the number of simulations that resulted in a single de-tection by the total number of simulations at that population size.
Of the 45 detections listed in Table1, we exclude B1937+21 (MSP) from our normal pulsar analysis. Although J1906+0746 is in a binary system, it is a young pulsar with a characteristic age of 112 kyr and has likely not undergone recycling from its companion, so we include it in our analysis. The likelihood function was formed by dividing the number of simulations that detected 44 pulsars by the total number of simulations at a given trial population size. We fit binomial distributions to simulated likelihood functions for normal and MSP populations (shown in Figure5) in order to smooth simulation results and
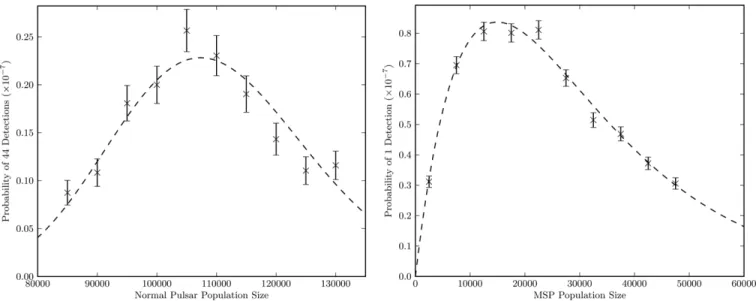
Figure 5.In each plot, black× show results of 2000 population simulations at 10 different trial pulsar population sizes. The normal pulsar population PDF (left plot) was constructed with trial simulations using population sizes between 85,000 and 130,000 sources, while the MSP PDF (right plot) used between 5000 and 50,000 sources in trial simulations. In both cases the black dashed line shows a normalized binomial distribution fit to the data. Using these fits, we find that the most probabledetectableGalactic normal and millisecond pulsar population sizes are∼107,000 and∼15,000, respectively.
Table 2
Parameters Used in Population Simulations
Prior Distribution Parameter Normal PSR Simulations MSP Simulations Luminosity Log Normal:μ= −1.1;σ=0.9 Log Normal:μ= −1.1;σ=0.9 Period Log Normal:μ=2.7,σ= −0.34 (see Figure4) Radial Gamma Function: (see Lorimer et al.2006) Gaussian:σ=6.5 kpc
Scale height 0.33 kpc 0.5 kpc
Duty Cycle (explained in Section5.1) (explained in Section5.1)
Electron Model NE2001 NE2001
Notes.Assumed parameter values/distributions for normal and millisecond pulsar populations respectively. These
parameters are used as input values to the appropriatePsrPopPyfunctions, which generate an underlying, synthetic population. Changing input parameters directly affects the number of detections expected from a given simulated survey.
provide integrable functions to determine confidence intervals. For an underlying population of sizeN, a given simulation has
n successes (detections) and N−n failures (non-detections); these kinds of binary outcomes are nicely modeled by binomial distributions.
The binomial distributions provide the functional form
p(n|N, θ)= N!
n!(N−n)!θ
n
(1−θ)N−n, (4) which describes the probability of drawingnpulsars from a total population ofNgiven some detection probabilityθ. To select theθ value that produces posterior PDFs that best match the simulated data, we chose the one that minimizedχ2, computed by comparing simulated to expected population distributions. Finally, the posterior population size PDFs are normalized so that they could be used to quote confidence intervals. With some numbernsuccessof successful realizations (simulations in which the target number of detections is reached), the Poissonian error is given by√nsuccess. Data points that reflect the probability of detecting exactly the target number of pulsars at a trial population size and their error bars are multiplied by the same constant required to normalize the best fit PDF. After looking at multiple realizations of the simulated data presented in Figure5 and comparing the standard deviation of data points at each population size to assumed Poissonian error bar magnitudes,
we determined that the Poisson model accurately reflects the uncertainties in population sizes.
By integrating the PDFs shown in Figure5, we find the mode and 95% confidence interval for the normal pulsar population size to be 107,000+36−25,,000000. We find a lower mode for the MSP population size, 15,000+85−6000,000 and the high uncertainty in the corresponding 95% confidence interval reflects the fact that our prediction depends on a single MSP detection in the precursor survey. These results describe the respective Galactic pulsar populations that are beaming toward Earth and errors on most likely population sizes account only for statistical uncertainties due to the limited number of detections in the PALFA precursor survey, not for other sources (e.g., uncertainties in scale height, luminosity distribution, electron density model, etc.).
The confidence interval that the precursor survey places on the normal pulsar population is consistent with earlier results; Faucher-Gigu`ere & Kaspi (2006) predict 120,000 ± 20,000 detectable normal pulsars, also using a log-normal distribution to model the pulsar luminosity function. The predicted MSP population size is also consistent with previous estimates; the upper limit we find easily encompasses the population size prediction made by Levin et al. (2013), although the lower limit quoted in that paper, 30,000±7000, is more constraining. Neither of these 95% confidence intervals is tight enough to put strict constraints on normal or millisecond pulsar population
The Astrophysical Journal, 787:137 (10pp), 2014 June 1 Swiggum et al. sizes, but the consistency is encouraging and we expect the full
PALFA survey to place much more stringent constraints on these populations when complete.
6. RESULTS AND DISCUSSION
Using input parameters from Table2to generate a synthetic, Galactic normal pulsar population, we found that the PALFA precursor survey should be expected to detect ∼40 sources. Through periodicity searches, 43 were found, which indicates that current population parameters, initially determined using PMPS results, are already quite accurate and applicable to a variety of situations. As we mentioned in Section 3.1, three sources that we expected to detect were not detected, but it is common for (S/N)thand (S/N)measvalues to not match perfectly. Due to uncertainties in initial flux measurements, there can be as much as ∼30% fractional error in (S/N)th. Referring again to Figure 1, we show a general trend toward a slope of unity when plotting theoretical versus measured S/N for the detections made by the precursor survey, but there is significant scatter in these comparisons. Scatter like this can be caused by scintillation, RFI, poor prior flux measurements or some combination of all of these.
The precursor survey discovered 11 pulsars, 4 of which fell inside the region overlapping PMPS, allowing us to directly compare their respective sensitivities. While PMPS detected al-most three times as many sources in this region, this discrepancy was largely due to the differences in sky coverage—PMPS cov-ered this area uniformly, while the precursor survey had large blocks of coverage missing and slight gaps between pointings due to a “sparse sampling” technique. In fact, only∼25% of the overlap region was covered by the precursor survey to a sensi-tivity greater than or equal to that of PMPS. Even so, the PALFA precursor survey discovered four pulsars that PMPS missed; two of these four were retroactively found by reanalyzing archival data but the others(J1904+0738 and J1905+0902) have high dis-persion measures and very low fluxes—an encouraging, albeit small, piece of evidence that Arecibo’s sensitivity gives PALFA a glimpse at fainter and more distant pulsars. Figure 3 in Nice et al. (2013) uses more recent PALFA discoveries to show fur-ther evidence of PALFA probing deeper than previous surveys as do recent discoveries mentioned in Crawford et al. (2012).
We simulated a range of Galactic pulsar populations—both non-recycled and recycled—of various sizes and used the PALFA precursor survey’s detection statistics to place limits on normal and millisecond pulsar population sizes respectively. By comparing experimental results to simulations, we formed PDFs for normal and MSP population sizes, then integrated these PDFs to define confidence intervals.
Assuming the most probable normal and millisecond popula-tion sizes according to the simulapopula-tions described in Secpopula-tion5.1 are correct, we ran 1000 trials with the same distribution pa-rameter assumptions for each population to determine the most likely number of detections by the beginning of 2014 and after PALFA is complete. Averaging the results of these 1000 trials in each case, we determine a predicted number of detections, then quote errors that are directly proportional to the 95% con-fidence limits from normal and millisecond pulsar population PDFs. Following this procedure, we expect the full PALFA sur-vey to detect 1000+330
−230normal pulsars (this includes previously known sources that are re-detected) and 30+200
−20 MSPs. Identi-cal estimation techniques predict that 490+160−115 normal pulsars and 12+70
−5 MSPs should have been detected by the beginning of
2014, but at the time, PALFA had detected 283 normal pulsars and 31 MSPs, respectively.26
The discrepancy between observed and predicted detection rates is notable for the normal pulsar population. Given the num-bers quoted here, PALFA has currently detected just over 50% of the expected number of normal pulsars, according to simula-tions. These simulations do not yet take into account the local RFI environment of the PALFA survey, which certainly plays a role in the perceived dearth of pulsar detections as of early 2014. Two pulsars that went undetected by bothQuicklook andPresto1 pipelines in the precursor survey, J1906+0649 and J1924+1631, provide evidence that initial processing techniques were not optimal and improvements are necessary. In repeated simulations of precursor detections in the inner Galaxy region, we find 30–50% of simulated, detectable sources had S/N val-ues between 9 and 15 (just above the detection threshold). In the precursor survey, only about 10% of detections had (S/N)meas values in this regime. Although the precursor survey discov-ered mostly low flux density sources, the fact that only a small fraction of detections were near the S/N threshold suggests that some sources were missed or assumptions that determine our sensitivity curves are not entirely correct.
A potential factor of two lower sensitivity to normal pulsars because of RFI would bring the survey yield and simulated population into agreement. The most recent PALFA survey pipeline will be described in depth by P. Lazarus (2014, in preparation) and that paper will also construct PALFA’s “true” sensitivity curve, taking into account the RFI environment by injecting artificial signals of varying strength into real data. In future work, we will reprocess precursor survey data with the current pipeline to see if it improves the shortcomings of earlier versions (e.g., inconsistent detection statistics, noted in Table1). The assumed radial distribution of pulsars in the Galaxy (see Table2) could also contribute to the discrepancy between ex-pected (simulated) and true pulsar yields. Since the distribu-tion is based on extrapolated results from the PMPS, which surveyed higher-populated regions of the sky, population den-sity estimates for longitudes farther from Galactic center may be inaccurate. Overestimated pulsar population densities in the Galactic longitude range surveyed by the PALFA precursor sur-vey could be a factor in the discrepancies we find between expected and actual pulsar detections there. Future refinement of pulsar population models using PALFA results will provide consistency checks for existing population model parameters.
We note that the current number of MSPs detected by PALFA is consistent with predictions, but this is not surprising, given the high uncertainties in our model due to the precursor survey only detecting one MSP. As the number of detections increases, future predictions will be far more constraining so that we can re-examine initial assumptions about the MSP population characteristics.
Future population studies with the complete PALFA survey will contribute substantially to current population models be-cause of the Galactic longitude ranges covered and Arecibo’s unrivaled sensitivity (especially in the millisecond pulse period regime). As the number of normal and millisecond pulsar detec-tions increases, our ability to refine specific, simulated model parameters that describe each underlying population will im-prove significantly.
26 Seehttp://www.naic.edu/∼palfa/newpulsarsfor discoveries; re-detected
The Arecibo Observatory is operated by SRI International under a cooperative agreement with the National Science Foun-dation (AST–1100968), and in alliance with Ana G. M´endez-Universidad Metropolitana, and the Universities Space Research Association. M.A.M. and J.K.S. are supported through NSF PIRE award 0968296. D.J.N. is supported through NSF grant 0647820. V.M.K. was supported by an NSERC Discovery and Accelerator Grant, the Canadian Institute for Advanced Re-search, a Canada Research Chair, Fonds de Recherche Nature et Technologies, and the Lorne Trottier Chair in Astrophysics. J.W.T.H. acknowledges funding from NWO and ERC. Work at Cornell was supported by NSF Grants 0507747 and 1104617 and made use of the Cornell Center for Advanced Computing. Pulsar research at UBC is supported by an NSERC Discovery Grant and Discovery Accelerator Supplement and by the Canada Foundation for Innovation. P.L. acknowledges support of IMPRS Bonn/Cologne and NSERC PGS–D.
REFERENCES
Allen, B., Knispel, B., Cordes, J. M., et al. 2013,ApJ,773, 91 Bates, S. D., Bailes, M., Bhat, N. D. R., et al. 2011,MNRAS,416, 2455 Bates, S. D., Lorimer, D. R., Rane, A., & Swiggum, J. 2014,MNRAS,439,
2893
Bhat, N. D. R., Cordes, J. M., Camilo, F., Nice, D. J., & Lorimer, D. R. 2004,ApJ, 605, 759
Burgay, M., Bailes, M., Bates, S. D., et al. 2013,MNRAS,433, 259 Cordes, J. M., & Chernoff, D. F. 1997,ApJ,482, 971
Cordes, J. M., Freire, P. C. C., Lorimer, D. R., et al. 2006,ApJ,637, 446 Cordes, J. M., & Lazio, T. J. W. 2003, arXiv:astro-ph/0301598 Crawford, F., Stovall, K., Lyne, A. G., et al. 2012,ApJ,757, 90
Demorest, P. B., Ferdman, R. D., Gonzalez, M. E., et al. 2013,ApJ,762, 94
Dewey, R. J., Taylor, J. H., Weisberg, J. M., & Stokes, G. H. 1985,ApJL, 294, L25
Dowd, A., Sisk, W., & Hagen, J. 2000, IAU Colloq. 177: Pulsar Astrono-my—2000 and Beyond (San Francisco, CA: ASP),202, 275
Faucher-Gigu`ere, C.-A., & Kaspi, V. M. 2006,ApJ,643, 332
Faulkner, A. J., Stairs, I. H., Kramer, M., et al. 2004,MNRAS,355, 147 Haslam, G., Wielebinski, R., & Priester, W. 1982, S&T,63, 230 Hobbs, G., Faulkner, A., Stairs, I. H., et al. 2004,MNRAS,352, 1439 Keith, M. J., Jameson, A., van Straten, W., et al. 2010,MNRAS,409, 619 Kramer, M., Bell, J. F., Manchester, R. N., et al. 2003,MNRAS,342, 1299 Kramer, M., Xilouris, K. M., Lorimer, D. R., et al. 1998,ApJ,501, 270 Lazarus, P. 2013, in IAU Symp. 291, Neutron Stars and Pulsars: Challenges
and Opportunities After 80 Years, ed. T. Montmerle,35
Levin, L., Bailes, M., Barsdell, B. R., et al. 2013,MNRAS,434, 1387 Lorimer, D. 2011, ascl soft,7019
Lorimer, D. R. 2001, LRR,4, 5 Lorimer, D. R. 2005, LRR,8, 7 Lorimer, D. R. 2010, HiA,15, 807
Lorimer, D. R. 2013, in IAU Symp. 291, Neutron Stars and Pulsars: Challenges and Opportunities After 80 Years, ed. T. Montmerle,237
Lorimer, D. R., Bailes, M., Dewey, R. J., & Harrison, P. A. 1993, MNRAS, 263, 403
Lorimer, D. R., Faulkner, A. J., Lyne, A. G., et al. 2006,MNRAS,372, 777 Lorimer, D. R., & Kramer, M. 2005, Handbook of Pulsar Astronomy
(Cam-bridge: Cambridge Univ. Press)
Lorimer, D. R., Stairs, I. H., Freire, P. C., et al. 2006,ApJ,640, 428 Manchester, R. N., Hobbs, G. B., Teoh, A., & Hobbs, M. 2005, yCat,7245, 0 Manchester, R. N., Lyne, A. G., Camilo, F., et al. 2001,MNRAS,328, 17 Mickaliger, M. B., Lorimer, D. R., Boyles, J., et al. 2012,ApJ,759, 127 Morris, D. J., Hobbs, G., Lyne, A. G., et al. 2002,MNRAS,335, 275 Nice, D. J., Altiere, E., Bogdanov, S., et al. 2013,ApJ,772, 50 Ransom, S. M., Eikenberry, S. S., & Middleditch, J. 2002,AJ,124, 1788 Siemens, X., Ellis, J., Jenet, F., & Romano, J. D. 2013,CQGra,30, 224015 Smits, R., Lorimer, D. R., Kramer, M., et al. 2009,A&A,505, 919
Spitler, L. G., Cordes, J. M., Hessels, J. W. T., et al. 2014, ApJ, submitted (arXiv:1404.2934)