PERFORMANCE ANALYSIS OF ROUNDABOUTS USING EMPIRICAL
METHOD FOR INDIAN SCENARIO
Master of Technology
In
Transportation Engineering
By
SHWETA RAO
(Roll No: 213CE3090)
DEPARTMENT OF CIVIL ENGINEERING
NATIONAL INSTITUTE OF TECHNOLOGY, ROURKELA
ODISHA – 769 008
PERFORMANCE ANALYSIS OF ROUNDABOUTS USING EMPIRICAL
METHOD FOR INDIAN SCENARIO
A Thesis Submitted in Partial Fulfillment of the Requirements for the Degree of
Master of Technology
In
Transportation Engineering
By
SHWETA RAO
(Roll No: 213CE3090)
Under the Guidance of
Prof. P.K. BHUYAN
DEPARTMENT OF CIVIL ENGINEERING
NATIONAL INSTITUTE OF TECHNOLOGY, ROURKELA
ORISSA -769008, INDIA
DEPARTMENT OF CIVIL ENGINEERING
NATIONAL INSTITUTE OF TECHNOLOGY, ROURKELA
ODISHA-769008
CERTIFICATE
This is to certify that the thesis entitled, “PERFORMANCE ANALYSIS OF ROUNDABOUTS USING EMPIRICAL METHOD FOR INDIAN SCENARIO” is a record of bonafide work and sincere efforts carried out by Shweta Rao under my supervision and is submitted in partial fulfillment of the requirementfor the award of Master of Technology in Civil Engineering with specialization in Transportation Engineering in the Department of Civil Engineering, National Institute of Technology, Rourkela, Odisha for the academic year 2013-2015. To the best of my knowledge, the matter embodied in the thesis has not been submitted to any other University/Institute for theaward of any degree or diploma.
Date: Dr. P. K. Bhuyan
Department of Civil Engineering National Institute of technology Rourkela, Odisha-769008
ii
ACKNOWLEDGEMENT
First of all, I offer my sincere gratitude and respect to my project supervisor, Dr. P.K. Bhuyan, Professor of the Civil Engineering Department, for his invaluable support and suggestions throughout the course of my study. I consider myself extremely fortunate to have had the opportunity of associating myself with him for one year. This thesis was made possible by his patience and persistence attitude.
I am very thankful to Dr. S.K. Sahu, HOD of Civil Engineering Department, Dr. Mahabir Panda and Dr. U.C. Chattraj for their helpful suggestions during my entire course work. I also extend my sincere thanks to the Department of Civil Engineering.
I express my sincere thanks to different officials, friends and family from different parts of the country who have helped a great deal to collect the vast data sets and Ashish Patnaik, Research Scholar NIT Rourkela for his support and suggestions.
I also want to convey sincere thanks to my colleagues Yadu Krishna, A. Priyanka, Ch Haritha and all others for their help and support throughout my project work. I would also like to present my gratitude to Transportation Engineering specialization for making my stay in the campus a pleasant one.
iii
CONTENTS
Acknowledgements i
List of Contents ii
List of Figures vi
List of Tables vii
Abstract viii
1. INTRODUCTION
1.1 General 1
1.2 Problem Statement 2
1.3 Scope and Objective 3
1.4 Organisation of Report 4
2. LITERATURE REVIEW
2.1 General 5
2.2 Effect of Geometry on Capacity 6
2.3Various Existing Empirical Models 6
2.3.1 UK TRRL model 7
2.4 Other Research on Empirical Methods 7
2.6 Summary of Literature 8
3. STUDY METHODOLOGY
3.1 General 9
3.2 Geometric Variables of Roundabouts 9
3.3 Entry and Circulating Flow Data 10
3.4 Development of Model 10
iv 4. STUDY AREA AND DATA COLLECTION
4.1 General 12 4.2 Study Area 13 4.2.1 Roundabouts in Odisha 13 4.2.2 Roundabout in Jharkhand 15 4.2.3 Roundabout in Maharashtra 16 4.2.4 Roundabouts in Kerala 17
4.2.5. Other site data used 17
4.3 Data Collection 18
5. RESULTS AND ANALYSIS
5.1 Data Extraction 20
5.2 Analysis of data 22
5.2.1 Relationship between entry and circulating flow 22 5.2.2 Relationship between entry flow and various geometric elements 23
5.3 Model Development 24
5.4 Validation of Model 25
5.5 Comparison of Developed Model with Existing Models 26 5.6 Change in entry capacity per change in geometric variable 27
5.6.1 Variation in entry radius 27
5.6.2 Variation in central island diameter 27 5.6.3 Variation in entry and weaving width 28
5.6.4 Variation in weaving length 28
5.7 Determination of Level of Service using K-means Clustering 28 6. SUMMARY AND CONCLUSIONS
v
6.2 Conclusions 29
6.3 Future Scope of Study 29
vi
LIST OF FIGURES
Figure 1.1 Roundabout and movement of vehicles around it 1 Figure 4.1 Location of various sites in Indian map 14 Figure 4.2 Location and view of Bisra Chowk, Rourkela 14 Figure 4.3 Location and view of Jobra Square, Cuttack 15 Figure 4.4 Loacation and view of Albert Ekka Chowk, Ranchi 16
Figure 4.5 Layout of Medical Square, Nagpur 16
Figure 4.6 Location and view of Valiyakavala, Vaikom 17 Figure 5.1 Relationship between entry and circulating flow for SW entry of
Valiyakavala Junction
22
Figure 5.2 Relationship between entry and circulating flow for 10 entries 23 Figure 5.3 Validation results for Panposh Chowk, Rourkela 25 Figure 5.4 Comparison of results obtained by various models 26
vii
LIST OF TABLES
Table 5.1 Details of Traffic Volume at Medical Square, Nagpur 21 Table 5.2 Details of Geometric elements of Medical Square 22 Table 5.3 Significance values for regression for various geometrics 23 Table 5.4 LOS for different q/c ratio obtained from K-means clustering 52
viii
ABSTRACT
With hike in road traffic due to globalization, it has become a necessity to develop a transportation network which could handle the present as well as the future traffic efficiently. To do so, proper designing and analysis of various infrastructures is to be done. One such infrastructure induced in road network to increase the efficiency of intersections by reducing the delay is roundabouts. Presently, as such no robust model is available for Indian traffic conditions to determine the performance of roundabouts. So, an attempt has been made to develop a model to determine performance of roundabouts based on capacity. From the existing global models, it was observed that the geometrics of the roundabout played a crucial role in addressing the roundabout capacity. Thus, with this aspect as foundation, a model for entry capacity was developed for heterogeneity in Indian traffic. For modelling, data from various roundabout with varying geometry and flow properties were selected for including affect due to variations. In all, five geometric elements were observed to have significant impact on capacity. The degree of saturation, determined by taking ratio of the existing mean flow values and estimated capacity was considered as parameter to determine the level of service thresholds using K-means clustering. Most of the entries were found to work at capacity flows, indicating scope for better design aspects. The comparison of developed model with existing models showed that the UK and the Jordan model underestimated the capacity as compared to the developed model.
1
1. INTRODUCTION
1.1 General
Road network is a very important aspect of transportation system as it connects even the smallest towns and cities. Emerging road traffic in medium and large cities is of major concern to develop a network which would be able to satisfy the needs of traffic. Intersections are very important part of this network and are to be designed properly so as to handle the traffic efficiently. Unsignalized intersections play an important role in road network to divert the traffic properly. They help in free movement of traffic without any constraint as in case of signalized intersection.
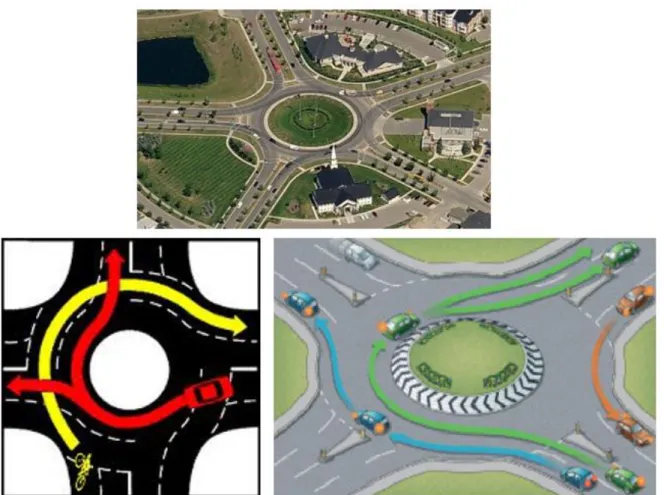
Unsignalized intersection has a drawback of large number of conflict points. As the number of lanes increase, the unrest at the intersection also increases drastically. Over the years, many reforms have been made to reduce this. Initially, the traffic at intersection was controlled by policemen. Then in later years, rotaries were introduced. The concept of rotaries was then modified to what we call as roundabouts. A roundabout is a type of circular intersection or junction in which road traffic flows almost continuously in one direction around a central island. Figure 1.1 shows the image of a general roundabout and the movement of vehicles at the roundabout.
Introduction of roundabouts at intersection had many advantages other than eliminating the conflict points which lead to perpendicular crashes. It reduces driver confusion associated with perpendicular junctions and also reduces the queuing caused due to signalization. It simplifies the pedestrian visual environment as the traffic is unidirectional. They allow U-turns within the normal flow of traffic, which often are not possible at other forms of junction. Moreover, roundabouts prove to be eco-friendly as it causes less pollution, since vehicles on average spend less time idling at roundabouts than at signalized intersections. Along with it, the emission produced by engine is
2
also less as vehicle don't come to stop at junction, they need to give way. Additionally, slow moving traffic in roundabouts makes less noise than traffic that must stop and start, speedup and brake. These parameters make it essential to design these roundabouts efficient enough to handle the traffic conditions.
Figure 1.1 Roundabout and movement of vehicles around it
1.2 Problem statement
The developing road network and hike in traffic has increased the complexity of traffic behaviour. The models developed to analyze the traffic behaviour take homogeneous nature of
3
traffic, while the traffic conditions here are highly heterogeneous. Very little study has been made in Indian context regarding this issue.
The intersection is a place with numerous conflict points and needs a higher safety concern and proper design. The roundabouts are the emerging type of intersection in Indian context. The code referred to information is dated back to 1976. There is a need of lot improvisation in specific code to give proper way to calibrate the capacity of roundabouts for traffic behaviour in India. A robust equation to find the operational performance measures of roundabouts are not provided in the code are need to be analysed.
1.3 Scope and Objective
The objective of this study is(i) To observe the various influential factors regarding the change in traffic behaviour like vehicle composition and its efficiency since 1976, when the code was initially formed. (ii) To study the heterogeneity of traffic conditions at roundabout sites.
(iii) To select appropriate sites such as to cater maximum variations in terms of geometry, location and traffic composition.
(iv) Development of a model to estimate the capacity of roundabouts for urban areas in India using above parameters.
(v) To assess the validity of existing models to Indian traffic scenario.
(vi) Validating the developed model and comparing the results with the other existing models.
4
1.4 Organization of the report
The project is organized in the following way:
Chapter 1 gives an introduction about the necessity and importance of roundabout in present traffic scenario. It gives the objective and scope of study to be conducted in brief.
Chapter 2 provides a detail description of the various literature available on the operational analysis of roundabouts around the world till date. The literature on macroscopic models, micro simulation, turbo roundabouts and signalized roundabouts are explained in detail.
Chapter 3 describes the detailed procedure for developing an empirical model to estimate the entry capacity of roundabout and the parameters considered for the same. Along with these a brief description of existing models on empirical analysis used around the world are explained, which has been further used for comparison with developed model.
Chapter 4 is about the location of study area undertaken to observe the traffic behaviour at the roundabouts. It also describes the procedure used to collect data at the site and time of collection. Various components which have been collected from the field survey are described.
Chapter 5 shows the results obtained using the collected data, including the data extracted from the site data, equation obtained for capacity and comparison of developed model with existing models for capacity estimation. The effect of change in geometrics on capacity is also depicted using plots.
Chapter 6 gives the summary and conclusion of the study performed on the entry capacity in Indian scenario and also the future scope which can be performed on the topic.
5
2. LITERATURE REVIEW
2.1 General
Roundabouts have been the area of interest for the engineers since long back in many European and American Countries. Significant study have been conducted on traffic behaviour at roundabouts over years taking the change in size and shape of roundabouts into account. The research resulted in formation of eminent models to estimate the capacity and other performance parameters. As a results several guidelines have been published by these countries stating the procedure to estimate the capacity of roundabouts and also other factors affecting the performance and design of roundabouts. Among these publishing’s is the UK TRRL model developed by Kimber (1980) [1] based on empirical analysis of roundabout capacity. To develop this model, vast data from 86 roundabouts operating to capacity from different parts of the country were collected. The model considered the dependence of entry capacity on six different geometrics, central island diameter, entry width, flaring, entry angle, and approach half width and entry radius. The equation developed so long back still proves to satisfy the present traffic conditions in the country.
Another informational guide for the roundabouts design and performance was developed by USA as NCHRP 572. It was improvised to NCHRP 672(2010) recently including the recent trends in roundabouts around the world. This guidelines provides the description of HCM 2010 method for estimating entry capacity of the roundabouts.
As far as the history of roundabouts in India is considered, very minute work has been done to determine roundabout characteristics. A guide which provides basic information about the rotaries in India was formed as IRC 65(1976). It summarizes the basics of the rotary intersections including the definition, various shapes, capacity and various geometric aspects of the rotary like
6
curvature, radii, weaving length, cambers, grades and sight distance. It also includes the pedestrian crossing, signs and marking of the rotary intersection.
2.2 Effect of Geometry on Capacity
Modern roundabout have undergone a drastic evolution from being a small post at the middle of the intersection to what it is today. Transformation in roundabout configurations in terms of geometry including inscribed circle diameter and circulatory roadway width became necessity with passage of time as the traffic scenario changed immensely.
One such study was conducted by Polus and Shmueli (2011) showing the capacity model depending solely on the inscribed circle diameter. The model related the entry and the circulating flow in exponential manner. It analysed the flow and geometric data from six small to medium-sized roundabouts and the individual and aggregated entry-capacity models were calibrated by using the diameter and circulating flows as explanatory variables. A change in case of circulating flow was considered by taking only the conflicting flow for modelling rather than complete circulating flow.
2.3 Various Existing Empirical Models
The history of roundabouts and their evolution is dated back to 1800s. But the process of being a modern roundabout from the ancient rotaries has seen immense changes through ages. Many researches had been carried out timely to change its shape and size along with the change in surroundings and globalization. The modern roundabout were first introduced in UK and then in USA. For the proper movement of traffic, the models to determine its performance were developed in many parts of world.
7
2.3.1 UK TRRL model
The first and the fore most model for estimating the capacity of roundabout by empirical analysis was developed by Kimber in 1980 for roundabouts in UK. At that time UK had many roundabouts which operated at capacity flow. This proved to be an advantage for the research and data from about 86 roundabouts was collected for the purpose of developing a strong model. The effect of various geometric parameters on the entry capacity was determined and six geometrics including entry width, approach width, flaring, entry angle, weaving width and central island diameter were finalized to form a model. Linear relationship was found between the entry capacity and the circulating flow. The model so developed is still suitable for the present traffic. Software based on this model were also developed and improvised. RODEL and ARCADY are the software packages based on this method.
2.4 Other Research on Empirical Methods
One of the initial comparative studies among the empirical and gap acceptance method was conducted by Kimber (1989) to check their suitability. The basic gap acceptance models didn’t take into consideration the phenomenon of priority reversal. It considered that the move-up time increases with lower flow in non-priority stream and the gap in doesn’t give rise to priority reversal. This was found to be the major drawback in case on roundabouts in UK. These lacunas were overridden by the empirical method which considered the geometric as the base parameters for the capacity estimation. This gave proper results for all levels of circulating flow. While the gap acceptance models overestimated the capacity of roundabouts during low circulating flow and underestimated during higher values of circulating traffic.
8
Leeuw et.al (1999) developed and calibrated a method to determine the capacity and delay of a single lane roundabouts in Netherlands. Three basic assumptions were considered in this model i.e. taking in account the influence of slow traffic into account completely, considering the roundabout as an single entity and using existing models for parts of roundabouts as much as possible and only modified or extended if necessary. The model so developed can be used as tool to analyze the traffic operations of single-lane roundabouts, taking fully into account the effect of cyclists with priority. The traffic flow was taken in form of OD matrix.
2.6 Summary
From the detail study on literature it could be summarized that the geometry of a roundabout plays a crucial role in determining its performance. Many researches have been carried out based on this aspect, which resulted in rigid models for different nations. When compared with other models, the models based on empiricism showed better results in some cases, while underestimated in other, especially, when used in different countries. On overall, it was found that the model based on geometry of a roundabouts along with flow characteristics gives a better explanation of its performance.
9
3. STUDY METHODOLOGY
3.1 General
The aspect of determining various performance parameters of the road elements for traffic behaviour has been studied in many countries. There are various methodology used in different parts of world for the determination of capacity and level of service of the roundabouts, which are based on different parameters and take into consideration different relation between the considered parameters. The parameters considered to decide the performance of roundabout are generally traffic flow, gap acceptance theory and geometric characteristics. Among those empirical models are regression models based on traffic volumes at entry or exit and circulating flows observed at at-capacity period of roundabout. The variation in the data are done by taking into consideration geometric characteristics and driver behaviour.
3.2. Geometric Variables of Roundabout
The entry capacity of a roundabout depends largely on its geometric properties like, central island diameter, entry width, entry radius, lane width, flaring, entry angle, weaving length and weaving width. Some of the geometrics can be easily measured on site using measuring tape, like central island diameter, entry and weaving width, weaving length, lane width etc. These had been collected on site itself during the off peak hours of traffic to avoid hindrance. For the development of model, five geometrics had been considered. Of which, the value of four geometrics had been measured on field and one was found out using software.
10
3.3 Entry and Circulating Flow Data
Apart from geometrics, the values of traffic flow per hour is required for both major and minor streams of the roundabout. Data is to be collected at the roundabouts during saturated flow conditions for minimum an hour, such that all the lanes could be utilized to maximum. Then the entry and the circulating flow is determined for every minute for each lane under continuous flow condition. Then relation between them is determined using various regression analysis for the best fit.
3.4 Development of Model
As many lanes as possible are to be considered for the development of model to get better results. For this purpose vast data is required from roundabouts operating at saturated flow conditions. From the data so obtained geometrics, entry and circulating flow data are to be obtained. The relationship is considered to be exponential for the best fit. The equation for every lane is of form
𝑞𝑒 = 𝐴 ∗ 𝑒−𝐵𝑞𝑐 (3.1)
Where, qe = entry flow in PCU/h
qc = conflicting flow in PCU/h
Then finally, taking into consideration the variations of geometrics into account along with the conflicting flow as explanatory variables, an equation is developed using multiple regression method for entry capacity. The capacity equation considers the variation as multiplicative form between the various factors used to develop the model.
11
3.5
k
-means Clustering for Level of Service
K-means is one of the algorithms to solve clustering problem. A k-means cluster analysis on a data set initially clusters the data based on K points representing group clusters. Then, each objects gets assigned to group with closest centroid and then the same procedure is repeated by calculating K centroids until there is no change in centroids.
This method for clustering had been adopted to distribute ranges for level of service (LOS) at roundabouts. The ratio between capacity and the mean entry flow had been taken as input for the cluster analysis. The strength of this clustering was decided based on the Silhoutte value.
12
4. STUDY AREA AND DATA COLLECTION
4.1 General
Indian being an assemblage of different cultures and customs, the behaviour of people varies extensively over the various parts of country. The development in terms of infrastructure in field of occupation, living environment and the transportation are also diverse. It can thus be summarized that the behaviour and composition of traffic along with road infrastructure is different in different parts of India. So, the question to select the appropriate site of the existing many roundabouts in India arises. Some principles which lay down for selection of site for data collection for purpose of model development are stated below:
Location of site in city- The location of site in the city determines the composition of traffic at the roundabout. Considering a roundabout situated at residential area, the proportion of independent mode of traffic would be predominant. Contradictorily, if the site lies at the outskirts of the city, the heavy vehicles connecting one place to another or on industrial purpose could be seen more in number.
Geometry of roundabout- It is the prime factor which is considered for forming a model. The change in geometry leads to great change in its performance. Thus, dissimilarity in terms of size of Central Island, number of approach legs and width of legs is important point of consideration.
Traffic composition- The nature of traffic changes with respect to state as the transportation facilities are significantly different. The frequency of public transport determines the composition of heavy vehicles and comparatively less usage of independent transportation techniques.
13
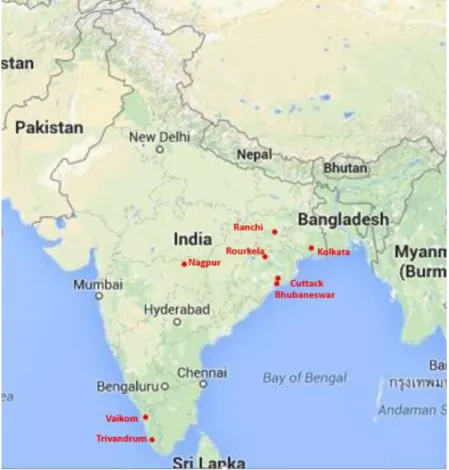
4.2 Study Area
To satisfy the requirements of site selections, many roundabouts were studied under initial survey. After detail emphasis on each parameter, 5 suitable sites were recognised for the purpose of data collection. The roundabouts considered were situated in five states of eastern, western and southern India (Odisha, Jharkhand, Maharashtra, and Kerala).. The sites included Bisra Chowk (Rourkela), Jobra Chowk (Cuttack), Albert Ekka Chowk (Ranchi), Medical Square (Nagpur) and Velliyakavala (Vaikom).The location of the roundabouts in Indian map is shown in Figure 4.1.
4.2.1. Roundabouts in Odisha
Data from two roundabouts has been collected from two different cities of Rourkela and Cuttack. Of the two cities, Rourkela is known for its Steel plant, which is one of the largest in India. It has a ring road joining all the places of economic importance and the steel plant. There are numerous roundabouts along this ring road. One of the busiest roundabouts among these is the Bisra Chowk. It has a large central island connecting six lanes around it. It joins the city market area to the railway station and the steel plant. The peak hour is observed during the morning office hours, when the vehicles stream continuously at very high rate. The two-wheelers is the predominant mode of transportation here. The image of Bisra Chowk from Ariel view is shown in Figure 4.2.
14
Figure 4.1 Location of various sites in Indian map
Figure 4.2 Location and view of Bisra Chowk, Rourkela
Another city from where the data has been collected was Cuttack, commonly known as twin city of Bhubaneswar. It lies in a coastal area with most of the trading through sea. Many
15
industries are hence located in the city. Data was collected from Jobra Chowk, which is located at junction of three roads. This site has huge number of heavy vehicles as it is located at outskirts of city. The sitemap and image of Jobra Chowk is shown in Figure 4.3.
Figure 4.3 Location and view of Jobra Square, Cuttack
4.2.2 Roundabout in Jharkhand
Jharkhand is known for its rich mineral reserves and thus is home for many mining activities. Ranchi, its administrative capital is a home for many business merchandise. The streets are highly compacted during the peak hours. Human drawn rickshaws are still found huge in number in whole city. The site considered in his city lies in centre of the market area with huge number of pedestrians and street vendors alongside the road. The Albert Ekka Chowk is shown in Figure 4.4 along with its site map.
16
Figure 4.4 Loacation and view of Albert Ekka Chowk, Ranchi
4.2.3 Roundabout in Maharashtra
Nagpur lies at the dead centre of the country with a zero-mile marker indicating the geographical centre of India. It is also one of the country’s most industrialized cities. The roundabout at Medical Square is a well-designed roundabout with six lanes and heavy traffic during peak hours. The lanes connect to various mass transit stations and educational institutes. It lies in commercial area of the city.
Figure 4.5 Layout of Medical Square, Nagpur
Motorcycles are found to be the predominant mode of transport in the study area. The hand drawn carts can also be found in considerable amount and are taken into account as animal drawn
17
vehicles. The number of heavy vehicles are less as the roundabout lies in the city market area. Pictorial view of Medical Square is shown in Figure 4.5.
4.2.4 Roundabouts in Kerala
Kerala is known for its diversity in cultures, traditions and geographic features. This makes tourism a special asset for the state. The vast forest resources lead to many small and large scale industries based on it. The site from this state was taken from a mid-sized city of Vaikom, known for its tourist attraction temples and beaches. The roundabout lies at the junction of four major roads, of which two are National Highways. The other two lanes connect to places of economic importance in the city. Mostly independent mode of traffic and heavy vehicles are found predominant in number. Figure 4.6 shows the view of roundabout in Vaikom and its site map.
Figure 4.6 Location and view of Valiyakavala, Vaikom
4.2.5 Other site data used
Other than the site data collected, data from few other sites was used for the purpose of model development and validation. There was requirements for more data for developing a model based on empirical method. The additional sites thus considered are given below
18 (i) Ramnagar Square, Nagpur
(ii) Chacka Junction, Trivandrum
(iii) Master Canteen Square, Bhubaneswar (iv) Salt lake, Kolkata
(v) Panposh Chowk, Rourkela
4.3 Data Collection
Data collection comprised of collecting the traffic data at the study area, which is required to analyse the roundabouts in that areas. For the purpose of analysis, the traffic data was collected at each site during peak hours. The data was collected in form of video recordings of the traffic flow for 2 hours during the peak period.
The flow of traffic in each leg was collected using video camera placed in such a position so as to prove convenient to collect the data. Tripods were used to place the camera is perfect position to record the data in clear way. Generally, for the sake of clear view of all the approaches at the roundabout, the cameras are set at an elevated position, like on a top of high rise building. In case where such facility is not available, the data is collected from at site level only.
The data is collected during the respective peak hours at site, like in Rourkela peak hour occurs during office timings of people working in industry. Generally, the peak hour in morning time occurs from 7- 11 A.M. The data in majority of sites was collected during this duration only. At few sites peak hour was observed during the evening time, like Ramnagar Square (Nagpur) and Salt Lake (Kolkata). For these sites, the data was collected during evening peak hours.
The camera recorded the video continuously for two hours, which made it easy for the data to be extracted in continuity. The video thus recorded provides the data of number of lanes of the
19
roundabout, their direction, entry flow through each lane, circulating flow for each lane and also the exit flow. It also provides the data about the type of traffic and predominant mode of transport in that area.
For the purpose of analysis of the models, not only the traffic data but also the geometrics of the roundabout are equally important. The geometric features like diameter of central island, length and width of weaving sections, width of lane are also requires for the analysis of roundabout. These dimensions were measured using a measuring type during off peak hour, while hindrance due to traffic is less. The measured data from the site was also verified with the measurements given in Google earth to avoid manual error and error due to approximation.
20
5. RESULTS AND ANALYSIS
5.1 Data Extraction
At the end of data collection there were five roundabout’s video comprising of traffic flow during respective peak hours for 2 to 3 hrs. The video was then analysed to extract required traffic data. Each entry has been considered separately and the entry flow was calculated at each 1-minute interval. The number of heavy vehicles, light motor vehicles, two-wheelers, bicycles an animal drawn vehicles entering the roundabout were counted separately and added up to give the total number of vehicles entering through that lane. The procedure was repeated for each lane.
The number of vehicles of each type i.e., heavy vehicles, light motor vehicles, two-wheelers, bicycles and animal drawn vehicles were multiplied by their conversion factor(Passenger car equivalent), as specified in IRC 65-1976, to obtain the value of traffic in PCU(Passenger Car Unit). The value when added up gives the total traffic in terms of PCU for each lane of roundabout. The conversion factors for various types of vehicles are as follows:
i Cars and other light motor vehicles(including 3 wheelers) 1.0 ii Buses and medium and heavy commercial vehicles 2.8 iii Motorcycles and scooters(2 wheelers) 0.75 iv Pedal cycles 0.5
v Animal drawn vehicles 4 to 6
The entry and circulating flow data for a complete one hour with number of vehicles under each category is as in in Table 5.1.
21
Table 5.1: Details of Traffic Volume at Medical Square, Nagpur
After the flow data was finalized the geometric parameters which are to be considered had been summarized. The details of geometrics were obtained by measurement on site and few were obtained by importing maps of the site into AutoCAD. Overall eight geometrics including entry radius (ER), entry angle (φ), mean flare length (l), approach width (AW), entry width (EW), central island diameter (D), weaving width (WW) and weaving length (WL) has been measured and calculated for every approach.
a. Details of Entry Traffic Volume
Leg Direction Heavy Vehicle Light Motor Vehicle Motor Cycle Bicycle Animal Drawn Total Vehicle s Traffic Volume ( PCU/h ) N 10 201 1076 186 22 1495 1239 NE 20 326 715 148 28 1237 1132 SE 14 264 1948 425 26 2677 2107 S 23 338 2508 275 21 3165 2526 SW 8 403 4071 486 16 5045 3802 NW 11 376 2145 239 25 2796 2262
b. Details of Circulating Traffic Volume
N 13 432 3083 205 19 3752 2978 NE 9 329 2967 194 21 3520 2781 SE 15 297 2546 368 14 3240 2503 S 8 192 1593 186 17 1996 1587 SW 22 301 1974 391 11 2699 2094 NW 16 215 2168 258 23 2680 2130
22
5.2 Analysis of Data
5.2.1 Relationship between entry and circulating flow
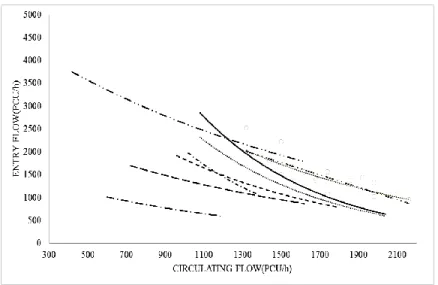
The first step to develop a model was to determine the relationship between entry and the circulating flow for minute wise data. The relationship between entry and circulating flow for the four lanes of Vaikom are shown in Figure 5.1. Such regression was carried out for twenty entries of different roundabouts working at capacity during peak hour. The regression was performed for ever lane so as to obtain best fit for the data and even have a better regression value (R square value).
Table 5.2: Details of Geometric elements of Medical Square
Site Leg ER (m) AW (m) EW (m) D (m) WW (m) WL (m) Φ (°) L (m) Medical square W 23.63 8.94 10.90 42.98 18.83 37.73 44 1.29 NE 27.51 10.38 21.58 42.82 28.65 36.77 49 1.54 E 10.24 8.46 13.62 43.2 22.63 30.89 59 1.65
Figure 5.1 Relationship between entry and circulating flow for SW entry of Valiyakavala Junction
23
Figure 5.2 Relationship between entry and circulating flow for 10 entries
5.2.2 Relationship between entry flow and various geometric elements
For the purpose of determining this relationship, it was essential to bring both the entry flow and the geometrics into linear form. To do this, the logarithm of the values of entry flow were calculated. This provided linearity between the two variables and it was easy to determine the relationship between them. The variation of each geometric with the logarithm value of entry flow was determined individually and the same was preferred for the development of complete model based on all geometrics along with circulating flow taken together.
Table 5.3 Significance values for regression for various geometrics
Geometric Parameter ANOVA Significance F t Stat P-value
Entry radius 9.12E-11 20.73969 2.4E-11
24
The entry radius, diameter and weaving length showed logarithmic variation with logarithm of entry flow, while entry width and the weaving width showed linear relationship. The entry angle and flaring didn’t show significant relationship in Indian context and hence where neglected for development of model. Thus, finally five geometrics were finalized for the model.
5.3 Model Development
The entry and circulating flow data relationship as shown above had been obtained for 20 lanes. The regression parameters obtained by these lanes for used for further analysis. The regression was carried out with geometric variables and entry flow as discussed earlier to know the variation of entry capacity with each variable. Finally taking into consideration the geometric variables and circulating flow, an equation was developed using multiple regression analysis. The regression value of 0.706 was obtained and the parameters were also found to be significant even when considered all together.
The equation obtained for capacity by this method is as follows:
Where, 𝑞𝑒 = Entry capacity (PCU/h)
ER= entry radius (m)
D = diameter of central island (m)
WL = weaving length (m)
EW = entry width (m)
25 qc = circulating flow(PCU/h)
5.4 Validation of Model
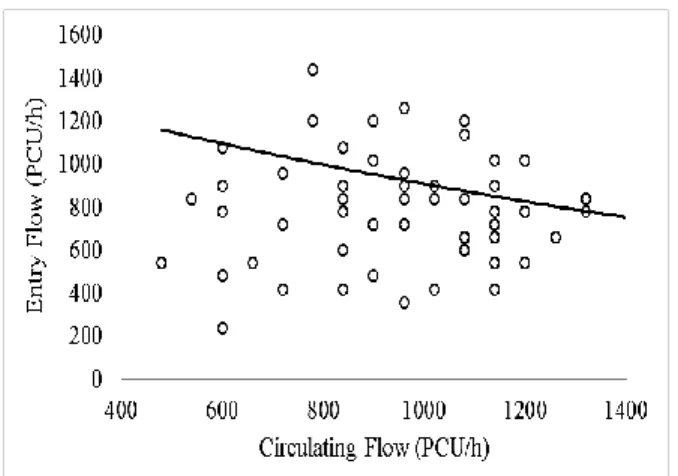
It was the prime requirement for the model so developed, to prove its validity for the Indian traffic scenario. For this cause, the method discussed by Wei and Grenard (2012) has been used. Hence, to validate the model, initially the scatter plot for entry and circulating flows was plotted and then using the developed equation, the entry capacity was estimated for the range of circulating flows and the results are observed.
The graphs obtained for validation for south entry of Panposh Chowk are shown below in Figure 5.8.
Figure 5.8 Validation results for Panposh Chowk, Rourkela
Considering the south entry (Figure 5.8), the model seemed to overestimate the capacity for very low circulating flow. But number of times the circulating flow is so low are very few. Hence, the equation can be stated as serving well even for low circulating flow traffic. For the high circulating flow, the derived equation showed to satisfy traffic flow conditions in south
26
and west lanes, but underestimate a bit for east lane. The adjustment is to be done when considering very low circulating flow and high circulating flows.
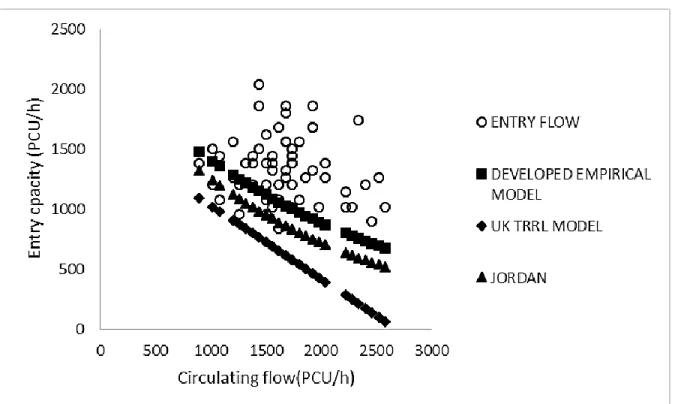
5.5 Comparison of Developed Model with Existing Models
The results obtained from the developed empirical equation has been compared with the existing empirical models used in different parts of world. For this purpose, UK TRRL method, French model and Jordan capacity model has been initially considered. But, the French model laid special emphasis on the width of splitter island. But from the data collected, very few sites had considerable splitter island width. Hence, this model was discarded for comparison and the developed model was finally compared with two models. The graphs showing the comparison of models for three lanes of Ramnagar Square, Nagpur is shown in Figure 5.9.
27
It can be observed from the graph that the UK TRRL model and the Jordan model underestimated the capacity of a roundabout as compared to Indian model for all conditions of circulating flow. While the Indian model provided good fit for the site conditions.
5.6 Change in Entry Capacity per Change in Geometric Variable
The entry capacity as stated earlier depends on five geometric components of roundabout, i.e. entry radius, central island diameter, entry width, weaving width and weaving length. Every geometric element had a significant effect on the entry capacity. A study has been hence conducted to study the variation in entry capacity per increase or decrease in individual geometrics.
5.6.1 Variation in entry radius
Entry radius was found to vary in powers with the entry capacity. The entry capacity became negligible for the values of entry radius above 40m. The entry capacity showed extensive increase about 40 percent. This shows that entry radius affects intensively the entry capacity of roundabout.
5.6.2 Variation in central island diameter
Similar to entry radius, the central island diameter also had relationship in some powers with the entry capacity. So, the change in entry capacity for 5m increase in central island diameter was calculated for variation in diameter from 13m to 40m.
28
5.6.3 Variation in entry width and weaving width
Entry width varied exponentially with the entry capacity. Hence even small variation in entry width, changes the entr capacity of the roundabout. Entry radius and weaing width were varied from 6m to 20m with difference of 5m.
5.6.4 Variation in weaving length
Weaving length varied in power form with the entry capacity as discussed in developed equation. The entry capacity was found to vary between 5 to 10 percent for 10m increase in weaving length.
5.7 Determination of Level of Service using K-means Clustering
For measuring performance of a roundabout, it was essential to evaluate its level of service (LOS). The ratio of mean entry flow to entry capacity was taken as a predictor for grouping the LOS. For the q/c ratio more than one, the LOS category was considered as F for ranges of A to F. The ranges A to F shows the decrease in level of service of roundabouts. A acne be considered as providing excellent level of service, B as good, C as satisfactory, D as average, E as poor and F as very poor. The categorical results obtained by this clustering is shown in Figure 5.14 and the results are summarized in Table 5.5. The Silhouette value of 0.7355 was obtained, which proves the efficiency of model.
Table 5.5: LOS for different q/c ratio obtained from K-means clustering
q/c Ratio 0-0.45 0.45- 0.63 0.63-0.76 0.76-0.89 0.89-1.00 >1.00
29
6. SUMMARY AND CONCLUSION
6.1 Summary
Unlike the traffic in other countries, the traffic in India has been found to be heterogeneous and had great variation in its content from place to place. The amalgam of vehicles consisted varying number of two-wheelers, cars, heavy vehicles, bicycles and animal drawn vehicles. The study showed the increase in roundabouts number over the past few years. The method used to estimate the capacity of roundabout was very primitive, thus a new model defining the capacity of roundabouts was to be developed.
The data has been collected during the respective peak hours of the site. The data comprised of entry and circulating flow and the geometric variables. The required values of entry and circulating flow for one minute interval were extracted. The plot between entry and circulating flow depicted exponential relationship for the data so extracted. Regarding the various geometric variables, diameter of central island, entry radius, entry width, weaving width and the weaving length were found to have significant impact on capacity. These geometrics when plotted against the logarithm value of entry flow, showed linear relationship in case of entry and weaving width both. Whereas, the rest of the geometrics showed logarithmic variations. The model for entry capacity was then developed using these geometric parameters and circulating flow.
6.2 Conclusions
A study has been conducted to determine the factors affecting the performance of the roundabouts in Indian mid-sized cities. An empirical model was final developed for capacity of
30
roundabouts with the geometric parameters as explanatory variables. The facts that could be concluded from the study are:
1. The relationship between the entry and the circulating flow was found to be exponential for the best fit.
2. The UK TRRL model was found to underestimate the capacity of roundabout in mostly all the sites used for validation. The model developed for Jordan roundabouts also gave capacity values lesser than the one predicted by the developed model, but were found to fit better than the UK model.
3. The study on LOS based on k-means cluster analysis showed that the level of service of the roundabouts taken in consideration varied from B to D for most of the cases. These concluded that the performance of roundabouts considered were good and average in nature. Some improvements in terms of geometry could lead to much better performance.
6.2 Future Scope of Study
The data collected for the empirical analysis was from five different sites and five more were used for validation. When compared with other existing empirical models, the size of the data used for model development was smaller, hence more data can be used to obtain more accurate relationship. On the other hand, the model only takes into consideration the geometry as explanatory variable for capacity, whereas the driver behaviour characteristics also decide the capacity. Thus a revised model could be developed using gap acceptance concept along with the geometric elements to develop a robust model for Indian scenario.
The study was conducted only for the unsignalized roundabout intersections, thus a study could be done for the capacity evaluation for the signalized roundabouts for various cities in India. Along
31
with it, the parameters like pedestrian behaviour and sidewalks could be studied along with it. The effect of nearby roundabouts or intersections on the capacity of the roundabout could be studied based on difference in traffic composition and distance of nearby intersection from the roundabout. The model developed evaluated the capacity of roundabout for individual approach only. Thus, another area of study could be to develop a model to compute total capacity of roundabouts based on OD study. The validation using many existing software can also be done in this case.
REFERENCES
Akcelik, R (2011), “Evaluating Roundabout Capacity, Level of Service and Performance”, Akçelik, R (2011), “A Roundabout Case Study Comparing Capacity: Estimates from Alternative Analytical Model”, 2nd Urban Street Symposium, Anaheim, California, pp.1-20. Al-Madani, H.M.N (2013), “Capacity of Large Dual and Triple-Lanes Roundabouts during Heavy Demand Conditions”, Springer Journal, Arab J Sci Eng. (2013) 38, pp. 491–505.
Al-Masaeid, H.R., M.Z. Faddah (1997), “Capacity of Roundabouts in Jordan”, Transportation Research Record 1572, pp. 76-85.
Al-Omari1, B H, H. R. Al-Masaeid; and Y. S. Al-Shawabkah (2004), “Development of a Delay Model for Roundabouts in Jordan”, Journal of Transportation Engineering, Vol. 130, No. 1, January 1, 2004, pp. 76-82.
ARR 321, Roundabouts: Capacity and Performance Analysis, ARRB Transport Research, 1998.
Bie, J, H K. Lo and S. C. Wong (2006), “Capacity of Multi-Lane Roundabout: Methodology Based on Lane Utilization”, American Society of Civil Engineers, pp.590-595.
De Leeuw, M.A., H Botma, P. H. L. Bovy (1999), “Capacity of Single-Lane Roundabouts with Slow Traffic”, Transportation Research Record 1678, pp. 55-63.
Dixit, V V(2012), “.Modeling Origin-Destination Effects on Roundabout Operations and Inflow Control”, Journal of Transportation Engineering, Vol. 138, No. 8, August 1, 2012, pp. 1016-1022.
Hammond.S (2014), “The Effect of Additional Lane Length on Roundabout Delay”, University of Rhode Island, Open Access Dissertations. Paper 230.
IRC 65: Recommended Practice for Traffic Rotaries, 1976, Indian Road Congress.
Kimber, R. (1980), “The Traffic Capacity of Roundabouts”, Laboratory Report 942, U.K. Transport and Road Research Laboratory, Crowthorne,Berkshire, England, 1980.
Leemann. N, G. Santel (2009), “Two-Lane Roundabouts”, 9th Swiss Transport Research Conference, September9. -11.
Lenters, M and C. Rudy (2010), “HCM Roundabout Capacity Methods and Alternative Capacity Models”,
Lindenmann, H.P. (2006) “Capacity of Small Roundabouts with Two-Lane Entries”, Transportation Research Record: Journal of the Transportation Research Board, No. 1988, 2006, pp. 119–126.
Lochrane, T W P, N Kronprasert, J Bared, D J. Dailey and Zhang(2014), “Determination of Mini-Roundabout Capacity in the United States”, Journal of Transportation Engineering, pp.1-8.
Mauro. R (2010), “Calculation of Roundabouts: Capacity, Waiting Phenomenon and Reliability”.
Mazzella, A, C. Piras, and F. Pinna (2011), “Use of Kriging Technique to Study Roundabout Performance”, Transportation Research Record: Journal of the Transportation Research Board, No. 2241, Transportation Research Board of the National Academies, Washington, D.C., 2011, pp. 78–86.
Md Diah, J, Mohd Y A. Rahman, M A. Adnan and Z Yahya (2011), “Relationship between Roadway Design (Geometric Parameters) and Flow Characteristics in Evaluating Performance of Conventional Roundabout”, IEEE 7th International Colloquium on Signal Processing and its Applications, pp.485-488.
Md Diah, J, Mohd Y A. Rahman, M A. Adnan, and K. Hooi Ling(2011), “Modeling the Relationship between Geometric Design and Weaving Section Flow Process of Conventional Roundabouts”, Journal of Transportation Engineering, Vol. 137, No. 12, December 1, 2011.
National Association of Australian State Road Authorities (NAASRA). Roundabouts – A guide to application and design. NAASRA, Sydney, Australia, 1982.
NCHRP Synthesis 264: Modern Roundabout Practice in the United States, Transportation Research Board, 1998.
NCHRP Web-only Document 94: Appendixes to NCHRP 572: Roundabout in United States,
Transportation Research Board, 2006.
NCHRP 672: Roundabouts: An informational Guide, Second Edition, Transportation Research Board, 2010.
Pei, Y, C Fu and T Peng (2011), “Theory Model for Traffic Capacity of Unsignalized Roundabout in Urban Road”, American Society of Civil Engineers, pp. 770-775.
Polus, A and S Shmueli (2011), “Analysis and Evaluation of the Capacity of Roundabouts”, Transportation Research Board, No. 1572, pp.99-105.
Robinson, B. W., L. Rodegerdts, W. Scarbrough, W. Kittelson, R. Troutbeck, W. Brilon, L. Bondzio, K. Courage, M. Kyte, J. Mason, A. Flannery, E. Myers, J. Bunker, and G.
Jacquemart. Roundabouts: An Informational Guide. Report FHWA-RD-00-067. FHWA, U. S. Department of Transportation, June 2000.
Robinson, B. W and L. A. Rodegerdts (2000), “Capacity and Performance of Roundabouts: A Summary of Recommendations in the FHWA Roundabout Guide”, Transportation Research Circular E-C018: 4th International Symposium on Highway Capacity, pp. 422-433.
Wei, T, J L. Grenard, and H R. Shah (2011), “Developing Capacity Models for Local Roundabouts -Streamlined Process”, Transportation Research Record: Journal of the Transportation Research Board, No. 2257, Transportation Research Board of the National Academies, Washington, D.C., 2011, pp. 1–9.
Wei, T, J L. Grenard (2012), “Calibration and Validation of Highway Capacity Manual 2010 Capacity Model for Single-Lane Roundabouts”, Transportation Research Record: Journal of the Transportation Research Board, No. 2286, Transportation Research Board of the National Academies, Washington, D.C., 2012, pp. 105–110