Free/Libre and Open Source Software:
Policy Support
FLOSSPOLS
Deliverable D3 (cover page)
Results and policy paper from survey of government authorities
Maastricht, August 25, 2005MERIT, University of Maastricht
Contacts: Rishab Ghosh ([email protected]) Ruediger Glott ([email protected])
Document Version: Post-review Revision Due date: September 1, 2005
Submission date: September 1, 2005 Document history:
Due date: February 1, 2005 (Month 11)
Final version submission date: March 31, 2005 (Month 13) Project Officer: Tiziana Arcarese, DG INFSO, European Commission Contract number: FP6-IST- 507524
Contract start date: March 1, 2004. End date: February 28, 2006.
Free/Libre and Open Source Software: Policy Support
FLOSSPOLS Deliverable D3: Results from the local governments survey Executive Summary
A major component of the FLOSSPOLS project is the understanding of attitudes towards and usage of Free/Libre/Open Source Software (FLOSS) in the public sector in Europe, and local (including regional) government authorities in particular. To this end, a comprehensive survey has been conducted, using telephone first contacts, telephone reminders, and a questionnaire by telephone, fax or (accounting for the vast majority of responses) web-based forms. The survey has been conducted in Austria, Belgium, Czech Republic, Denmark, France, Germany, Greece, Italy, Netherlands, Poland, Spain, Sweden, and the UK, in 10 local languages. Personalised questionnaires were provided to 4138 organisations from the ELGO database and augmented by an “open”
questionnaire in some countries leading to a total of 955 valid responses.
Due to differences in the structure of responses in different countries, the survey is not
representative at the country level, so differences between countries should be seen as applying to the respondents, not to the countries in general. Thus, most of the analysis has focussed on overall findings on government attitudes and usage, rather than country differences. The highlights of the survey findings are as follows:
• Roughly half (49%) of local government authorities report some intentional use of FLOSS. However, a large additional population (29%) reports using FLOSS software, such as GNU/Linux, MySQL or Apache, but are unaware that these are FLOSS.
• Within organisations, partial use on servers dominates (40%) followed by partial use on desktops (16%). 20% experiment in pilot projects. Complete use is very rare, whether on desktop or server. • Demand exists: 70% of FLOSS users and 38% of non-users want to increase FLOSS use.
Awareness of FLOSS leads to increased willingness to use it regardless of current use/non-use. • More than a fifth of those wanting to increase FLOSS use want a complete migration to FLOSS. • Perceived advantages of FLOSS include: customisation and the ability to combine it with existing
proprietary systems. Barriers perceived by non-users include cost of training and being the first among peer organisations to adopt FLOSS. The experience of current users leads them not to see such barriers, and to appreciate the advantages more strongly than non-users.
• Organisations valuing interoperability are much more likely to increase FLOSS use. • For non-users, who are more likely to use external maintenance services, a sense of vendor
dependency and the need to customise software are strong drivers to future FLOSS use. • Small budgets lead to “unaware” FLOSS use rather than intentional use or non-use of FLOSS. • Licence fees account for 20% of IT budgets. Half of all respondents find this too high. This
perception leads to increased future FLOSS use, especially among current non-users.
• FLOSS users administer 35% more PCs per IT administrator than non-users – FLOSS use appears to reduce administrator workload per PC, and IT departments with high workloads are more likely to want a future increase in FLOSS use.
The report concludes that increasing awareness, highlighting best practice case studies and encourage experimentation in pilot projects would increase and deepen FLOSS use in future.
(signed, March 31, 2005)
Rishab Aiyer Ghosh, FLOSSPOLS project coordinator ([email protected]) MERIT, University of Maastricht
Free/Libre and Open Source Software:
Policy Support
FLOSSPOLS
Usage of and Attitudes towards Free / Libre and Open Source
Software in European Governments
Results from the Governments Survey
Rüdiger Glott & Rishab A. Ghosh
Maastricht, March 2005
This report is a deliverable of the FLOSSPOLS project, funded under the Sixth Framework Programme of the European Union, managed by the eGovernment Unit of the European Commission's DG Information Society.
Contents
Contents
1 Acknowledgements...5
2 Free/Libre/Open Source Software for governments...6
3 Research questions and hypotheses... 9
4 Methodology, Coverage, and Response...11
4.1 Methodology...11
4.2 Contacts and Responses... 13
5 Findings...15
5.1 Usage of FLOSS...15
5.2 Driving forces and barriers ...21
5.3 Organisational context of FLOSS ... 27
5.4 Variations of the use of FLOSS in European countries... 46
6 Conclusions...63
7 References...69
8 Annex 1: Questionnaire (English)... 71
1 Acknowledgements
The FLOSSPOLS survey on governments would not have been able to cover so many European countries in a relatively short period of time if there were no organisations that have supported this survey. Therefore the authors wish to thank following persons and institutions for their help to announce the survey and to distribute the questionnaire among their members:
• Javier Ossandon from the European Local Authorities Network Initiative (ELANET) • Francesco Laera & Maeva Zebrovski from TeleCities / EuroCities
• Ronald Sallman from Public Management Marketing Wien and Österreichischer Städtebund (Austria)
• Eva Maurová from SMO CR (Czech Republic) • Flavia Marzano from UIP / CRC (Italy)
• Bart Knubben & Mark Bressers from Programma OSOSS (the Netherlands) • Wojtek Sadowicz from PIDG / EMCOM (Poland)
• Jesus Turbidi from FEMP (Spain)
For the provision of the ELGO database and for his personal advice we would like to thank Robin Page from Newmedia Publishing.
The authors wish also to thank the numerous IT managers who have answered the questionnaire. The workload that is usual for IT managers together with the fact that IT managers are very often subject to surveys like the FLOSSPOLS survey usually account for extremely low response rates of such surveys. In the case of the FLOSSPOLS local governments survey it turned however out that – apart from only few countries - there was a strong interest of IT managers to participate in the survey. We would like to thank Herman Pijpers (MERIT) for the technical administration of the online-survey and the PhD and ESST students at the University of Maastricht for their translations of questionnaires, letters, and emails, for their help during the pre-test interviews, and for their assistance in the preparation of the FLOSSPOLS conference in The Hague in November 2004: Anna-Lena Andersson, Eirini Berikou, David Duijnmayer, Charlotte Epinette, Ekin Keskin, Ewa Krasnodebska, Grzegorz Mazur, Michael Nagler, Ludek Stavinoha, and Bertha Vallejo.
Finally, we would like to thank the European Commission, in particular the eGovernment Unit of the Directorate General for Information Society for acknowledging the project idea and funding the project.
Rishab A. Ghosh Rüdiger Glott
2 Free/Libre/Open Source Software for governments
Within the last 15 years, free / libre and open source software (FLOSS) products have reached a considerable position in the software market. Linux plays an equally strong role as Microsoft in the market for operating systems, and the market for web server software is even dominated by the Apache web server.1 According to Varian & Shapiro (2003, 2) open source software has thus “…
achieved a ‘critical mass’ sufficient to assure users that it will be available and improved for years to come, reducing the risk to users and to software developers of making investments associated with Linux.” Open source software is therefore an increasingly attractive option for IT managers in the private as well as in the public sector. (Varian & Shapiro, 2003, 1; Becker, 2004)
The reasons why open source software became so attractive are manifold. They range from cost-effectiveness (Robert Francis Group, 2002; Winslow 2004; Bayerischer Oberster Gerichtshof, 2001, 63-73)2 and improved flexibility (Varian & Shapiro, 2004, 2, 11) over expiration of maintenance and
support through software vendors, increased technical requirements, increased interoperability, and independence from software vendors (KBSt, 2003: 19) to security aspects (Deutscher Bundestag, 2001) and improved reliability (Wheeler, 2002). The FLOSS user survey (Wichmann, 2003) showed
1 In contrast, with a share of more than 90% Microsoft unmistakably dominates the market for desktop
applications with its Windows suite (Kotadia, 2004).
2 Cost-effectiveness is often first mentioned when the advantages of open source over proprietary software are
discussed, since the purchase of proprietary software is aligned with high licence fees for the software usage, whereas open source software is free or charged with very low prices. However, to measure the costs aligned with software is a complex matter, since they are not only associated with purchasing costs, but also with costs for maintenance, security updates, staff training, and the more. There are different attempts to measure these ‘total costs of ownership’ (TCO), all associated with the problem that there is no single best way to make these costs comparable across different studies and therefore often resulting in contradictory findings. The Robert Francis Group study in 2002 found that over a three years period Linux is 250% cheaper than Microsoft Windows, which is largely confirmed by a similar study of Cybersource (2002). Both these studies have been initiated by IBM, which plays an important role as a commercial player in the field of open source. In contrast, Microsoft sponsored study by BearingPoint in 2004 claims that over a three as well as over a five years period licence and support costs for Windows servers are cheaper than for Red Hat and Novell/SUSE Linux servers. (BearingPoint, 2004) Accordingly, worldwide survey of the Yankee Group in association with Windows Tools Provider Sunbelt Software claims that a significant or complete switch from Windows to Linux would be three to four times more expensive than a Windows upgrade. (Open Source News, April 2004). Open Ireland, a lobby group that promotes the usage of open source software in Irish government, suspects many studies “to ‘follow the money’, giving the message of the sponsor.” (Quoted from eGovernment News, 11 May 2004) Varian & Shapiro (2003, 12) “suppose that neither of these two platforms has a striking advantage over the other in terms of conventional measures of TCO.” However, the crucial point in these studies is surely not the existence or non-existence of monetary interests of the research companies, but that they associate Linux with costs for services (such as support or staff training) that are not necessarily aligned with it. Winslow points out that instead negotiating support contracts it is one of the best ways to cope with the requirements of a migration towards Linux by participating actively in the open source software community, which provides a large and powerful knowledge-base and support infrastructure for occurring problems and which costs only the time to write an email. (Winslow, 2004)
that corporate IT managers in the private and public sector considered higher stability together with operation and administration costs savings as striking advantages of open source over proprietary software. Yet, as Varian & Shapiro (2003) exemplify with Linux, there are farther-reaching reasons for the public sector to adopt open source software:
“Public sector technology managers have additional reasons to adopt Linux. Adoption of Linux platform software promotes the training of software engineers and provides an open platform on which commercial or open source applications can be built, thereby spurring the development of a robust domestic industry. Certainly, any government information technology manager seeking to put in place a flexible computing environment that also helps promote the domestic software industry should give serious consideration to Linux.” (Varian & Shapiro, 2003, 20)
Thus, the broad adoption of open source software by the public sector is expected to result in increased economic growth and employment.3 Indeed, the great success has been enough for open
source to be considered as a useful alternative for e-government applications. Consequently many governments, on the state level as well as on the regional and local level, started political interventions in order to increase the use of open source software.4 (See Schmitz, 2001; Ghosh et al.,
2002; critical: Bernard and Reddy, 2002) At current, these political initiatives gain significance because they coincide with “the biggest desktop refresh since Y2K”. (Kotadia, 2004) Because maintenance and support contracts for investments that were done in 2000 in order to avoid Y2K problems expire now, the Gartner Group estimates that 220 million corporate desktop PCs will be replaced in 2004 and 2005. (Gartner Group, 2004) Thus, right now we are at crossroads that determine the design of corporate IT systems for the next product lifecycle.
However, several gaps remain in our understanding of the functioning and purposes of open source software. One of these gaps concerns contents and directions of government policies towards open source software. To know which experiences with open source software have been made and which experiences are missing, what kind of open source software is used, and which obstacles may hinder
3 This view gets support from an empirical study on open source usage in Italy (CENSIS, 2004). Weber
(2004) supports this hypothesis while stressing a different aspect. He points out that the democratic principles of open source have a strong potential in other industries than the IT industries, especially in biotechnology and publishing.
4 An overview of such activities is provided by the European Commission’s Open Source Observatory (see
http://europa.eu.int/idabc/oso/) and by Becker (2004). Presumably as a reaction to some local governments that have opted for open source even on the desktop, such as the city of Munich (Shankland, 2003) or the city of Paris (Guillemin & Broersma, 2004), Micrososft has obviously changed its pricing policy and now offers special discounts for municipalities if they keep to Windows, as the example of the city of Newham in the UK indicates. Newham’s IT director claims to save one million pound per year by sticking with Microsoft because of special terms that deviate from the general terms that are negotiated by the UK Office of Government Commerce. (Open Source News, January 2004).
the usage of open source software in government institutions is of crucial importance for any political activity in this field. The FLOSSPOLS Government Survey contributes to the generation of this knowledge and helps thus to better adapt political strategies in the field of open source software to the actual needs and preferences of IT officers in the public sector. Related Europe-wide data include the “Study into the use of Open Source Software in the Public Sector”5 published by the IDA
Programme of DG Enterprise, for which Unisys Belgium conducted a survey, in three languages, in 2001 with 66 respondents from 6 EU countries. The FP5 project “Three Roses” in 2003-2004 conducted a small web-based survey of similar size. Furthermore, the FP6 project COSPA is currently gathering information from public administrations, focussing more on technical aspects of FLOSS use. However, with 955 respondents across 13 EU countries, the FLOSSPOLS survey carried out in 10 languages is by far the largest, most comprehensive in-depth survey on usage of and attitudes towards FLOSS in government authorities to date, worldwide.
3 Research questions and hypotheses
Open source software is not at all unknown in government institutions. Research on the Dutch public sector revealed that experiences with free software and open source software are widely spread: In a 2003 survey a majority of the surveyed organisations in the Netherlands have had experiences with FLOSS. But at the same time these experiences were clearly limited in government institutions, as the lion share of them reported only experiences with Linux, Apache web server, and MySQL, whereas desktop applications like OpenOffice and Internet applications like Mozilla are hard to find. (Glott & Ghosh 2003: 23) This reveals clearly that in government organisations open source software is used rather in the form of isolated applications than throughout the whole IT system, which is in line with the overall structure of the software market. Since desktop and Internet applications are used by office employees and not only by IT experts they are essential for a fundamental increase of the use of open source software in government institutions. (As pointed out in the above section, government institutions play a very significant role for tapping the potentials of open source.)
Therefore, the current level of open source software usage and the plans with regard to the future advancement of local governments’ IT systems provide a main topic of the survey. Our hypothesis on that point is that it is rather unlikely that European local governments will migrate completely towards open source software in future. Rather, they will aim at a combination of proprietary and open source software.6 The technological trend develops also in this direction, as the interoperability
of many open source software systems allows using them in a proprietary software environment, and as for many open source software applications (such as OpenOffice) exist special versions that run under Microsoft Windows.
Similarly to our findings from the study of the public sector in the Netherlands we expect the attractiveness of open source to grow with increasing degrees of practical experiences of local governments with open source software. In this context we assume to find significant differences between European countries, as the development of the information society varies considerably between different regions of the EU.
Attitudes towards open source and proprietary software provide another important issue of the survey in order to identify factors that support or hinder the advancement of open source software usage in European local governments. A presumed lack of technical support and high costs for training
provide severe obstacles to decide in favour of open source software. Especially those chief IT officers who have no experiences with open source software turned out to be extremely reluctant to an increase of the share of open source software in their organisation within the next two years, whereas almost three fifths of the chief IT officers who had experiences with open source software stated that they would find such an increase useful. (Ghosh & Glott 2003: 22) As instructive as these findings however might be, they describe the situation only for one country and cannot be generalised for other European countries. In order to improve the benefits of open source software for public administrations a Europe-wide strategy has to take into account dissimilarities and asynchronicities.
4 Methodology, Coverage, and Response
4.1 Methodology
According to the survey methodology and work plan as described in FLOSSPOLS deliverable No. 1 the creation of the questionnaire was completed in April 2004 and pre-test interviews, which were carried out by phone or face-to-face, were conducted in May and June 2004. Overall 50 such pre-test interviews have been done in four different countries (Germany, Greece, Poland, Spain, and the UK) and evaluated with regard to the functionality of the questionnaire. Responses to the pre-tests that corresponded to the final version of the questionnaire have been included in the final sample. The final version of the questionnaire is attached to this document (see appendix 1).
The main survey was carried out as an online survey in two different forms, a "personalised" and an "open" survey. For the personalised survey IT managers in European municipalities were contacted directly by email and provided with a link to the online questionnaire.7 The examination of different
sources of contact information for public administrations, such as directories, almanacs of public authorities and websites of municipal and regional organisations, such as urbanicity.org8 showed that
building a contact list from these source would be too complex, time-consuming, and expensive. Talks with experts from government organisations, other researchers as well as our consortium member Eurocities/Telecities recommended the ELGO (European Local Governments) database, which covers over 14,000 local and regional authorities in 27 European countries. It provides information on municipal administrative units with at least 5.000 inhabitants.9 Where personal
information on the IT manager was not available, the mayors' offices have been contacted. Contacts were in several cases made by phone in order to find the right respondent, remind them to fill out the on-line questionnaire, or (in some cases) to record the responses. For the open survey, support from
7 The respondents' privacy was protected by the fact that each recipient oof such an email found a
"personalised" link to the online questionnaire, so that access of third parties to the information given by a certain respondent was impossible. Each repondent filled out his or her personal questionnaire and had no access to the answers of other respondents.
8See http://www.urbanicity.org/
9 For more details on the elgo database see: http://www.elgo.co.uk/. ELGO is a unique database providing
information that is not provided by any other organisation, such as statistical offices, municipal organisations or other government institutions. It is also used by private companies for their activities in the public sector.
TeleCities10 and ELANET11, the European Local Authorities Network Initiative, has been used. Both
organisations asked their members in the surveyed countries to support the survey by announcing it to the municipal administrations and distributing the questionnaire among their members. Such support has been provided by Austria (Österreichischer Städtebund), Czech Republic (SMO CR), Italy (UIP / CRC), the Netherlands (OSOSS Programma, Ministry of the Interior, Ministry of Economic Affairs), Poland (PIDG / EMCOM), Spain (FEMP).
Overall, the FLOSSPOLS local governments survey covered 13 European countries: Austria Belgium Czech Republic Denmark France Germany Greece Italy Netherlands Poland Spain Sweden UK
Questionnaires and all communications, including phone calls, were in local languages for all countries except Denmark, i.e.: Czech, Dutch, English, French, German, Greek, Italian, Polish, Spanish, Swedish. The English version of the questionnaire was the original, the other nine languages were translations by native speakers, with phone calls by native speakers.
Representatives of Hungarian municipal organisations who attended a presentation of preliminary results of the FLOSSPOLS project on November 18, 2004, in Den Haag, decided to carry out such a survey in Hungary, too, by using the FLOSSPOLS questionnaire and methodology. The FLOSSPOLS local governments survey in Hungary is not completed and was not initiated by the FLOSSPOLS project but an early outcome of the dissemination activities of the FLOSSPOLS project.12
10 TeleCities, part of EuroCities is the major European network of cities committed to leadership in the
Information and Knowledge Society, and is a partner in the FLOSSPOLS project. See: http://www.telecities.org/aboutTC/index.htm
11 See http://www.eetaa.gr/ELANET/
A hindrance towards the FLOSSPOLS public administration survey and the requested support by national municipal organisations was the fact that IT administrators in public authorities are overwhelmed by commercial surveys and that municipal organisations, especially in the UK, had a stronger interest in protecting their members from surveys than supporting actively the FLOSSPOLS project. Some municipal organisations, including those not supporting the distribution of the FLOSSPOLS questionnaire, offered to provide data on open source usage in their country's municipalities to be compared to the FLOSSPOLS results. Thus the overall support by municipal organisations for the FLOSSPOLS project has been (and still is) significant.
4.2 Contacts and Responses
By March 10, 2005, 4138 IT administrators in public authorities across 13 EU member states13 have
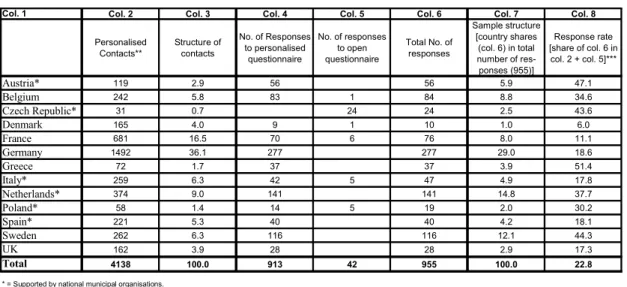
been contacted for the FLOSSPOLS public administration survey (see table 1).
Table 1: Contacts and Responses
Due to the limitations of the ELGO data there are strong differences by country with regard to the number of people who could be contacted (see col. 2 of table 1). There is a strong dominance of German addressees, whereas the number of contacts in Poland and Greece was relatively low. These differences result from the fact that the ELGO data base contains many more records for North and
13 Excluding Hungary, where no-one has been contacted directly by the FLOSSPOLS project team.
Col. 1 Col. 2 Col. 3 Col. 4 Col. 5 Col. 6 Col. 7 Col. 8
Personalised Contacts** Structure of contacts No. of Responses to personalised questionnaire No. of responses to open questionnaire Total No. of responses Sample structure [country shares (col. 6) in total number of res-ponses (955)] Response rate [share of col. 6 in col. 2 + col. 5]*** Austria* 119 2.9 56 56 5.9 47.1 Belgium 242 5.8 83 1 84 8.8 34.6 Czech Republic* 31 0.7 24 24 2.5 43.6 Denmark 165 4.0 9 1 10 1.0 6.0 France 681 16.5 70 6 76 8.0 11.1 Germany 1492 36.1 277 277 29.0 18.6 Greece 72 1.7 37 37 3.9 51.4 Italy* 259 6.3 42 5 47 4.9 17.8 Netherlands* 374 9.0 141 141 14.8 37.7 Poland* 58 1.4 14 5 19 2.0 30.2 Spain* 221 5.3 40 40 4.2 18.1 Sweden 262 6.3 116 116 12.1 44.3 UK 162 3.9 28 28 2.9 17.3 Total 4138 100.0 913 42 955 100.0 22.8
* = Supported by national municipal organisations.
** = Based on elgo data, only records with email addresses were selected.
West European countries than for South and East European countries. In addition, almost all German records contained an email address, while for instance French and Italian records showed a large proportion of records with no email address. While telephone calls to database contacts were made by the FLOSSPOLS team to gather e-mail addresses, this was limited by resources available to the project.
The country surveys did not start all at the same time, but in a sequential manner. 955 persons have responded to the survey by March 10, 2005, which corresponds to a response rate of roughly 23 percent.14 The response rate shows strong country-related differences, whereby it is evident that the
irregularities regarding the structure of contacts are to a certain degree reproduced with regard to the response rate (col. 8) and the sample structure (col. 7). The sample structure largely reproduces these differences, as Germany, France, the Netherlands, and Sweden provide the large shares in the number of contacts as well as in the number of respondents.
Austria, Denmark, Greece, and Spain provide significant exceptions to this observation, indicating that the structure of the respondents is not at all a linear function of these irregularities in the sampling. Obviously there are also country specific patterns that determine the willingness to participate in such surveys. For instance, the response from Denmark is considerably low, whereas the response from Sweden is quite high, although both countries were surveyed at the same time. (Language could be one explanation for this, as the questionnaire was translated into Swedish, but not into Danish; contacts in Denmark were made in English).
Another factor that plays a significant role for explaining country-specific differences in the response is support from national municipal organisations. All countries where national support from municipal organisations was provided show a higher response rate (column 8) than the countries' respective shares in the sample of overall contacted authorities (column 3). This applies especially to Austria, the Netherlands, and the Czech Republic. In the Netherlands, in particular, the responses are rather high and are also, we believe, least susceptible to self-selection bias. This is due to the strong
14 Since the number of persons who got knowledge of the FLOSSPOLS local governments survey by the
activities of the national organisations that supported the project cannot be quantified, the response rate can only be estimated. For this purpose the number of respondents to the open questionnaire was added to the number of contacts in total. Thus, the estimated response rate is calculated as follows:
response rate = total number of responses / (number of personalised contacts + number of respondents to open questionnaire) x 100.
With regard to the columns in table 1 this formula can also be read as: col.8 = col.6 / (col.2 + col.5) x 100.
support given by the Dutch Ministries of Economic Affairs and Internal Affairs and the government's OSOSS Programme. In cooperation with the OSOSS Programme, the FLOSSPOLS team conducted a more extensive survey of all Dutch government authorities with an extended questionnaire designed to be compatible with the Dutch 2003 survey as well as the FLOSSPOLS survey in other countries. (However, only the Dutch local authorities from this survey have been included within the FLOSSPOLS results in this report). Though the same observation can be made in some countries that did not provide such support for the FLOSSPOLS survey, such as Belgium, Greece, Sweden, and the UK, it must be noted that the response from Denmark, France, and Germany remained clearly below these countries' respective shares in the number of contacted authorities and also below the average response rate of 23%.
5 Findings
5.1 Usage of FLOSS
The usage of FLOSS in European local governments is already a quite usual phenomenon, as roughly half (49%) of the participants in the FLOSSPOLS local governments survey say that they use FLOSS programs in their organisation. 47% say they do not use FLOSS at all and another 4% say they do not know whether they use FLOSS.
Since the FLOSSPOLS local governments survey addresses the issue of open source software usage, users of open source software might have been more willing to participate in the FLOSSPOLS local government survey than non-users. In order to estimate whether such a self-selection of the sample might have biased our results we contacted 2942 non-respondents after the final closure of the survey, and asked them why they didn't fill in the questionnaire. Based on our experiences from the pre-test interviews and preliminary contacts, which were done by phone or in person, the respondents were offered to choose one or more from four responses:
• they were too busy;
• they had a general policy not to participate in surveys;
• they were non-users of FLOSS and therefore not interested in participating in the survey; or • they had other reasons not to participate.
Table 2 illustrates that for 36% of the respondents non-usage and being too busy were the main reasons why they did not respond to the FLOSSPOLS survey, while policy and other reasons were mentioned by roughly 25%.
Table 2: Reasons not to participate in the FLOSSPOLS local governments survey
If there was a self-selection of FLOSS users in the sample the share of non-respondents who gave non-use of FLOSS as their reason for not responding should exceed the non-user share of 47% among the survey respondents. The share of only 36% reported non-use as a reason for non-response indicates that on the aggregate level there was no self-selection of FLOSS users. However, as we will see in a later section of this report, there are differences in the data at the country level, showing differing levels of self selection biases for some countries. This limited the scope of country comparisons that can be carried out with the FLOSSPOLS data.
It appears noteworthy that even to IT managers it is not always clear whether a program is free software / open source software or not. Moreover, in an online survey based on a standardised questionnaire it is not always clear to the respondent whether the question "Do you use open source software
systems in your organisation?" (see question 1 in the questionnaire in appendix 1) refers to all kinds of usage or
only to regular usage of FLOSS programs in everyday work. Therefore the questionnaire contained a number of additional questions in order to examine in more detail the degree of FLOSS usage in European local governments. The respondents were thus also asked to check from a list of FLOSS programs and from a list of operating systems, reporting what they use. In addition the respondents were asked to which degree they use FLOSS on the server and on the PC, whereby they could choose between (almost) complete or only partial use of FLOSS on the servers / PCs and could also indicate that they are only experimenting with FLOSS in pilots. If the answers to all these questions are taken into account in order to determine correctly the spread of FLOSS in European local governments the respective percentage increases considerably to 79% of local government authorities show some
Reason Percentage of respondents
I was too busy 36.3
We have a policy not to participate in surveys 23.6
We do not use FLOSS and are therefore not interested in the survey 36.6
Other reason 26.8
use of FLOSS. In the following sections we will therefore distinguish three types of organisations with regard to FLOSS usage: those using FLOSS and being aware of this ("aware usage"), those using FLOSS software (such as Linux or Apache) but reporting that they don't use open source ("unaware usage"), and non-usage.15 Table 3 shows the shares of these three types within the
FLOSSPOLS local government survey.
Table 3: Types of FLOSS usage in European local governments.
Given the high incidence of FLOSS in European local governments, the crucial question is to what degree it is used. As shown in table 4, only a very small proportion of the local governments uses FLOSS as regular systems on their PCs, whereas the usage of FLOSS on servers is quite usual. The proportion of 20% of the local governments experimenting with FLOSS in pilots indicates that local governments' interest in using FLOSS has not already reached its peak, but that there are still many organisations trying to find out whether and how it would be useful for them.
Table 4: Degree of usage of FLOSS in European local governments
15 Though it is theoretically difficult to explain why attitudes towards FLOSS should differ between two groups
that both think they do not use FLOSS, the results of the analyses clearly confirmed that it is useful to distinguish between these groups. Presumably, those who are aware that they use FLOSS and those who are aware that they do not use FLOSS are more careful about the software that runs on their IT systems than those who think they do not use FLOSS but actually use it. We will see in a later section that the way how an organisation buys its software seems to have an impact on these differences, too. Thus, the significant differences we observe between the unaware users and non-users are apparently the outcome of different kinds of the organisation of work in the IT department or of different professional habits rather than of different ways of using FLOSS. This does of course not imply that those who are unaware that they use FLOSS do their job worse than the other two groups – they do their job differently and have obviously different priorities from the other two groups. Such differences may consist in allowing or prohibiting users outside the IT department to install software on their PCs without coordinating with the IT department.
Type of FLOSS usage Percentage
aware usage 49.4 unaware usage 29.9 non-usage 20.6 Total 100.0
Figure 1 ranks different FLOSS software systems by the share of local governments using these systems. Evidently the GNU/Linux operating system, which is used by almost half of the respondents, is the engine that drives the trend towards FLOSS. The MySQL database system and the Apache web server - used by more than one third of the respondents, respectively – are also widely used FLOSS systems. The Internet browser Mozilla, PHP – a scripting language for developing Internet-applications –, and the desktop suite OpenOffice provide a third important group of FLOSS systems within European local governments, reaching shares of more than one fifth. Samba, Squid, KDE, and Perl provide FLOSS systems that cover 10 to 17% of the local governments, while Gnome, Zope, and Free/OpenBSD play a less significant role. Finally, one third of the respondents reported using “other” FLOSS systems, which suggests that there is a significant usage of niche applications or software for other areas that were left off our list of the most commonly used FLOSS software systems.
Figure 1: Incidence of FLOSS systems in European local governments
Use of FLOSS Percentage
(almost) completely 1.6 partially 16.3 (almost) completely 3.8 partially 40.3 20.3 (n=817) on the PC on the servers experimenting in pilots
The data shows that the high incidence of FLOSS usage does not at all indicate that FLOSS has become a standard within European local governments. A majority of government authorities have
some use of FLOSS, but usage within most organisations is not widespread. FLOSS plays an important role as operating system and for Internet applications, but with regard to desktop applications the potential of FLOSS remains quite untapped.
Clearly, FLOSS has already been quite successful in advancing from the operating systems and Internet applications level to the desktop level, but this process has just begun. The reasons that underlie these differences in terms of desktop adoption could not be clarified by the FLOSSPOLS survey and are subject to further research with a stronger focus on individual FLOSS applications in the field, and desktop applications in particular16.
The strength of the GNU/Linux operating systems is not only evident by its incidence of usage, but also by its perception as a basic component of the IT system of the respondents' organisations.17
Though operating systems of the Microsoft product family have of course a dominant position in the
16 Some research on the technical and cost-related reasons for adoption of FLOSS applications on the desktop
is being conducted by the EU FP6 / IST project COSPA.
17 See question 3 in the attached questionnaire.
33,9 3,0 4,7 5,5 10,2 10,2 14,1 17,0 21,5 24,1 26,0 33,4 33,7 46,6 other Free/Open BSD Zope Gnome Perl KDE Squid Samba OpenOffice.org PHP Mozilla Apache MySQL GNU/Linux n ≈ 900 "other": n = 759
field it is remarkable that already more than one quarter of the local governments that answered the survey consider Linux to be a basis of their overall IT system (see figure 2).
Figure 2: Basic operating systems in European local governments
Besides the Microsoft operating systems and Linux only Unix and Novell Netware reach shares of users above 20%. Given the relatively close relation between Unix and Linux it could be assumed that those organisations that use Unix as their basic operating system at current might change towards Linux rather than towards Microsoft Windows if they decide to migrate. In this regard the potential of Linux that can be estimated from figure 2 would cover 45% of all respondents, which would exceed, for example, the share of Windows NT users.
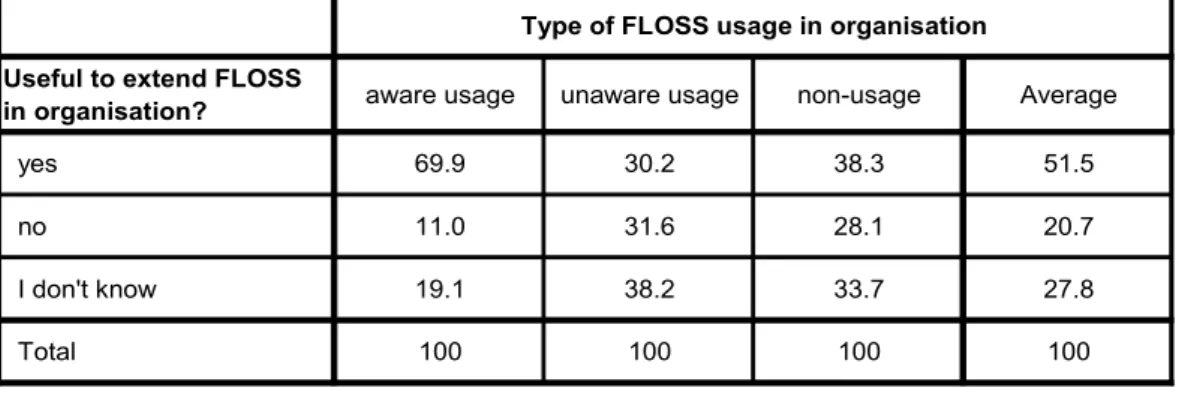
In order to estimate the satisfaction with as well as the future potential of FLOSS usage in European local governments the respondents were asked whether they would find it useful to increase the share of FLOSS in their organisation. While 52% of all respondents agreed, only 21% clearly said no. 28% were not sure whether an extension of FLOSS in their organisation would be useful (see the last column in table 5).
Table 5: Usefulness of increasing the share of FLOSS in European local governments
10.9 0.1 1.3 3.3 4.7 19.5 19.6 25.4 35.7 61.3 71.7 Other (n=910) BEOS (n=906) BSD (n=906) MacOS (n=906) Solaris (n=910) Unix (n=916) Netware (n=906) Linux (n=908) WIN NT (n=920) WIN XP (n=912) WIN 2000 (n=937)
Table 5 allows us to draw two important conclusions from the FLOSSPOLS local governments survey. First, we see that above-average shares of those who find it useful to increase the share of FLOSS in their organisation occur only among the aware users of FLOSS18. Thus we conclude that intentional use and experience with FLOSS leads to a greater willingness to make more use of it; use of Apache, say or Linux – without being aware that this is FLOSS, does not lead to momentum to increase FLOSS usage. The second conclusion derives from the fact that the utility of extending FLOSS use is found less among those organisations who are not aware that they actually use it (unaware users) than among those who are aware that they do not use it (aware non-users). Together with our first observation this suggests that awareness of FLOSS leads to a stronger willingness to use it– regardless of whether or not it is already used in the organisation. One might object here that this is an obvious conclusion, but we would like to point out that it is hard to predict how a group of IT managers who are unaware of which systems they use actually thinks about FLOSS. Thus the opposite result – i. e. a greater willingness of this unaware user group to extend the use of FLOSS in their organisations – could also occur (but does not). Overall these two observations show that ignorance of FLOSS seems to be a strong impediment towards the greater usage of FLOSS. Education and publicity programmes, including the dissemination of best practices, will thus significantly increase the intention of administrations to extend the usage of FLOSS within their organisations.
With regard to the future composition of IT systems in the public sector, experts expect mixed systems (combining proprietary and FLOSS systems) to come up rather than a complete replacement of proprietary systems by FLOSS systems (KBST 2003). Reasons for this assumption are that users
18 It should be noted that aware usage of FLOSS does not automatically lead to positive experiences and a
demand for more FLOSS: exchanging the axes on table 5 shows that 24% of those who do not want an
increase of FLOSS are aware users, though as the table shows this is a small minority (11%)of all aware users.
Type of FLOSS usage in organisation Useful to extend FLOSS
in organisation? aware usage unaware usage non-usage Average
yes 69.9 30.2 38.3 51.5
no 11.0 31.6 28.1 20.7
I don't know 19.1 38.2 33.7 27.8
Total 100 100 100 100
are used to proprietary systems, that many proprietary systems have become de facto standard applications, and that vendor contract conditions often hinder a rapid and full replacement. Nevertheless, though these strong arguments must also affect the perceptions and opinions of IT managers in local governments we found a strong demand for a complete replacement, as more than one fifth (22%) of those who say they would find it useful to increase the share of FLOSS in their organisation would like to replace all proprietary components of their IT system by FLOSS systems. Roughly 74% of the respondents prefer to replace some proprietary components by FLOSS, another 5% do not know whether they prefer to replace components or all proprietary software.
There is a significant19 correlation between the degree of FLOSS usage and the preferred degree of
replacing proprietary software by FLOSS, indicating that 27% of the aware users, but only 12% of the unaware users and 15% of the non-users wish to replace all proprietary software components by FLOSS.
5.2 Driving forces and barriers
Given the strong incidence of FLOSS in European local governments, the question is which are the driving forces that fuel this trend. The FLOSSPOLS local governments questionnaire therefore asked the respondents which advantages and which disadvantages they attribute to FLOSS.
Besides the cost savings argument that is always stressed as a striking advantage of FLOSS, another strong argument for FLOSS is supposedly that it provides access to the source code and thus allows (skilled) users to adapt and improve the software systems according to their specific needs. We therefore asked the respondents whether it would be a substantial improvement for their IT department to have access to the source code. It turned out that this feature of FLOSS is not directly related to the strong interest of local governments in increasing the share of FLOSS in their organisations. Only 28% think it would be an improvement to have that access, whereas 52% think it would not. 20% said they do not know whether access to the source code would be an improvement for their IT department. We suppose that one reason for the relatively low importance of access to the source code is that the exploitation of this advantage of FLOSS requires good programming skills and consumes a considerable amount of time. Especially time is usually a scarce factor in IT departments and therefore we imagine that it is difficult to benefit from access to the source code even for those
19 P < 0.01; contingency coefficient: 0.150. Respondents who answered "I don't know" to question no. 4a in the
IT managers who have the required good skills in programming. However, as the later analysis shows, many respondents believe in the value of FLOSS as more customisable than proprietary software, which is a direct result of the availability of the source code – even if respondents did not always make this connection. Several other attributes of FLOSS that are valued by respondents result directly from the FLOSS licences that provide free access to source code for inspection and third-party modification, even if the access is not itself directly valued.
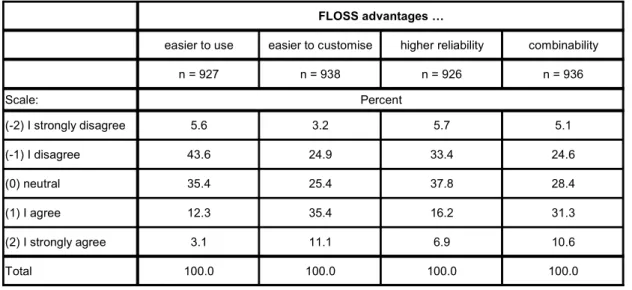
In order to evaluate better the perception of FLOSS in IT departments the respondents were given four statements of possible advantages and four statements of possible disadvantages of FLOSS as compared to proprietary software. The respondents indicated whether and how strongly they agreed or disagreed, and also had the option to express a neutral position or to say "I don't know".
The statements on possible FLOSS advantages were:20
1. Open source software is easier to use than proprietary software 2. Open source software is easier to customise than proprietary software 3. Open source software is more reliable than proprietary software
4. Open source software can very easily be combined with proprietary software within the same IT system
Table 6: Perception of advantages of FLOSS compared to proprietary software
As shown in table 6, usability is not seen as an advantage of FLOSS over proprietary software, as only 15% agreed with statement 1 compared to almost 50% disagreeing. Another third of the respondents showed a neutral position. The statement that FLOSS is easier to customise than proprietary software attracts the strongest endorsement (47%) and the lowest share of respondents with a neutral position. As with usability, reliability is also not seen as an advantage particular to FLOSS. Though 23% of the respondents agree that FLOSS is more reliable than proprietary software, 38% of the respondents are neutral and 39% disagree with the statement (note: this could mean they think it is equally reliable). Meanwhile, combinability provides the feature with the second strongest agreement among the respondents (42%) and comparably low shares of disagreement or neutrality. The features that were addressed as advantages of FLOSS are general software features - i. e. whether FLOSS is easier to use than proprietary software or not – and responses do not, by and large, depend on the organisation that uses it. However, the following possible disadvantages may be highly dependent on the specific capacities and conditions of the organisation that is represented by the respondent. Therefore, the wording of the statements on disadvantages of FLOSS directly addressed the respondent's organisation in order to make sure that he or she will react to the statement from his / her specific organisational view:
5. If open source software would only provide access to the source code, but would not be cheaper than proprietary software, my organisation would not use it.
FLOSS advantages …
easier to use easier to customise higher reliability combinability
n = 927 n = 938 n = 926 n = 936 Scale: Percent (-2) I strongly disagree 5.6 3.2 5.7 5.1 (-1) I disagree 43.6 24.9 33.4 24.6 (0) neutral 35.4 25.4 37.8 28.4 (1) I agree 12.3 35.4 16.2 31.3 (2) I strongly agree 3.1 11.1 6.9 10.6 Total 100.0 100.0 100.0 100.0
6. It is too hard for my organisation to find companies that provide technical support for open source software
7. Migrating to open source software makes sense only if other organisations like mine do it first. 8. Training people in my organisation to use open source software will be too expensive or take too
much time.
Table 7: Perception of disadvantages of FLOSS compared to proprietary software
Table 7 confirms our previous finding that access to the source code alone is not seen as the most important attractor of FLOSS, as the statement that this feature is only interesting in combination with inexpensiveness finds the strongest agreement and the lowest disagreement. (Of course, it is the same licensing terms that provide both source code access and low costs for FLOSS, so the two cannot be disassociated; however this response also indicates that non-FLOSS methods of providing limited access to source code – such as Microsoft's Shared Source programme – may not be seen as an advantage). Difficulties in finding technical support for FLOSS systems are considered to be a problem by 39% of the respondents. Thus, price and technical support would seem to provide the crucial factors for a broad adoption of FLOSS in European local governments. In contrast to these two features, fear of the organisation becoming technologically isolated if it migrates towards FLOSS as a first mover plays a less important role than expected, though it is still significant for 37% of respondents. The fact that FLOSS has reached a critical mass of users (Varian & Shapiro, 2003, 2) has perhaps contributed to lowering the fear of being isolated. Finally, the fear that migrating towards FLOSS would cause large investments in time and money in order to teach people how to use FLOSS still exists for 39% of respondents..
OSS disadvantages …
accessibility of sourcecode not sufficient,
price is also important
lack of technical
support first mover problem
expensiveness of training (cost, time)
n = 898 n = 935 n = 936 n = 938 Scale: Percent (-2) I strongly disagree 4.8 7.8 8.9 6.4 (1) I disagree 16.9 24.4 29.4 29.6 (0) neutral 31.0 28.4 25.0 25.2 (1) I agree 28.5 26.6 23.7 25.3 (2) I strongly agree 18.8 12.8 13.0 13.5 Total 100.0 100.0 100.0 100.0
Based on the values attributed to the respective degree of agreement, disagreement, or neutrality (-2 for strong disagreement, -1 for disagreement, 0 for neutrality, 1 for agreement, and 2 for strong agreement) the the mean values for each item can be calculated, which expresses the overall attitudes towards the different statements. In addition to this, table 8 also provides an overview of differences between aware FLOSS users, unaware FLOSS users, and non-users with regard to their attitudes towards the statements on advantages and disadvantages of FLOSS.
Table 8: Advantages and disadvantages of FLOSS by type of FLOSS user – mean values
The features that were represented in the eight statements are sorted (in descending order) according to their mean values in the "total" column in Table 7, so that the item with the strongest agreement comes first and the one with the strongest disagreement last.21 The means of the total column thus
reproduce our description above: ease of customisation and combinability are the strongest attractors of FLOSS, training and technical support issues are the strongest hindrances towards the adoption of FLOSS systems.
There are however significant differences between the two types of FLOSS users and the non users. Aware FLOSS users differ significantly from non-users in their perceptions of all the proposed
21 While the mean values may theoretically vary between -2 and +2 (see explanation to table 8), the actual
means are much lower and vary between -0.36 and +0.45. This is due to the fact that extreme attitudes (-2 or +2) occur seldom and that neutral positions (0) occur quite often. Given this range, mean values close to -0.4 must be considered as strong disagreement and mean values close to +0.4 as strong agreement.
Total aware FLOSS users unaware FLOSS users non-users
Advantages of FLOSS Mean N deviationStd. Mean N deviationStd. Mean N deviationStd. Mean N deviationStd.
(2) easier to customise 0.26 938 1.05 0.45 470 1.09 0.21 283 0.97 -0.12 185 0.97
(4) combinability 0.18 936 1.08 0.33 469 1.18 -0.03 283 0.94 0.09 184 0.93
(3) higher reliability -0.15 926 0.99 0.03 467 1.08 -0.29 283 0.89 -0.41 176 0.77
(1) easier to use -0.36 927 0.88 -0.36 467 0.98 -0.31 283 0.81 -0.44 177 0.71
Disadvantages of FLOSS Mean N deviationStd. Mean N deviationStd. Mean N deviationStd. Mean N deviationStd. accessibility of sourcecode (5)
not sufficient, price is also important
0.40 898 1.11 0.41 458 1.22 0.35 285 1.02 0.44 155 0.95
(6) lack of technical support 0.12 935 1.15 -0.02 469 1.23 0.43 283 1.01 0.01 183 1.04
(8) expensiveness of training
(cost, time) 0.10 938 1.16 -0.07 469 1.20 0.35 283 1.09 0.15 186 1.09
(7) first mover problem 0.03 936 1.19 -0.18 470 1.25 0.31 283 1.07 0.12 183 1.09
* = According to the scale used in table 5, mean values close to -2 stand for strong disagreement, mean values close to -1 for disagreement, mean values close to 0 for a neutral position, mean values close to 1 for agreement, and mean values close to 2 for strong agreement. Statements are sorted in descending order by mean values of total response, i. e. the most important advantage / disadvantage comes first and the least important advantage / disadvantage last.
advantages of FLOSS, and they differ from unaware users in all proposed advantages except for ease of use. Aware FLOSS users have a very positive opinion on ease of customisation and combinability of FLOSS and they are also much more likely to believe that reliability is an advantage of FLOSS than unaware users or non-users. This is perhaps unsurprising and fairly strong evidence that the greater reliability and customisability of FLOSS is a matter of fact (which only aware users can judge) rather than perception (which is most likely to be expressed by unaware users and non-users). Meanwhile, as one might expect, unaware users differ very little from non-users - only with regard to the ease of customisation, where unaware users agree that this is an advantage of FLOSS, while non-users slightly disagree.
Regarding the negative statements on FLOSS, aware and unaware users differ significantly in their valuation of all statements except for one (access to source code without lower prices is not sufficient for either group). Aware users show a neutral or slightly disagreeing attitude towards the last three items, whereas unaware FLOSS users obviously agree that these are disadvantages. Interestingly aware users and non-users hardly differ in their attitudes towards the negative items that were presented in statements 5 to 8, and both differ considerably from unaware users. Aware users and non-users differ significantly only with regard to the first mover problem (statement 7) and the expense and time consumption of training efforts (statement 8). Obviously, IT managers who have not implemented FLOSS systems in their organisation so far fear being the first to do so and are also worried about perceived high training costs as a consequence of implementing FLOSS. It must however be noted that the mean values of the non-users with regard to these items do not suggest that they are really deterred from FLOSS by these features, on average. Instead, they show a neutral attitude towards these statements. Nevertheless, these features are strong enough to result in a certain degree of uncertainty in these organisations, perhaps leading the IT management to stay with those (proprietary) systems with which they are already familiar.
Unaware users differ significantly from non-users with regard to their perception of a lack of technical support (statement 6)22, being the first to adopt FLOSS systems (statement 7), and costs of
training (statement 8)23. Again, unaware users are much more affected by these fears than non-users.
This perhaps reflects the lower level of technical awareness of these users; aware users clearly have
22 p < 0.01
the most (first-hand) knowledge of FLOSS, but a significant subset of non-users can be presumed to have a better knowledge of FLOSS than the unaware users .
The first mover problem is very closely related to the fear of a lack of technical support for FLOSS. This relation is depicted in table 9, which illustrates that almost 60% of those who say that they fear a lack of technical support for FLOSS also agree that they would not like to be the first among their peer organisations to adopt FLOSS. Accordingly, more than two thirds of those who disagree that technical support for FLOSS is hard to find also disagree with the statement on the first mover problem. Thus, the first mover problem seems to be an expression of the fear of venturing into a new system without support rather than an actual negative perception based on the observation of practices of other local governments.
Table 9: Technical support for FLOSS and the first mover problem
5.3 Organisational context of FLOSS
In general, European local governments usually buy their software separated from the hardware. This applies to 48% of the respondents (see last column in table 10). Another 15% buy their hardware together with the software. 38% buy software in both ways (separated from and together with the hardware) to the same degree. Table 10 illustrates that aware FLOSS users are significantly more likely to buy their software separated from the hardware than unaware FLOSS users or non-users of FLOSS. Accordingly, unaware users and non-users are much more likely to buy their software together with the hardware than aware FLOSS users. This might partially explain why some IT managers do not care as much about (and consequently lack awareness of) the software that runs on their IT system, as they may implicitly leave their software choices to hardware vendors or integrators.
"It is too hard for my organisation to find companies that provide technical support for open source software"
I disagree neutral I agree Total
I disagree 69.3 17.5 27.8 38.3 neutral 12.0 55.5 13.1 24.7 I agree 18.7 27.0 59.1 37.0 Total 100.0 100.0 100.0 100.0 p < 0.001 contingency coefficient: 0.517 n = 930 "Migrating to open source software makes sense only if other organisations like mine do it first"
Table 10: Ways of software purchases in European local governments
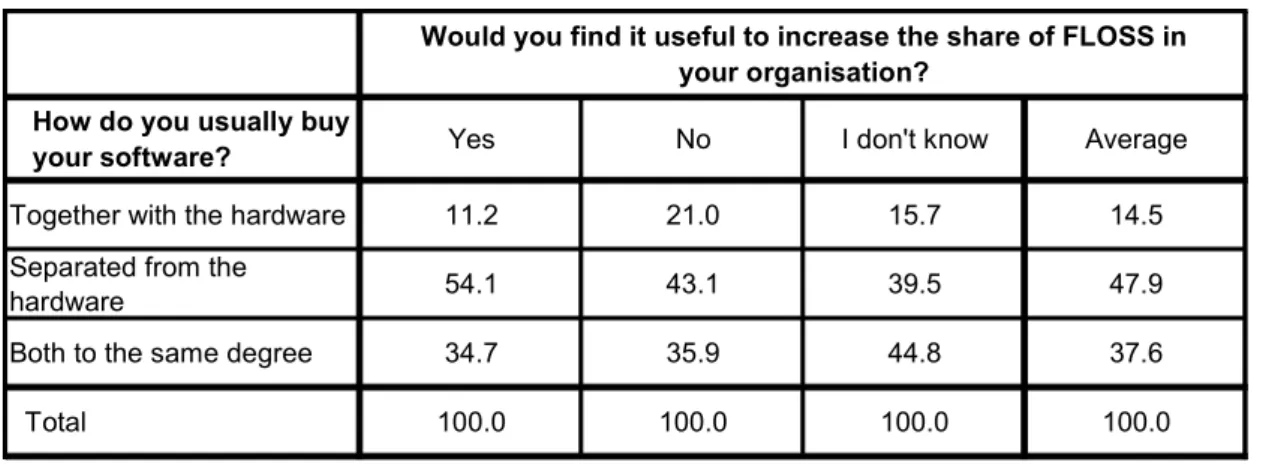
Table 11 examines the software purchasing practices in European local governments in relation to the perceived usefulness of increasing the share of FLOSS in their organisation in future.
Table 11: Software purchasing practices and future FLOSS use
Those who would find it useful to increase the share of FLOSS in their organisation clearly tend to purchase software separated from the hardware, whereas those who consider an increase of FLOSS in their organisation not to be useful tend to purchase software together with the hardware. Those who don't know fall somewhere in the middle, buying software together with and separated from the hardware to the same degree. Acknowledging the relatively weak correlation between these two items, these observations may nevertheless indicate that buying software separated from the hardware generates more willingness to use FLOSS than buying software together with the hardware. One interpretation of this is that those who buy software separately are more in control of their software choices, and want to remain more in control – thereby increasing their awareness and consideration of FLOSS. This is linked to our findings related to interoperability.
Type of FLOSS usage in organisation How do you usually buy
your software? aware usage unaware usage non-usage Average
Together with the hardware 10.9 17.4 19.6 14.6
Separated from the
hardware 54.8 40.6 41.3 47.9
Both to the same degree 34.3 42.0 39.2 37.6
Total 100.0 100.0 100.0 100.0
p < 0.01 Contingency Coefficient: 0.150 n = 934
Would you find it useful to increase the share of FLOSS in your organisation?
How do you usually buy
your software? Yes No I don't know Average
Together with the hardware 11.2 21.0 15.7 14.5 Separated from the
hardware 54.1 43.1 39.5 47.9
Both to the same degree 34.7 35.9 44.8 37.6
Total 100.0 100.0 100.0 100.0
One of the major supposed advantages of FLOSS is its capacity to be interoperable with other software systems (for instance because of the usage of open standards). It is also quite straightforward for a producer of a software application to enable interoperability with a data format used by a FLOSS application even if it is not a standard – e.g. by examining or simply using the FLOSS application's source code. Unless a truly open standard is used, however, it is much more difficult for a software producer to enable interoperability with a data format used by another proprietary software vendor. As a result, software buyers often try to achieve “vendor-independence”, which is to retain the ability to change software products or producers in future without loss of data or significant loss of functionality, e.g. through the use of truly open standards for interoperability. However, this can conflict with implicit or explicit criteria for software purchasing, in particular whether new software is compatible with previously purchased software. Buyers who use the latter criterion rather than a general requirement for open standards or vendor-independent interoperability in effect remain locked in to their previously purchased software. Thus, even if they see the benefits of open standards and believe in interoperability, buyers whose preference for new software is based instead on compatibility with previously installed software are not, in practice, supporting or benefiting from interoperability.
To examine this relationship, the respondents were asked whether they find it more important that new software they buy is compatible with other software from the same product family they already use (= "compatibility") or that new software is compatible with software from other producers and product families (= "interoperability").24 It turned out that 59% of the respondents opted for
interoperability and 33% for compatibility (8% said they did not know). Local governments that are aware they are using FLOSS tend much stronger towards interoperability, 67%, compared to a significantly lower 52% of unaware FLOSS users and 50% of non-users.25 In line with that only 26%
of aware users of FLOSS opt for compatibility, while 42% of unaware users and 39% of FLOSS non-users selected this option, respectively. We can thus conclude that limitations to interoperability that are set by proprietary software help to increase a demand for FLOSS in an organisation – given of course that the IT department of that organisation truly wants interoperability, and is aware of the conflict between interoperability and proprietary software applications that promote lock-in to their own proprietary standards. In contrast, organisations that do not choose first for interoperability are
24 See question no. 8 in the questionnaire
more likely to remain locked in to proprietary vendors providing compatibility with previously purchased software, or to use FLOSS without being aware of it.
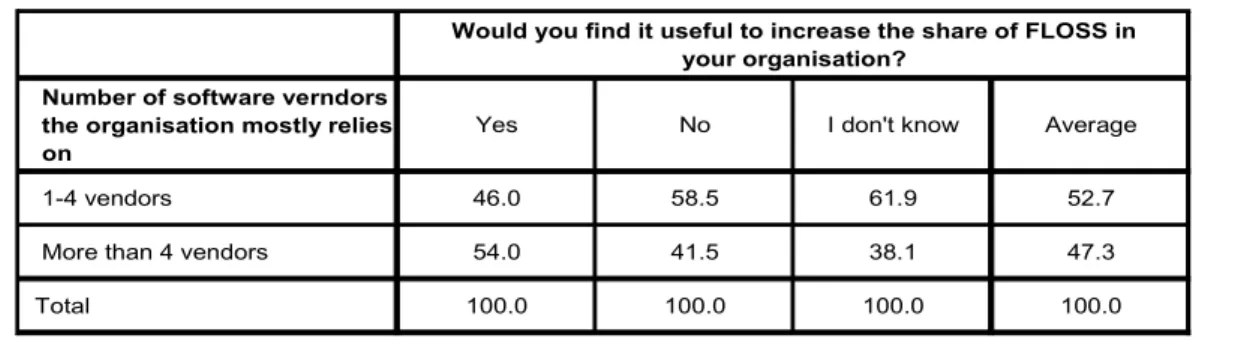
We also see that the perceived usefulness of an increase of FLOSS increases with the perceived need for interoperability. While overall 33% of the respondents opt for compatibility and 59% for interoperability, two thirds of those who value a future increase in FLOSS use opt for interoperability and only one quarter of them for compatibility. In contrast, 48% of those who do not value a future increase in FLOSS use useful opt for compatibility, while another 48% opt for interoperability.26
The question of who determines software purchases in local governments turned out to be difficult to answer, as only 478 respondents replied to that question. The decision-making process in software purchasing in European local governments is highly dependent on the IT managers, i.e. the respondents to the FLOSSPOLS survey. 42% declared that the IT manager is the most important person in the decision making processes, followed by heads of other departments (29%) and the users themselves (23%). We observe that IT managers play the most important role among unaware FLOSS users (59%) and a less important role among non-users (43%; aware users: 55%). Thus, the considerable share of unaware FLOSS users in our sample cannot be explained by a lack of participation of IT managers in software purchasing decisions.
Other department heads and the users in the organisation provide a more important decision-making group for FLOSS non-users. Though these results imply that independence of the IT manager in a local government works in favour of FLOSS, these results are not statistically significant and provide thus only an observation from the sample that should not be generalised.27
Information on the number of software vendors the local government mostly rely on provides an indicator of the degree of dependency of the local governments on their software suppliers. Two assumptions were behind this approach: The first was that a low number of software vendors indicates dependence and higher numbers increasing independence, because reliance on only one or few software vendors is considered to produce a limited overview of alternatives when software is purchased and indicates limited competition between vendors. The second expectation was that a
26 n = 951, p < 0.01, contingency coefficient: 0.212
27 There are no significant differences with regard to the software purchasing decisions between organisations
sense of over-dependency on software vendors probably works as a driver for FLOSS28, which is seen
to provide a greater degree of independence from traditional ties to software vendors and to enhance competition among current and potential vendors.
However, it turned out from the responses that the link between a low number of vendors and a high sense of dependency was different from our expectations. Those respondents who buy from a large number of software vendors feel themselves dependent on their suppliers while those who buy from only a few software vendors consider themselves to be independent. The rationale behind this observation could be that IT managers prefer stable relationships with a small number of software suppliers, and their sense of independence derives from competition (or a larger number) among
potential vendors, which may be unrelated to the number of actual vendors at any given point in time. Moreover, our questionnaire was not designed to determine in further detail the structure of the vendor relationship – for instance, it is possible to have many vendors and a strong sense of dependence if one of them is a large market player and the rest are small vendors. Similarly, one explanation for respondents who have a few vendors but do not feel dependent on them is that these few vendors are selected among several strong competitors.
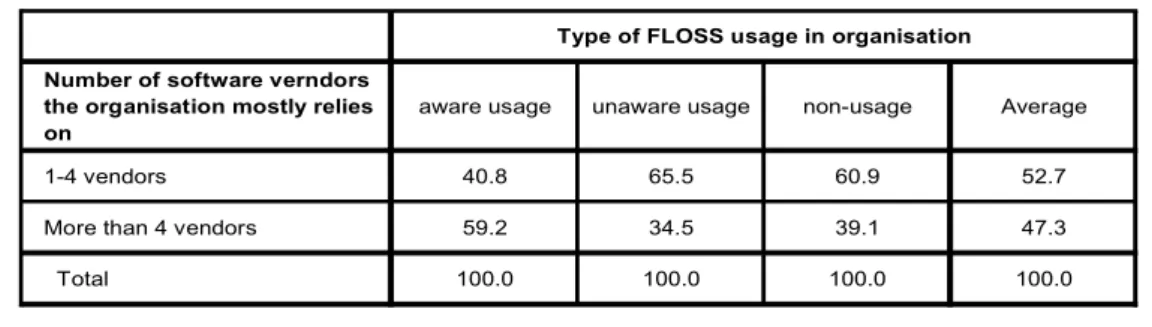
A closer look at the relation between vendor structures and FLOSS usage revealed that aware FLOSS users usually buy software from more than four vendors, whereas non-users and especially unaware users buy usually from one to four vendors (see table 12).29
Table 12: FLOSS usage and number of software vendors
Aware FLOSS users are the only group that features a (slight) above average share in those feel too dependent on their software vendors (46% compared to an average of 44%), whereas only 41% of the
28 This was a finding from our 2003 survey of Dutch government authorities (Ghosh & Glott 2003)
29 4 provides the median value of the number of vendors that were specified by the respondents of the survey,
i.e. roughly one half of the sample buys software from one to four vendors and the other half buys software from more than four vendors.
Type of FLOSS usage in organisation Number of software verndors
the organisation mostly relies on
aware usage unaware usage non-usage Average
1-4 vendors 40.8 65.5 60.9 52.7
More than 4 vendors 59.2 34.5 39.1 47.3
Total 100.0 100.0 100.0 100.0