77:1 (2015) 243–250 | www.jurnalteknologi.utm.my | eISSN 2180–3722 |
Jurnal
Teknologi
Full Paper
F
EATURE
S
ELECTION AND
M
ACHINE
L
EARNING
C
LASSIFICATION FOR
M
ALWARE
D
ETECTION
Ban Mohammed Khammas
a,b, Alireza Monemi
a, Joseph Stephen
Bassi
a, Ismahani Ismail
a, Sulaiman Mohd Nor
a, Muhammad Nadzir
Marsono
a*a
Faculty of Electrical Engineering, Universiti Teknologi Malaysia,
81310 Johor Bahru, Malaysia
b
Network Engineering Department, Collage of Information
Engineering, the University of Al-Nahrain, Baghdad, Iraq
Article history Received
2 October 2015
Received in revised form
30 June 2015
Accepted
1 October 2015
*Corresponding author
[email protected]
Graphical abstract
Abstract
Malware is a computer security problem that can morph to evade traditional detection methods based on known signature matching. Since new malware variants contain patterns that are similar to those in observed malware, machine learning techniques can be used to identify new malware. This work presents a comparative study of several feature selection methods with four different machine learning classifiers in the context of static malware detection based on n-grams analysis. The result shows that the use of Principal Component Analysis (PCA) feature selection and Support Vector Machines (SVM) classification gives the best classification accuracy using a minimum number of features.
Keywords: Malware detection, machine learning, feature selection, principal component analysis, support vector machine
Abstrak
Perisian hasad merupakan masalah keselamatan komputer kerana ia boleh berubah bagi mengelak kaedah pengesanan tradisional yang berasaskan padanan tandatangan. Oleh kerana varian baharu perisian hasad mengandungi corak yang serupa dengan corak perisian hasad yang dicerap, teknik pembelajaran mesin boleh diguna untuk mengenali perisian hasad baharu. Kerja ini membentangkan satu kajian perbandingan kaedah pemilihan ciri dan empat jenis pengklasifikasi pembelajaran mesin yang berbeza dalam konteks pengesanan perisian hasad berdasarkan analisis n-gram. Hasil menunjukkan penggunaan kaedah pemilihan ciri Analisis Komponen Utama dan klasifikasi Sokongan Mesin Vektor memberi ketepatan pengelasan yang terbaik dengan bilangan ciri-ciri yang minimum.
Kata kunci: Pengesanan perisian hasad, pembelajaran mesin, pemilihan ciri, analisis komponen utama, sokongan mesin vektor
© 2015 Penerbit UTM Press. All rights reserved
1.0
INTRODUCTION
The Internet is present everywhere and is a very important part of our daily life. At the same time, the
Internet is prone to constant security threats. One of these threats is malware, which is defined as malicious software that has the ability to exploit vulnerabilities in operating systems and computing applications.
Malware can spread quickly through networks without user intervention. Malware writers are able to generate newer malware versions using construction kits available on the Internet. Different malware variants contain similar basic functionalities inherited from their ancestors, but have either an added functionality (extension) or some non-functional additions in their source codes [1]. Malware detection is still an open research problem because malware writers always update newer malware variants using different obfuscation techniques to evade existing detection methods.
It is necessary to develop new detection techniques to prevent new malware types based on improved misuse (signature-based) or anomaly (non-signature based) detection methods. The problem with anomaly detection methods is the high false alarm rate. Meanwhile, classical misuse or signature-based detection relies on the detection of unique fingerprints for each malware. This technique cannot detect new malware variants. The number of these signatures is increasing every day, thus increasing the size of signature databases. This in turn has increased the processing time needed to match packets for signatures. Therefore, to circumvent this challenge, machine learning has been proposed recently to detect malware. Machine learning techniques generally focus on finding connections in observed data and mining such relations. Machine learning has been proven to be capable of detecting new malware variants [2-4]. The limitation of machine learning techniques is the increasing false alarm rate due to inefficient feature selection techniques, weak and redundant features, and unfit algorithms for generating classifiers [2].
Lima et al. [5], Zhang [6] and Ismail [7] have proven that n-gram features can be used to detect unknown malware successfully. A key issue with n-gram analysis is the feature selection amidst the explosion of a number of features when the n-gram size increases. The relationships between features are complex, where simple statistics filtering approaches cannot provide a viable approach [3]. For large datasets, the training process associated with learning machines is not trivial. Many researches have used different feature selection methods and classification methods to detect malware [2, 6, 8-12]. In this paper, several feature selection techniques and four machine learning classifiers are analysed to find the best feature selection and classifier combination when n-gram features are used in host-based malware detection.
The rest of the paper is organized as follows. Section 2 discusses related works, including an overview of the techniques that are often used with n-gram features to detect malware. Section 3 describes in detail the proposed method associated with n-gram analysis. Section 4 discusses the experimental results and analysis of a number of features with different feature selection methods and the accuracy of four classifiers. Section 5 presents the conclusions of the paper based on the findings and a discussion of future work.
2.0
RELATED WORK
Several techniques are used in intrusion detection systems (IDS) to detect malicious codes. One of these techniques is the proposed n-gram method using supervised learning techniques. Vinod et al. [2] extracted n-gram features from the opcode of files. They extracted different sizes of n-gram = {2, 3, 4 and 5} with two feature selection methods: Principal
Component Analysis (PCA) and Minimum
Redundancy-Maximum Relevance. They trained six different classifiers: Random Forest (RF), Instance Based Learner (IBK), AdaBoostM1, J48, Sequential Minimal Optimization (SMO), and Naive Bayes. The dataset used contained 4805 portable executable (PE) for malware and 2828 for benign samples. The results showed that higher accuracy of 94.1% can be obtained when a 2-gram size with PCA and Random Forest is used. The shortcoming of this work was in the extraction of the opcode n-grams directly from the files since some executable could not be disassembled accurately [9].
Ismail et al. [7] extracted n-gram features from packet payloads to detect new malware at the network infrastructure level. They proposed a pattern similarity detection approach, which is based on the hypothesis that new malware variants carry some of the codes from the previous malware. They incorporated the domain knowledge derived from SNORT signatures with a Naive Bayes classifier. With the use of the Information Gain feature selection method, they were able to prove through their experimental work that a small features search space comprised of only 90 thousand features can be utilized. The dataset contained 2507 training flows and the test dataset had 3470 flows obtained in 2010, and 27491 training flows and 17301 tested flows obtained in 2011. The processing time for the model generation was reduced from 53 hours to 3 hours as a result of the optimization of the number of features. The limitation of their study was that it used the Naive Bayes classifier, which has a lower accuracy compared with other classifiers [2, 11-13]. The researchers took only the most informative features using IG after the feature selection and did not use several features which were really malware features, because the IG chose only those features that appeared with high frequency in the dataset.
In contrast, Moskovitch et al. [11] [13], Reddy and Pujari [10], and Liangboonprakong and Sornil [14] proposed the extraction of n-gram features from the binary code through the use of different feature selection methods and different classifiers. Moskovitch
et al.[11] extracted different n-gram sizes (3, 4, 5, and 6) from the binary codes. They studied three feature selection methods: Gain Ratio (GR), document frequency (DF), and Fisher Score (FS), with four different classifiers: Artificial Neural Networks (ANN), Decision Trees (DT), Naïve Bayes (NB), and SVM. The dataset that they used contained 7,688 malicious files and the benign set contained 22,735 files. The results
showed that the Fisher Score was the best feature selection method, having a high level of accuracy of above 95% when used with the DT, ANN and SVM classifiers. Moskovitch et al. [13] also extracted the same n-gram sizes from the binary codes, but with only two feature selection methods, GR and FS, and with four machine learning classifiers, namely NB, SVM, NN, and DT. The dataset contained 30,000 files. They reported an accuracy of above 95% when a 5-gram size was used with the FS and the DT, NN and SVM classifiers.
In the same way, Reddy and Pujari [10] extracted 2-gram, 3-2-gram, and 4-gram sizes, but used the class-wise document frequency for the feature selection. They combined three classifiers, namely the SVM, Decision Tree and IBK, by using the Dempster Shafer Theory. Their dataset contained 250 virus samples and 250 samples of benign codes with an accuracy of 95%. On the other hand, Liangboonprakong and Sornil [14] extracted n-gram (1, 2, 3, and 4) sequential pattern features. They selected the features using the Sequential Floating Forward Selection (SFFS) method with three classifiers: C4.5, Support Vector Machine (SVM), and Multilayer Perceptron. The overall results showed an accuracy of 96.64% for 4-grams on the SVM classifier. The shortcoming in this study was that only the highest features were selected while the rest, which may have contained real malware features, were ignored.
Xu and Wang [15] extracted n-gram features from the KDD-Cup99 dataset. The accuracy of the multi-class SVM with PCA and without PCA was measured. The results showed that a higher accuracy and faster processing speed were obtained through the use of the SVM with PCA than without PCA. They found that PCA is the most fundamental tool for dimensionality reduction to extract effective features from high dimensional data. At the same time, they proved that the SVM is great for learning a classification with high-dimensional settings. They obtained an accuracy of 83.9% for normal, 99.9% for DoS, 94.1% for Probe, 97.8% for U2R (User to Root), and 58.3% for R2L (Remote to Local) files. The combination of PCA and SVM not only provides high accuracy but also enables faster processing of the network IDS making applications in high speed networks feasible.
3.0
OVERVIEW OF THE METHODS
In order to overcome the problem of choosing the best feature selection method and a suitable classifier to detect malware, comparisons were made between the different machine learning classifiers on static n-gram features with different feature selection methods.
In this paper, the features for malware and normal files were extracted using the n-gram feature extraction technique. An n-gram is a sequence of sub-strings with a length of n–grams [12]. The benefit of using the n-gram is that it can capture the frequency
of words that have a length of n–grams [12]. Table 1 shows n–gram = 1, 2, 3, 4 for the pattern 15E3F44B2AAE5327B486497C.
Table 1 N–grams for different values of n = {1, 2, 3, 4} 1-gram 2-gram 3-gram 4-gram
15 15E3 15E3F4 15E3F44B E3 F44B 4B2AAE 2AAE5327 F4 2AAE 5327B4 B486497C Many researches into n-gram features have suggested 4-grams to be the best [14, 16]. The aim of this research was to reduce the computational overhead required when n-gram analysis is used for feature extraction to detect malware.
The dataset contains many thousands of n-gram features. However, many of these features do not contribute to the classification. Therefore, the feature selection technique is a very important issue in the selection of the minimum number of informative features such that a reduced feature space is likely to be more important than the original dataset for the classifier [2].
3.1Dataset
The dataset for this study was based on the VX Heaven [30], which provides several malware such as worms, viruses, Trojans, and others. The most popular malware in the world in the year 2011 according to [32] are illustrated in Figure 1.
Figure 1Malware types spread throughout the world[32] The dataset that was used for analysis in this work contained 85 malware samples collected from different malware families. The benign files comprised 215 normal samples. These samples were collected from Windows executable files. The number of dataset executable files was similar to the one used in related works [17, 18].
The pre-processing of data contained the calculation of the Term Frequency (TF) for the n-gram features. The TF was used to estimate the frequency of the n-gram features that appeared in a file. This created a matrix containing malware and normal files with TF n-gram vectors.
1.89% 0.08%2.27% 7.77% 16.82% 69.99% 1.18% Backdoor Spyware Adware Worms Viruses
3.2Feature Selection Methods
After the extraction of the n-gram features in the first stage, the second stage was the feature selection stage. In this stage the most informative features were selected and the best one was examined based on the calculation of the classifier accuracy that corresponded with the number of features that were selected using different feature selection methods. The feature selection methods used in this work were: CFsSubset, Principal Components, InfoGainAttribute, Correlation AttributeEval, GainRatioAttribute, and SymmetricalUncertAttribute.
1) Correlation-based Feature Selection (CFsSubset)
The CFsSubset evaluates the prediction of each attribute in terms of their redundancy and the relationship between them. It selects the features that have a large correlation with the class. More details can be found in [19, 20].
2) Principal Components Analysis (PCA)
The PCA is effective for real-time intrusion detection, high speed and masquerade due to its capacity for dimensionality reduction [21, 22]. The Principal Component Analysis (also called the Karhunen-Loe`ve transform) is one of the most widely used dimension reduction techniques for compression and data analysis. It is based on converting a large number of variables into a smaller number of uncorrelated variables by finding a few orthogonal linear combinations of the original variables with the largest variance [22]. The idea of the PCA is described in detail in [15, 21].
3) InfoGainAttribute
The InfoGainAttribut evaluates the feature according to the measurement of its information gain with respect to the class. A more detailed description is given in [10].
4) CorrelationAttributeEval
The CorrelationAttributeEval evaluates those features that are highly correlated to the class, but not highly correlated to each other. The details can be found in [23].
5) GainRatioAttribute
The GainRatioAttribute is designed to overcome a bias in the information gain by considering how the feature splits the data. The details can be found in [13].
6) SymmetricalUncertAttributeEval
SymmetricalUncertAttributeEval valuates the features based on the symmetrical uncertainty of each
attribute. The value of the
SymmetricalUncertAttributeEval is either zero or one, where one indicates that the attribute or feature is relevant to the class, while zero indicates that the attribute is irrelevant to the class. A more detailed description of the SymmetricalUncertAttributeEval is available in [24]
3.3 Classification
Classification is a process whereby the classifier learns from the labelled data samples. The classifier is then tested for its classification accuracy by using it for the testing of data samples. Each sample in the training set has one target value and several attributes. The overall process involves the use of machine learning methods for the classification of unknown files as either malicious or benign. This process is divided into two stages: training and testing. In the training phase, a training set of malicious and benign files is provided to the system. The learning algorithm trains a classifier. During the testing phase, a test set collection of new malicious and benign files, which did not appear in the training set, are classified by the classifier. The classifiers used in this work were the Neural Network (NN), Support Vector Machine (SVM), Decision Tree (J48), and Naive Bayes (NB) classifiers. Neural networks function in much the same way as the human brain. The idea of a neural network is described in [25, 26].
The SVM classifier concept is based on the constructs of a hyper plane or set of hyper planes in a high dimensional space. SVMs use two key concepts to solve this problem: large-margin separation and kernel functions. The kernel method algorithm uses the dot-product function as the main function in this method. This has the following advantages: firstly, it allows the user to use the classifier to classify the data which does not have an intuitive approach, i.e. training the SVM when the data has an unknown distribution or a non-regular distribution. Secondly, it is capable of producing a nonlinear decision plane [13]. The success of SVMs is due to the statistical learning theory studied by Vapnik [27], which gives key insights into the structural risk minimization principle for improving the generalization ability of learning machines.
J48 is a classifier based on tree structure representation, where each node represents a test of individual features and each level represents a class. The input dataset is partitioned by the tree based on the information gained to select the attribute, and the output is the hierarchical structure of the input [11, 12, 28]. The Naive Bayes (NB) classifier uses the Bayes' rule to compute the posterior probability of each class. The predicted output of the classifier is the class with the highest value [7].
4.0
EXPERIMENTS AND ANALYSIS
This work was aimed at analysing the ability of different feature selection methods with four different types of classifiers (Neural Network, SVM, Decision Tree (J48), and Naive Bayes) for n-gram features to detect host-based malware using the WEKA tool [30].
4.1Experimental Setup
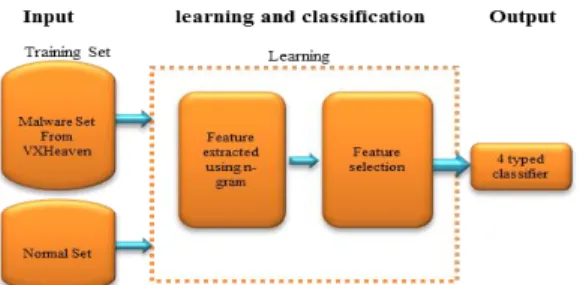
The experiments utilized a dataset consisting of malware executable files obtained from VXHeaven, and normal executables extracted from Windows executable files. Figure 2 illustrates the flow of work for malware detection using machine learning.
Figure 2Flows of work for malware detection using machine learning
The steps in the experiment were as follows: First, the executable files were reprocessed, and the features extraction of these files was done by converting the contents of the malware and benign files into a hexadecimal code using the Hexdump utility. Then, the n-gram (4-gram) features were generated for all the hex data of each file, as described in Section 3. The files were then separated into malware and normal files. The malware and normal files were uploaded to WEKA through the TextDirectoryLoader option to generate an Attribute Relation File Format (ARFF) that could be processed in WEKA. The next step was the feature selection, where different types of feature selection methods were used to select the important features. The feature selection methods used in these experiments were described previously in Section 3.2. The last step was the classification, which was based on obtaining the best accuracy with the minimum number of features from four different types of classifiers.
4.2 Evaluation Criteria
For each classifier, the accuracy was calculated for all feature selection methods with the corresponding number of features that were selected by the feature selection. The experiments were evaluated using TPR, TNR, FPR, and FNR, which were defined according to [12] as follows:
1) TNR: True Negative Rate is the ratio of negative or false samples correctly identified as benign.
TNR =(TN/(TN+ FP)) (18) 2) FPR: False Positive Rate is the ratio of benign
samples incorrectly identified as malware.
FPR =(FP/(FP + FN)) (19) 3) TPR: True Positive Rate is the ratio of actual
positives correctly identified as malware.
TPR =(TP/(TP + FN)) (20) 4) FNR: False Negative Rate is the ratio of malware
samples incorrectly identified as benign.
FNR = (FN / (FN + TP)) (21) where TP, TN, FP, FN are described as follows:
1- TP: number of malware files correctly identified as malware files.
2- TN: number of benign files correctly identified as benign files.
3- FT: number of malware files wrongly identified as benign files.
4- FN: number of benign files wrongly identified as malware files.
The performance of each classifier was measured by the accuracy:
Accuracy = (TP+TN)/(TP+TN+FP+FN) (22)
4.3 Results
The following initial results were obtained from WEKA. The training and testing process details are shown in Tables 2 and 3.
Table 2 describes the results of the experiment using the whole dataset for training, while Table 3 describes the results of the experiment with 80% of the whole dataset for training and 20% of the data for testing.
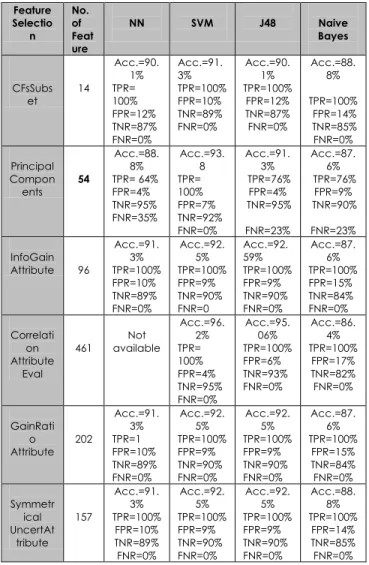
NN, SVM, and J48 demonstrated the highest accuracy with a relatively low false positive. NB gave a low accuracy with a high false positive. This poor performance was because of the feature independence assumption of the Naive Bayes [13]. The SVM classifier gave the highest accuracy for all types of feature selection. When this accuracy was compared with the number of features selected by the feature selection methods, it was clear that the SVM and PCA classifiers gave the best result using a small number of features. Note that the Neural Network classifier did not work due to the increasing number of features, as shown in the Correlation Attribute feature selection method. The CFsSubsets gave the minimum number of features, but the accuracy of this classifier was not very good compared with the other feature selection methods. The Info Gain Attribute, Correlation Attribute Eval, Gain Ratio Attribute, and SymmetricalUncert Attribute Eval gave good accuracy but the number of features that were selected was higher compared to the PCA, which selected a small number of features with good accuracy. Therefore, the PCA proved to be the best in the selection of important features for classification.
Table 2 Different feature selection methods with respect to four classifiers for 100% training
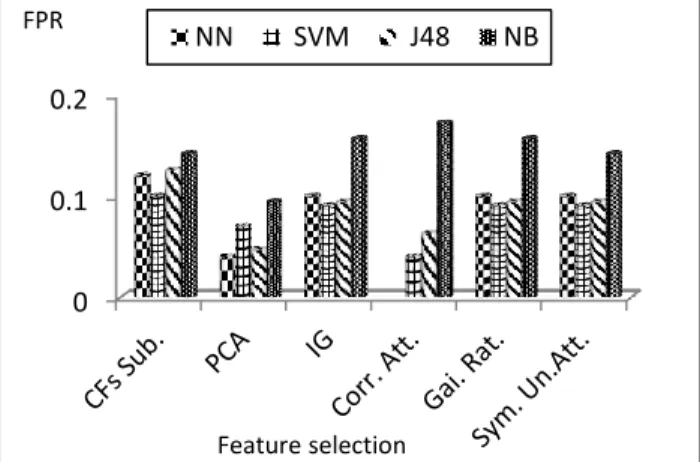
Figures 3 and 4 show the comparison of different types of feature selection methods with respect to false positives for different classifiers. Figures 5 and 6 show the accuracy associated with the feature selection methods for different classifiers.
Table 3 Different feature selection methods with respect to four classifiers using 80% of the dataset for training and 20% for testing
Figure 3 FPR against different feature selection methods for different classifiers for full training
0 0.02 0.04 0.06 0.08 0.1 0.12 0.14 0.16 CFs Sub. PCA IG Corr. Att. Gai. Rat. Sym. Un.Att. NN SVM J48 NB FPR Feature Selectio n No. of Feat ure NN SVM J48 Naive Bayes CFsSubs et 14 Acc.=90. 1% TPR= 100% FPR=12% TNR=87% FNR=0% Acc.=91. 3% TPR=100% FPR=10% TNR=89% FNR=0% Acc.=90. 1% TPR=100% FPR=12% TNR=87% FNR=0% Acc.=88. 8% TPR=100% FPR=14% TNR=85% FNR=0% Principal Compon ents 54 Acc.=88. 8% TPR= 64% FPR=4% TNR=95% FNR=35% Acc.=93. 8 TPR= 100% FPR=7% TNR=92% FNR=0% Acc.=91. 3% TPR=76% FPR=4% TNR=95% FNR=23% Acc.=87. 6% TPR=76% FPR=9% TNR=90% FNR=23% InfoGain Attribute 96 Acc.=91. 3% TPR=100% FPR=10% TNR=89% FNR=0% Acc.=92. 5% TPR=100% FPR=9% TNR=90% FNR=0 Acc.=92. 59% TPR=100% FPR=9% TNR=90% FNR=0% Acc.=87. 6% TPR=100% FPR=15% TNR=84% FNR=0% Correlati on Attribute Eval 461 available Not Acc.=96. 2% TPR= 100% FPR=4% TNR=95% FNR=0% Acc.=95. 06% TPR=100% FPR=6% TNR=93% FNR=0% Acc.=86. 4% TPR=100% FPR=17% TNR=82% FNR=0% GainRati o Attribute 202 Acc.=91. 3% TPR=1 FPR=10% TNR=89% FNR=0% Acc.=92. 5% TPR=100% FPR=9% TNR=90% FNR=0% Acc.=92. 5% TPR=100% FPR=9% TNR=90% FNR=0% Acc.=87. 6% TPR=100% FPR=15% TNR=84% FNR=0% Symmetr ical UncertAt tribute 157 Acc.=91. 3% TPR=100% FPR=10% TNR=89% FNR=0% Acc.=92. 5% TPR=100% FPR=9% TNR=90% FNR=0% Acc.=92. 5% TPR=100% FPR=9% TNR=90% FNR=0% Acc.=88. 8% TPR=100% FPR=14% TNR=85% FNR=0% Feature selection No. of Feat ures NN SVM J48 Naive Bayes CFsSubset 14 Acc.=96. 5% TPR= 100% FPR=4% TNR=95% FNR=0% Acc.=96. 5% TPR= 100% FPR=4% TNR=95% FNR=0% Acc.=96. 0% TPR=100 % FPR=5% TNR=95% FNR=0% Acc.=92. 0% TPR=100 % FPR=10% TNR=90% FNR=0% Principal Compone nts 54 Acc.=97. 5% TPR= 100% FPR=3% TNR=96% FNR=0% Acc.=97. 7% TPR=90% FPR=0% TNR=99% FNR=9% Acc.=97. 7% TPR=91% FPR=6% TNR=99% FNR=8% Acc.=90. 3% TPR=94% FPR=10% TNR=89% FNR=5% InfoGain Attribute 96 Acc.=96. 2% TPR= 100% FPR=4% TNR=95% FNR=0% Acc.=96. 2% TPR=100 % FPR=4% TNR=95% FNR=0% Acc.=96. 2% TPR= 100% FPR=47% TNR=95% FNR=0% Acc.=89. 3% TPR=100 % FPR=14% TNR=86% FNR=0% Correlatio n AttributeE val 461 Not available Acc.=98. 2% TPR= 100% FPR=2% TNR=97% FNR=0% Acc.=97. 5% TPR= 98% FPR=2% TNR=97% FNR=1% Acc.=87. 9% TPR=100 % FPR=15% TNR=84% FNR=0% GainRatio Attribute 202 Acc.=96. 5% TPR=100 % FPR=4% TNR=9% FNR=0% Acc.=96. 5% TPR=100 % FPR=4% TNR=95% FNR=0% Acc.=96. 2% TPR=100 % FPR=4% TNR=95% FNR=0% Acc.=88. 8% TPR=100 % FPR=14% TNR=85% FNR=0% Symmetri cal UncertAttr ibute 157 Acc.=96. 5% TPR=100 % FPR=4% TNR=95% FNR=0% Acc.=96. 5% TPR=100 % FPR=4% TNR=95% FNR=0% Acc.=96. 2% TPR=100 % FPR=4% TNR=95% FNR=0% Acc.=89. 1% TPR=100 % FPR=13% TNR=86% FNR=0%
Figure 4 FPR against different feature selection methods for different classifiers using 80% of the dataset for training
and 20% for testing
Figure 5 Ratio of accuracy for different classifiers against different feature selection methods using dataset for full training
Figure 6 Ratio of accuracy for different classifiers against different feature selection methods using 80% of the dataset for training and 20% for testing
5.0
CONCLUSION AND FUTURE WORK
This paper focused on the analysis of malware detection using the n-gram technique under supervised learning classification. The experiments showed that the use of PCA for feature selection led to a substantial reduction in features for malware samples compared with the other feature selection methods. The PCA also required little training and was better than the other feature selection methods. A good accuracy was obtained by combining the PCA with SVM, as shown in Figures 3 and 5, where the dataset was used for full training. In Figures 4 and 6 80% of the dataset was used for training and 20% for testing.
The results also showed that the SVM classifier was highly accurate and this was in agreement with the results obtained by other researchers as in [3, 14, 15, 29]. This shows that this type of classifier can produce the best result with high accuracy. For future work, the selection of the n-gram sub-rule will be extracted from SNORT signature and combined with machine learning for better accuracy. Also high speed zero-day malware and metamorphic malware detection can be further explored using a combination of PCA with SVM.
Acknowledgement
The first author would like to thanks the Ministry of Higher Education and Scientific Research, Iraq for providing Doctoral scholarship for her study.
References
[1] Chionis, I., Nikolopoulos, S. D., and Polenakis I. 2013. A
Survey on Algorithmic Techniques for Malware Detection.
Proc. 2nd Int'l Symposium on Computing in Informatics and Mathematics (ISCIM'13). 29-34.
[2] Vinod, P., Laxmi, V., and Gaur, M. S. 2012. REFORM:
Relevant Features for Malware Analysis. 26th International
Conference on Advanced Information Networking and Applications Workshops (WAINA). 738-744.
[3] O'Kane, P., Sezer, S., McLaughlin, K., and Im, E. 2013. SVM
Training Phase Reduction Using Dataset Feature Filtering for
Malware Detection. IEEE Transactions on Information
Forensics and Security. 8(3): 500-509.
[4] Hadžiosmanović, D., Simionato, L., Bolzoni, D., Zambon, E.,
and Etalle, S. 2012. N-Gram Against the Machine: On the Feasibility of the N-Gram Network Analysis for Binary
Protocols. Research in Attacks, Intrusions, and Defenses.
Springer. 354-373.
[5] de Lima, I. V. M., Degaspari, J. A., and Sobral, J. B. M. 2008.
Intrusion Detection Through Artificial Neural Networks. Network Operations and Management Symposium, NOMS.
IEEE. 867-870.
[6] Zhang, B., Yin, J., Hao, J., Zhang, D., and Wang, S. 2007.
Malicious Codes Detection Based on Ensemble Learning. Autonomic and Trusted Computing. Springer. 468-477.
[7] Ismail, I. 2013. Naive Bayes Classification with Domain
Knowledge for New Malware Variants and Stateless Packet Level Detections. 0 0.1 0.2 NN SVM J48 NB FPR Feature selection 80.00% 82.00% 84.00% 86.00% 88.00% 90.00% 92.00% 94.00% 96.00% 98.00% acc. NN acc. SV M acc. J48 acc. NB Accuracy Feature selection
[8] Yan, G., Brown, N., and Kong, D. 2013. Exploring
Discriminatory Features for Automated Malware
Classification. Detection of Intrusions and Malware, and
Vulnerability Assessment. Springer. 41-61.
[9] Islam, R. and Altas, I. 2012. A Comparative Study of
Malware Family Classification. Information and
Communications Security. Springer. 488-496.
[10] Reddy, D. K. S. and Pujari, A. K. 2006. N-gram Analysis for
Computer Virus Detection. Journal in Computer Virology.
Springer. 2: 231-239.
[11] Moskovitch, R., Stopel D., Feher C., Nissim N., and Elovici Y.
2008. Unknown Malcode Detection via Text Categorization
and the Imbalance Problem. IEEE International Conference
on Intelligence and Security Informatics. ISI. 156-161.
[12] Jain, S. and Meena, Y. K. 2011. Byte Level n–Gram Analysis
for Malware Detection. Computer Networks and Intelligent
Computing. Springer. 51-59.
[13] Moskovitch, R., Stopel, D., Feher, C., Nissim, N., Japkowicz,
N., and Elovici, Y. 2009. Unknown Malcode Detection and
the Imbalance Problem. Journal in Computer Virology.
Springer. 5: 295-308.
[14] Liangboonprakong, C. and Sornil, O. 2013. Classification of
Malware Families Based on N-Grams Sequential Pattern
Features. 8th IEEE Conference on Industrial Electronics and
Applications (ICIEA). 777-782.
[15] Xu, X. and Wang, X. 2005. An Adaptive Network Intrusion
Detection Method Based on PCA and Support Vector
Machines. Advanced Data Mining and Applications.
Springer. 696-703.
[16] Kolter, J. Z. and Maloof, M. A. 2004. Learning to Detect
Malicious Executables in the Wild. Proceedings of the tenth
ACM SIGKDD International Conference on Knowledge Discovery and Data Mining. 470-478.
[17] Leder, F., Steinbock, B., and Martini, P. 2009. Classification
and Detection of Metamorphic Malware Using Value Set
Analysis. 4th International Conference on Malicious and
Unwanted Software (MALWARE). 39-46.
[18] Agrawal, H. 2011. Detection of Global Metamorphic
Malware Variants Using Control and Data Flow Analysis. Google Patents.
[19] Witten, I. H., and Frank, E. 2005. Data Miming Practical
Machine Learning Tools and Techniques.
[20] Karegowda, A. G., Manjunath, A., and Jayaram, M. 2010.
Comparative Study of Attribute Selection Using Gain Ratio
and Correlation Based Feature Selection. International
Journal of Information Technology and Knowledge Management. 2: 271-277.
[21] Wang, W., Zhang, X., and Gombault, S. 2009. Constructing
Attribute Weights from Computer Audit Data for Effective
Intrusion Detection. Journal of Systems and Software. 82:
1974-1981.
[22] Wang, W., Guan, X., and Zhang, X. 2008. Processing of
Massive Audit Data Streams for Real-time Anomaly Intrusion
Detection. Computer Communications. 31: 58-72.
[23] Hall, M. A. 1999. Correlation-Based Feature Selection for
Machine Learning. The University of Waikato.
[24] Hu, L. and Zhang, L. 2012. Real-time Internet Traffic
Identification Based on Decision Tree. World Automation
Congress (WAC). IEEE. 1-3.
[25] Ganapathy, S., Kulothungan, K., Muthurajkumar, S.,
Vijayalakshmi, M., Yogesh, P., and Kannan, A. 2013. Intelligent Feature Selection and Classification Techniques
for Intrusion Detection in Networks: A Survey. EURASIP
Journal on Wireless Communications and Networking.
Springer. 2013(1): 1-16.
[26] Shabtai, A., Moskovitch, R., Elovici, Y., and Glezer, C. 2009.
Detection of Malicious Code by Applying Machine Learning Classifiers on Static Features: A State-of-the-Art Survey. Information Security Technical Report. 14: 16-29.
[27] Vapnik, V. 1998. Statistical Learning Theory. Wiley. New
York.
[28] Konig, R., Johansson U., Lofstrom T., and Niklasson L. 2010.
Improving Gp Classification Performance by Injection of
Decision Trees. IEEE Congress on Evolutionary Computation
(CEC). 1-8.
[29] Önem, I. M. 2013. Testing and Improving the Performance
of SVM Classifier in Intrusion Detection Scenario.
Knowledge Discovery. Knowledge Engineering and
Knowledge Management. Springer. 173-184.
[30] Weka library, Data Mining Software in Java. [Online].
Available http://www.cs.waikato.ac.nz/ml/weka.
[31] VX Heaven collection, VX Heaven website, available at:
http://vx.netlux.org.
![Figure 1 Malware types spread throughout the world [32]](https://thumb-us.123doks.com/thumbv2/123dok_us/9809138.2473068/3.918.492.830.646.799/figure-malware-types-spread-world.webp)