WIND ENERGY FOR SUSTAINABLE DEVELOPMENT
M.N.H. Comsan
Egyptian Nuclear Physics Association (ENPA), Cairo, Egypt
The growing demand in energy and concern about depleting natural resources and global warming has led states worldwide to consider alternatives to the use of fossile fuel for energy production. Several countries especially in Europe have already increased their renewable energy share 6-10%, expected to increase to 20% by the year 2020. For Egypt excellent resources of wind and solar energy exist. The article discusses perspectives of wind energy in Egypt with projections to generate ~ 3.5 GWe by 2022, representing ~9% of the total installed power at that time (40.2 GW). Total renewables (hydro + wind + solar) are expected to provide ~7.4 GWe by 2022 representing ~ 19% of the total installed power. Such a share would reduce dependence on depleting oil and gas resources, and hence improve country’s sustainable development.
Keywords: Wind energy, Wind power perspectives, Egypt’s wind power, Sustainability.
INTRODUCTION
Energy is fundamental to the quality of life on the earth. It is a key ingredient in all sectors of modern economies. We are totally dependent on an abundant and uninterrupted supply of energy for living and working. Meeting the growing demand for energy sustainably is one of the major challenges of the twenty-first century. By 2050, the world’s population is set to increase from 6.6 billion currently to more than nine billion. Energy use during this period is set to double. Consumption of energy resources by humans adds substantially to
CO2 emissions that contribute to climate change. Urgently arresting climate change is in the
interests of all nations. Transition to a low carbon economy is therefore a global aim that envelops every single nation.
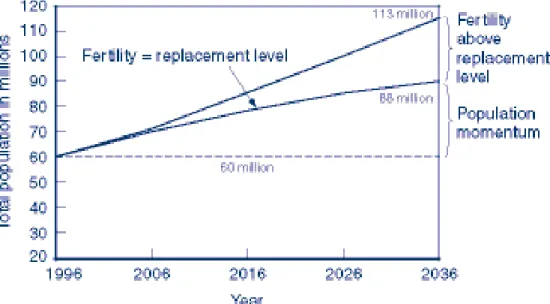
Egypt is a fast growing country with population 80.3 millions as of July 2007. Moderate population growth trends forecast 99 millions and 128 millions by 2050. Fig. 1 gives Egypt’s projected population growth according to the National Demographic Centre as of March 2007 [1]. On the other hand Egypt is known to be in shortage of oil and gas resources. Fig. 2 shows Egypt’s oil production and consumption during the period 1980-2004. As is evident gap between both curves is drastically diminishing, with Egypt becoming a net oil importer in 2007. According to the US Energy Information Administration estimates, crude oil reserves in Egypt are expected to deplete by 2012, while gas reserves will be overstrained starting from 2030 [2]. Fig. 3 gives Egypt’s gas production for the period 1980-2002 with noticeable production increase from 1999. With increase in population and growing increase on electricity due to natural economic development Estimations electricity demands taking in consideration population growth and country’s moderate industrial, agricultural and services development installed electricity generation capacity are forecasted at 40.2 by 2022, 60.6 GW
by 2032 and 138 GW by 2052 as compared to 2007 installed capacity of 20.5 GW [3]. Meeting these demands is almost impossible using known limited national fossil fuel reserves. A major policy shift towards the use of non-fossil resources is to be adopted.
Figure 1. Egypt projected population growth (1996-2036).
Figure 3. Egypt’s natural gas production.
GLOBAL WIND ENERGY
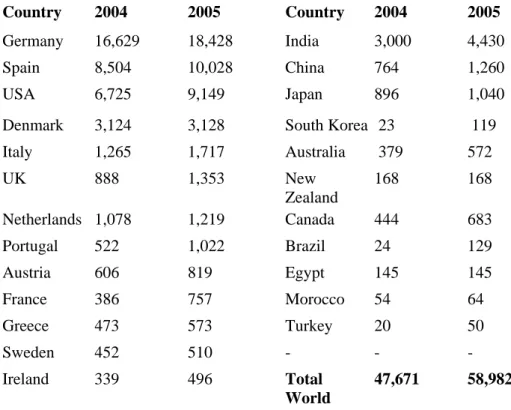
Wind energy was used as a source of power for centuries, however during the industrial revolution it was replaced by fossil fuels owing to the difference in costs and reliability. Following the 1973 oil crisis, interest in wind energy, as well as other renewable energy resources, was renewed and wind energy technologies were developed, demonstrated and field tested in different applications. Since then, particularly during the last two decades, wind energy technologies for electricity generation were tremendously developed and reached a remarkable state of technical maturity. Wind power is used in large scale wind farms for national electrical grids as well as in small individual units for providing electricity to rural residences or grid-isolated locations. In 2005, worldwide capacity of wind-powered generators was 58.982 GWe [4].
Wind Energy Resource Potential
The economics of wind power depend strongly upon wind speed. The actual energy contained in the wind varies with the wind speed to the third power. The potential of global wind energy is large, with the technical potential of generating electricity onshore estimated at 20,000-50,000 terawatt hours per year (TWh/y). When investigating potential sites, special attention should go to off shore possibilities. Studies for Europe indicate that the offshore wind resources that can be tapped into are bigger than the total electricity demand in Europe. The world largest wind plant is the Raheenleagh Wind Farm located off the coast of Ireland. It will have 200 turbines, a total power of 520 MW and cost ~ 600 MUS$ to build. Table 1 gives operating wind power capacity in MW as distributed by regions during the peiod
1995-2001, while table 2 gives the distribution of total installed wind power capacity in MW as
Table 1. Operating wind power capacity by region in MW (1995-2001). January 2001 End of 1999 End of 1997 End of 1995 Region 2 708 2 619 1 607 1 612 Total America (North) 94 87 38 11 Total America (South & Central)
1 466 1 287 1 116 609 Total Asia 11 831 9 307 4 677 2 518 Total Europe 143 39 24 12
Total Middle East and Africa 219 116 33 17 Total Pacific Region 16 461 13 455 7 495 4 779 World Total
Table 2. Total installed wind power capacity in MW (2004-2005).
2005 2004 Country 2005 2004 Country 4,430 3,000 India 18,428 16,629 Germany 1,260 764 China 10,028 8,504 Spain 1,040 896 Japan 9,149 6,725 USA 119 23 South Korea 3,128 3,124 Denmark 572 379 Australia 1,717 1,265 Italy 168 168 New Zealand 1,353 888 UK 683 444 Canada 1,219 1,078 Netherlands 129 24 Brazil 1,022 522 Portugal 145 145 Egypt 819 606 Austria 64 54 Morocco 757 386 France 50 20 Turkey 573 473 Greece -- -510 452 Sweden 58,982 47,671 Total World 496 339 Ireland
Wind Technology’s Development
As a result of intensive basic and applied researches over the last 20 years, development and demonstration efforts are exceptional in several industrialized countries, with leading research centres and industries in Denmark, the Netherlands, the United States of America,
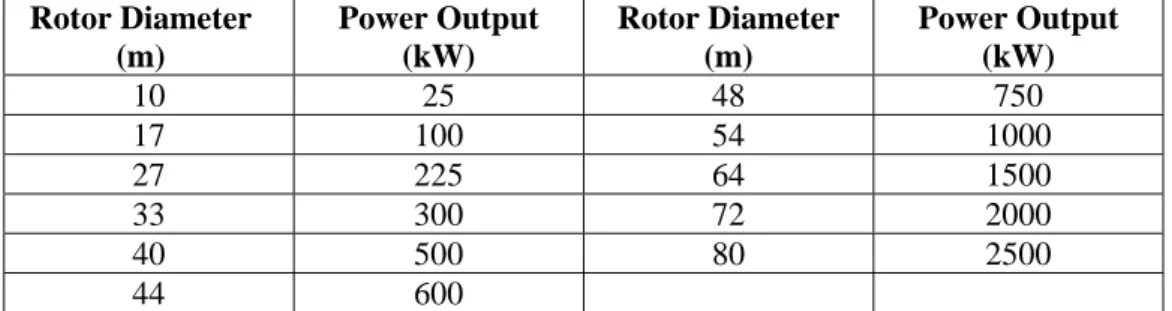
Germany and others. The technologies of wind turbines for electricity generation are now in full progress. Thus during the 1980s, the standard turbine size tended to be between 300 kilowatt (kW) and 500 kW, while during the 1990s, turbine unit size continued to increase steadily. By 2000, most new wind farms were employed turbines with capacities of between 600 kW and 750 kW. The wind farm concept was developed, which resulted in the promotion of the use of wind electricity generation to large-scale grid-connected applications. Table 3 gives the rotor size (in m) and the maximum power output (in kW) for modern wind turbines. The power output has been increased 50 fold with 8-fold increase in rotor diameter [6].
Table 3. Rotor size and maximum power output
Rotor Diameter (m) Power Output (kW) Rotor Diameter (m) Power Output (kW) 10 25 48 750 17 100 54 1000 27 225 64 1500 33 300 72 2000 40 500 80 2500 44 600
Trends in Wind Technology
It is believed that wind turbines will become larger market demands. The average size of' wind turbines installed is expected to be 1,200 kW, and 1,500 kW after 2010. Wind turbines will become more controllable and grid-compatible. They will have fewer components, far lower costs and greater reliability and maintainability. Industry should take care the environmental impact of wind turbines, with noise and visibility drawbacks causing the most problems. These drawbacks should be reolved to avoid public resistance against the installation of new turbines in densely populated countries, and hence efficient use if this environment friendly technology [7].
EGYPT’S RENEWABLE ENERGY STRATEGY
Since 1970s, Ministry of Electricity and Energy has given due consideration to the Renewable Energy (RE) resources. In early 1980s, a renewable energy strategy was formulated as an integral part of the national energy planning in Egypt. Such strategy has been revised in view of the projections for possible RE technologies/application options, available financing sources and investment opportunities in the field. Currently, the strategy targets to satisfy 3% of the electric energy demand from renewable energy resources, mainly wind and solar, by the year 2010, with additional contribution of other RE applications
The New and Renewable Energy Authority
In 1986 New and Renewable Energy Authority (NREA) was established to act as the national focal point for expanding efforts to develop and introduce renewable energy technologies to Egypt on a commercial scale together with implementation of related energy conservation programs. According to its mandate NREA is entrusted to plan and implement renewable energy programs in coordination with other concerned national and international institutions within the framework of its mandate which includes:
- Research, development, demonstration, testing and evaluation of the different RE
technologies focusing on solar, wind and biomass.
- Implementation of renewable energy projects.
- Proposing the Egyptian standard specifications for renewable energy equipment and systems, and conducting tests to evaluate their performance, under the Egyptian prevailing conditions, hence issuing respective licensing certificates to that effect.
- Rendering of consultancy services in the field of renewable energy.
- Technology transfer and development of local manufacturing of Renewable Energy equipment.
- Education, training and information dissemination [8] .
EGYPT’S WIND ENERGY PERSPECTIVES
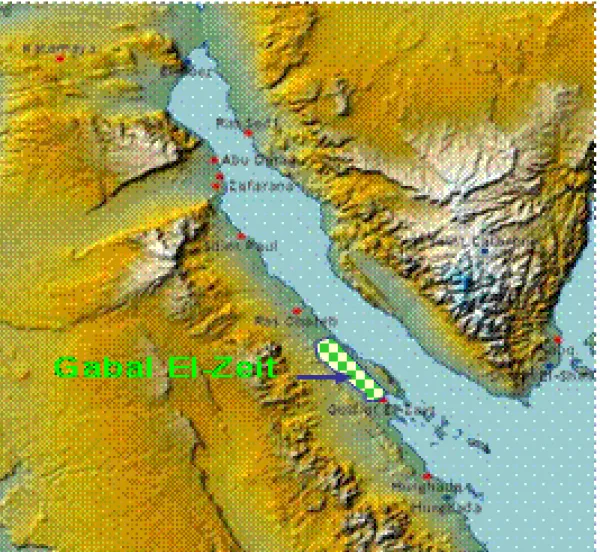
Coastal zones in Egypt enjoy high wind energy potential particularly at the Suez Canal and Red Sea Coast. In 1988, a local wind farm with a capacity 400 kW was erected in Ras Ghareb. During the period 1992-1995 a pilot wind farm with total power 5.2 MW was erected in Hurgada, connected to the local city grid in 1993 and to the national electricity grid in 1998. A large scale wind farm started operation in 2000 with power 63 MW, connected to the national grid in 2001 and increased its power to 305 MW in 2007. In March 2003 a detailed wind atlas of Suez Gulf area based on accurate wind data collected during 1991-2001 was issued including 13 sites in the area. Data revealed excellent wind regime > 10 m/s for most parts of the area. A wind atlas for the Suez Canal - Red Sea zone and Egypt covering 30 sites was issued in Dec. 2005 based on data collected during the period 1991-2001. The atlas shows the locations of most favorable areas for wind power generation. Favorable wind speeds of 9-11 m/s (at 50 m height) of sufficient strength and stability exist at Abu-Darag, Zaafarana, Ras Ghareb and El-Zeit Gulf. According to estimates, the total power that could be generated using wind farms along the Red Sea coast approximates 20 GW [9,10].
Wind Atlas of Egypt
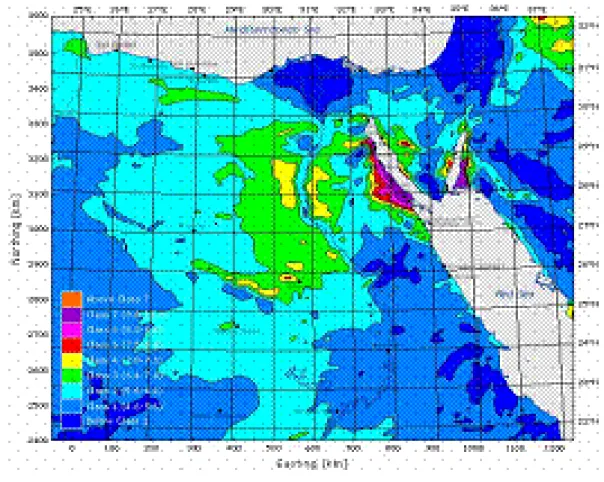
The wind atlas of Egypt has been established among Risø National Laboratory of Denmark, the Egyptian Meteorological Authority (EMA), and New and Renewable Energy Authority (NREA). Hourly data of wind speed and direction in the period 1981-1995 at 25 surface meteorological stations have been used to depict climate features of wind over Egypt. It was found that mean annual wind speed ranged from 2 m. /sec to 7.5 m. /sec with maximum centers at Port Said, Hurghada, Ras Benass, Elowainat, and around Nasser lake. Centers of minimum speeds have been found at Siwa, El-Arish, and Luxor. Estimations of power density of wind have indicated that promising areas of wind energy are located at Port Said, Hurghada, Ras Benass, and around Nasser Lake. At some places, maximum available
wind energy at 50 meters above ground level has culminated to 3114 watt/ m2. Ras Benass,
Hurghada, Port Said, adjacent areas to Nasser lake, and Elowainat were identified as the most suitable regions over Egypt to erect wind farms [10-11].
Figure 5. Egypt’s wind map.
Table 4. Wind speed - Gulf of Suez and North Red Sea coast.
Location Average Wind Speed (m/s) at 26 m height Location Average Wind Speed (m/s) at 26 m height
Ras Sidr 7.5 Abu Darag 8.8
El-Tur 5.6 Ras Ghareb 10.0
St. Paul 8.4 El-Zeit Gulf (north) 10.4
Zafarana (north) 9.2 El-Zeit Gulf (north-west) 10.5
Zafarana 9.0 El-Zeit Gulf 10.3
Table 4 gives wind speeds measured along the Gulf of Suez and the North Red Sea
Coast, while figure 6 shows mean energy density isocurves in kW/m2 illustrating and
Ras-Banas, Hurgada and Port-Said as most promising sites for wind energy generation.
Figure 6. Wind mean energy iso-curves.
Wind Energy Pilot Projects
In 1988, the first wind farm with a capacity of (400kW) was installed in Ras Ghareb on the Red Sea Coast serving one of the oil companies. The wind farm consisted of 4 units, 100 kW each using fully imported wind turbines.
In 1992, the second wind farm of 4x100 kW each turbines was installed at Hurghada on the Red Sea Coast. 45% of the wind turbine components were locally manufactured, mainly blades, towers and other mechanical parts. The farm has been connected to the local network of Hurghada city. Part of the wind generated electricity was powering desalination units to
produce 130 m3 /day of potable water to satisfy needs of water at NREA' site facilities in
Hurghada.
Hurgada Wind Farm
This was the first commercial wind farm. It consists of 38 wind turbines of different technologies and ratings (100-300 kW) with a total power 5.2 MW with 50% of the components locally manufactured. The farm was erected during the period 1992-95, connected to the local grid and operated successfully since 1993. Later on in 1998, the farm was connected to the national grid is producing more than 15 million kWh/year. The farm together with the Wind Energy Technology Center (WETC) existing in the same site served as centre of excellence for national manpower development in wind energy technologies: in the design, erection, operation & maintenance and applied researches for comparative performance evaluation[12].
Figure 7. Hurgada Wind Energy Centre.
Figure 8. Zafarana wind site.
Zafarana Large Scale Wind Farm
This is the single large scale wind farm in Egypt. It occupies a site that was considered during 1980s as one of alternative sites of Egypt’s NPP programme. The sie has an area of 82
large-scale wind electricity programs. The wind farm itself consists of several stages some of which are already operating while the others are under construction or planned. Operating are:
- 1st stage (63 MW) erected in cooperation with Denmark and Germany, connected to the national grid and operated since Nov. 2000 and Feb. 2001,
- 2nd stage (77 MW) erected as Egyptian, Danish and German joint venture and connected to the grid in Nov. 2003 and Jan. 2004,
- 3rd stage (85 MW) by the same Egyptian, Danish and German joint venture company. Operated and connected to the grid in 2006.
Under Construction is the 4th stage (120 MW) in cooperation with Japan. Planned is the 5 th stage (60 MW) in cooperation with Spain.
Total Zafarana wind power is 405 MW to be increased further to 600 MW by 2012 [13].
Figure 9. Zafarana wind farm.
Zafarana Transmitted Electricity
Zafarana wind farm demonstrated the feasibility of constructing and operating large scale wind farms in Egypt. During its years of operation the farm had supplied electricity to Egypt’s national grid with:
- Maximum transmitted electricity is 1028 MWh in March 2006, - Minimum transmitted electricity is 542 MWh in October 2006,
- Wind electricity selling price to the Canal Co. for Electricity Distribution is 12 piaster/kWh [13].
Wind Independent Power Producers (IPP), Private Sector
Along with the state owned electricity generating companies, the electricity deregulation policy adopted in 1994, the private sector had been given the chance to build, operate and transfer energy producing units. In this respect wind independent power producers benefited
coast with average air speed 9 m/s to construct and operate a wind farm with total 500 MW installed capacity. According to available information the following stages are planned [14]:
- 1st stage 20 MW, 35 turbines x600 kW, expected 2008,
- 2nd stage 80 MW, 80 turbines x1 MW, expected 2010,
- 3rd stage 200 MW, 40 turbines x5 MW, expected 2012.
EGYPT’S WIND POWER PLANS
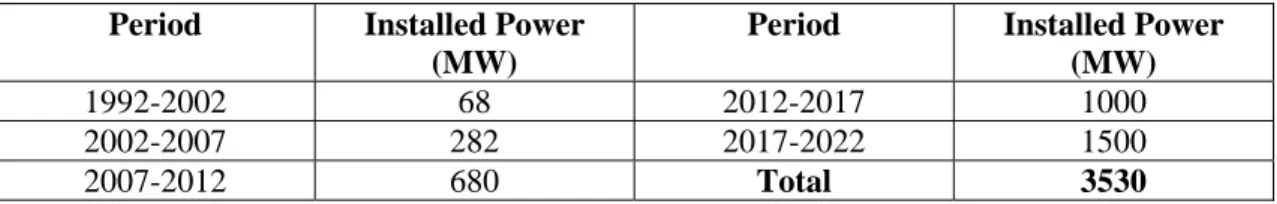
According to the decision of Egypt’s Supreme Council for Energy, the renewable electricity share should constitute ~20% of the total installed power by 2027. The renewable share (wind+hydro+solar) heavily relies on the developments in wind energy generation. Table 5 summarizes information available on operating and planned wind power during the period 1992-2022. Figures for 2012-2022 are based on the five year plans of the Ministry of Electricity and Energy as is available on its web site [15].
Table 5. Egypt’s wind power plans.
Period Installed Power
(MW)
Period Installed Power
(MW)
1992-2002 68 2012-2017 1000
2002-2007 282 2017-2022 1500
2007-2012 680 Total 3530
CONCLUSION
Egypt has good potential of wind power. A total of 20 GW installed electric power can be generated by building wind farms along Gulf of Suez and Red Sea costs. The total wind electricity generated by 2022 (3.53 GW) would represent 8.8% of the 40.2 GW total electric power expected to be installed at that time. Taking in consideration other renewable forms of energy (hydropower of 2.9 GW and solar of 1 GW), the renewable content at 2022 may reach 7.4 GW representing 18.4% of the total installed power. This contribution will add significantly to country’s energy sustainability.
REFERENCES
[1] Goujan A, Alkitkat H, Lutz W. and Prommer I.: Population and Human Capital Growth in Egypt Projections to 2051. Presented at the Workshop on Population, Human Capital and Water in Egypt, Cairo, March 2007.
[2] US Energy Information Administration: Egypt Energy Profile 1997-2007.
http://tonto.eia.doe.gov/country.
[3] Comsan, M.N.H.: Electricity Sector in Egypt, Presented at the ENPA Consultancy Meeting, May 2007.
[4] Global Winds Report, 2007.
[5] Iowa Energy Center: Wind Energy Manual, 2006.
[6] Layton, J.: How Wind Power Works. 2007. at http://science.howstuffworks.com/wind-power4.htm
[7] Thresher, R.W., Hock, S.M., Loose, R.R and Goldman, P.R.: Wind Technology Development: Large and Small Turbines. Presented at the POWER-GEN AMERICAS '94 Conference, Orlando, Florida, December 7-9, 1994.
[8] NREA Home Page. http://www.nrea.gov.eg/, 2006.
[9] Mahammad, F.A.: Financing Wind Park Projects – Experience from Egypt. (Private communication), 2007.
[10] Loy, D. Energy Policy Framework Conditions for Electricity Market and Renewable Energies. Country Analyses. Chapter Egypt GTZ, GmbH, 2007.
[11] Mortensen, N.G., Said, U.S. and Badger, J.: Wind Atlas for Egypt, 2006.
[12] Rahman, R.A.. Egypt’s New and Renewable Energy Activities and Plans, Cairo, 2007. [13] New and Renewable Energy Authority: Egypt: Large Scale Grid Connected Wind Farms on Suez Gulf, 2005.
[14] NREA: Gulf of Zeit Wind Farm, Zawya Projectsc, 2006,
www.zawya.com/projects/.