i
Evaluating the effectiveness of the business funding model in developing small, micro and medium sized enterprises (SMMEs) with particular reference to OR
Tambo District Municipality.
By
Bhasela Yalezo
Student number: 211282472
A dissertation submitted in partial fulfilment of the requirements for the award of the degree of MA Development Studies at the Nelson Mandela Metropolitan University.
April 2013
ii DECLARATION
I, Bhasela Yalezo, student number 211282472, hereby declare that the treatise/ dissertation/ thesis for Students qualification to be awarded is my own work and that it has not previously been submitted for assessment or completion of any postgraduate qualification to another University or for another qualification.
Bhasela Yalezo
Official use:
In accordance with Rule G4.6.3,
4.6.3 A treatise/dissertation/thesis must be accompanied by a written declaration on the part of the candidate to the effect that it is his/her own work and that it has not previously been submitted for assessment to another University or for another qualification. However, material from publications by the candidate may be embodied in a treatise/dissertation/thesis.
Signature: ___________________________________________________ Date: __________________________________________________________
iii Dedication
This piece of work is a dedication to my family, my two dearest sons, Legend and Manyano, to my late grandfather and to these women: my late grandmothers, my mother, and my former Standard 4 teacher, Mrs. N Mneno. May your souls rest in eternal peace. I love you.
iv Acknowledgements
I would like to express my sincere gratitude to my supervisor, Mr Clifford Mulenga, for his constructive guidance and worthy encouragement. His support exceeded the boundaries of being a supervisor to be a mentor and a role model.
Special gratitude goes to my family at large for the constant support they always provide to me.
A word of appreciation also goes to all my dear cousins, friends, colleagues, and class mates for their endless support.
Above all, I give praise to the all Mighty and Creator: “Lord, you have been our dwelling place in all generations.”
v Abstract
A great deal of taxpayers’ money has gone to a lot of SMME development initiatives. Despite this effort over the past 17 years, South Africa (SA) lags behind other developing countries, in promoting the growth and sustainability of SMMEs. The impact and achievements of government initiatives have fallen disappointingly short of aspiration (Business Development in South Africa. 2009. Occasional paper).
Aims and Objectives:
• To evaluate and reflect on the OR Tambo District Municipality SMME funding model and establish whether it has made the desired impact.
• Determine if funds that have been channelled by the SA government to SMMEs for business expansion, start-ups, grants, and special industry development have yielded quantifiable results and
• Assess the private funding institutions in assisting destitute entrepreneurs in the OR Tambo District municipality.
Research methodology: The study was conducted using qualitative research and a questionnaire was used as a data collection tool. The researcher was able to get valuable information on stakeholders in the SMME sector. The stakeholders (SMMEs and funders), formed the core research sample.
Results: findings suggest that the OR Tambo Municipality has a funding gap and the current funding model both from public and private funders is not effective in developing SMMEs in the municipality.
The overwhelming majority of SMMEs agreed that there is a funding gap between funders and enterprises that seek funding in the ORTDM. “Financing gap” terminology, Underhill Corporate Solutions (UCS) (2011:52) defines it as, ‘a sizeable share of economically significant SMEs cannot obtain financing from banks, capital markets or other finance suppliers.’ About 90% of the interviewed SMMEs agreed that there is huge funding gap and 10 % disputed this and said that there is no funding gap; rather, it’s a funding mismatch between the funders and SMMEs which needs to be tackled by all SMMEs stakeholders.
vi
The funding model needs to be revamped so it can also be accessible to start-ups, the unemployed, people with less business management experience and limited skills, and to all sectors of the economy. Various recommendations and suggestions for further research are made based on the research findings.
Conclusion: The study has shown that the current SMME funding model is not effective and does not assist in developing SMMEs in ORTDM. The research findings depict the funding plight of SMMEs in South Africa; the SMME plight in ORTDM is more real than imaginary.
70% of SMMEs expressed less confidence in government SMMEs agencies in terms of assistance. The bigger portion of SMMEs felt that the funds channelled to government agencies were not providing significant assistance in developing SMMEs in ORTDM.
Recommendations: The conclusive response from the sample, reflect structural challenges in the current funding model.
About 70% of funding institution`s officials said “yes”, the low yield on SMME growth is a matter of funding. The funds which were meant to fund SMMEs for one reason or the other do not reach SMMEs which are looking for funding. Hence the funds channelled in the sector in the last 17 years have not yielded the desired results. 40% interviewed government officials conceded that there is serious political meddling in funding SMMEs in the whole province and ORTDM could not be an exception to this rule.
80% of interviewed SMMEs in ORTDM said funding was their main problem, and the other 20 % indicated that their problem was not a matter of funding.
The public and the private sector must revise the current funding model or devise another funding model that will:
• bridge the existing current funding gap,
• distribute the SMME allocated budget and achieve maximum efficiency in budget allocation,
vii
Table of contents Page
Declaration ii
Dedication iii Acknowledgements iv Abstract v Table of contents vii
List of table’s xi List of figures xii List of Acronyms xiii
Chapter One: Introduction ... 1
1.1Introduction ... 1
1.2 Research Context: Background ... 2
1.3 Research Problem ... 2
1.3.1 Hypothesis: ... 3
1.4 Research aims and objectives ... 3
1.4.1 Primary objectives ... 3
1.4.2 Secondary objectives ... 3
1.5 Research questions ... 4
1.6 Significance of the study ... 4
viii
Chapter Two: Literature review ... 6
2.1 Introduction ... 6
2.2 SMMEs business funding Model ... 6
2.2.1SMME access to finance needs ... 7
2.3 SMME background in South Africa ... 8
2.4 GDP per province ... 10
2.5 SMMEs institutional framework ... 11
2.5.2 Department of Economic Development (DED) ... 12
2.5.2.1 Khula Finance Limited (www.khula.org.za) ... 13
2.5.2.2 Industrial Development Corporation (IDC) (www.idc.co.za) ... 13
2.5.3 South African Micro-finance Apex fund (SAMAF)... 14
2.5.3 Department of Science and Technology ... 14
2.5.5 Department of Agriculture ... 14
2.6 Private Funding Institutions ... 15
2.6.1 Family, friends and own capital ... 15
2.6.2 Micro finance ... 15
2.6.3 Commercial Banks ... 16
2.7 Gaps in the current funding/Financing model structure ... 17
2.7.1 Do we have a SMME funding gap in SA? ... 18
2.8 GDP Contribution of SMMEs ... 19
2.9. Conclusion of the chapter ... 20
2.9.1 The structural challenges in the current funding model ... 20
ix
2.9.3 Private institutions ... 21
2.9.4 SMMEs ... 21
Chapter Three: Research design and methodology ... 22
3.1 Introduction ... 22 3.2 Research Methodology: ... 22 3.3 Target Population: ... 23 3.3.1 Questionnaire Format ... 23 3.3.1.1 SMME Questionnaire ... 25 3.3.1.2 Funders’ Questionnaire ... 25 3.4 Data Analysis ... 26
3.5 Limitations of the study ... 26
3.6 Challenges in the research process ... 26
3.7 Ethical Considerations ... 27
3.8 Summary ... 28
Chapter Four: Findings/Interpretation of Data ... 29
4.1 Introduction ... 29
4.2 SMME Questionnaire ... 30
4.2.1 Demographic information ... 30
Years in business operations ... 33
x
4.3. Funders questionnaire: ... 43
Question 1: Institution assistance to SMMEs. ... 44
Question 3: Do you consider a guarantee and if yes from which institution? ... 45
Question 4: Turnaround time from start to finish ... 46
Question 5: Most assisted ... 46
Question 6: SMMEs assisted with funding: start-ups or existing institutions ... 47
Question 7 (public institutions): SMMEs complain that public institutions also use political connections and affiliations in granting funds to SMMEs. ... 48
Question 8: The funds channeled to SMMEs in the past 17 years have not yielded the expected return, is it a matter of funding or other issues ... 48
Question 9 (private institutions): Commercial banks stringent funding criteria ... 49
4.3 Conclusion ... 50
Chapter 5: Summary, conclusion and recommendations ... 51
5.1. Introduction ... 51
5.2. Summary and overview of the research ... 52
5.3. Short comings of the study and further research ... 53
5.4. Recommendations ... 54
5.5. Conclusion ... 56
xi
Tables Page
Table 2.1: SMME definition ... 9
Table 2.2: Active entities active per province ...Error! Bookmark not defined. Table 3.1 Sample population ...Error! Bookmark not defined. Table 3.2: Response Rate……….24
Table 4.1: Sample population ... 29
Table 4.2: Location ... 30
Table 4.3: Age ... 31
Table 4.4: Ethnicity ... 31
Table 4.5: Language ... 32
Table 4.6: Position in the business ... 32
Table 4.7: Highest qualifications ... 33
Table 4.8: Years in business operations ... 33
Table 4.9: People employed ... 35
Table 4.10: Business cycle ... 35
Table 4.11: Institutions information ... 39
Table 4.12: modification components ... 41
xii
Figures Page
Figure 2.1: GDP chart per province ...Error! Bookmark not defined.
Figure 4.1: Gender ... 31
Figure 4.2: SMME sector ... 34
Figure 4.3: Raising Start-up capital ... 36
Figure 4.4: Financial support. ... 36
Figure 4.5: Approached institutions ... 37
Figure 4.6: Approved Funding ... 38
Figure 4.7: Funding context ... 39
Figure 4.8: SMME funding efficacy... 40
Figure 4.9: Private Funders willingness ... 40
Figure 4.10: Funding Gap ... 42
Figure 4.10 Funding model problems ... 42
Figure 4.12: Funding assessment key points ... 45
Figure 4.13: Most Funded sectors ... 47
Figure 4.14: Assisted SMMEs ... 47
Figure 4.15: Political connections ... 48
Figure 4.16: Funding return ... 49
xiii List of Acronyms
GDP- Gross domestic Product SA- South Africa
IDP- Integrated Development Plan Government institutions
• NYDA- National Youth Development Agency • SEDA- Small Enterprise Development Agency • UYF- Umsobomvu Youth Fund
• ECDC- Eastern Cape Development Corporation • IDC- Industrial Development Corporation
• IDZ-Industrial development Zone • Khula Enterprise
• NEF- National Empowerment Fund
• ECSECC- Eastern Cape Socio Consultative Council • DBSA- Development Bank Of Southern Africa
Private Intuitions
• BP- Business Partners
• ABSA- Amalgamated Banks of South Africa • STD BANK- Standard Bank
• NEDBANK- Nederlandsche Bank • FNB- First National Bank
• MEEGBank
Municipalities
ORTDM- O.R Tambo District Municipality KSDM- Kings Sabatha Dalidyebo Municipality
1 Chapter One: Introduction
1.1 Introduction
According to Small Business Development in South Africa, August 2009: occasional paper, a great deal of taxpayers’ money has gone to a lot of small, micro and medium sized enterprise (SMME) development initiatives. Despite this effort over the past 17 years, South Africa (SA) lags behind other developing countries, particularly the Brazil, Russia India and China (BRICS) counterparts, in promoting the growth and sustainability of SMMEs. For 2008/2009 alone the adjusted appropriation for Small Enterprise Development Agency (SEDA) amounted to R400 million with an additional R38 million going to the Apex Fund and R70 million to Khula Finance. Furthermore, government-backed funding was provided to the small business sector by other agencies like the Industrial Development Corporation, and the Umsobomvu Youth Fund which was tasked with promoting entrepreneurship, job creation and skills development among young people (now absorbed into the National Youth Development Fund).
This study aims to evaluate and reflect on the South African SMME funding model and establish whether it has made the desired impact. The study seeks to evaluate if funds that have been channelled by the SA government to SMMEs for business expansion, start-ups, grants, and special industry development have yielded quantifiable results and also to assess if the private funding institutions are assisting destitute entrepreneurs in the OR Tambo District Municipality (ORTDM).
The ORTDM, Government departments, the Walter Sisulu University and the private funding institutions (BP, ABSA, Ned bank, Meeg Bank and Standard Bank) have not published any documents assessing and evaluating the SMMEs funding model in the district municipality. The former Transkei is also known for lagging behind in producing research reports in social sciences.
2 1.2 Research Context: Background
The study aims to reflect on the SMME funding model, and establish whether it has improved or assisted SMMEs in the mainly rural ORTDM. This municipality was initially formed by six local municipalities (Port St Johns, Ingquza Hill, Nyandeni, Mhlontlo, King Sabatha Dalindyebo and Mbizana Local Municipality), the Mbizana Local Municipality has been demarcated to Alfred Ndzo District Municipality. The socio-economic dynamics of the district municipality present dual realities where we find a number of growing enterprises and the development of SMMEs in King Sabatha Dalindyebo Municipality (KSDM) which is the capital town of the former Transkei and currently is the head office of both KSDM and the ORTDM.
The SA economic growth for 2011 was 3.1% according to Stats SA and the unemployment rate is between 24-26 %. The Eastern Cape is among the poorest provinces, and the number of the current SMMEs does very little to change the dynamics of the province. The province unemployment rate is 37% and for the ORTDM it is 41%. The poverty levels are estimated at 60%, just below the Alfred Ndzo District Municipality which is 63%. The ORTDM is the leading highly populated municipality and the worst performing in economic growth terms at 1% annually. The district municipality is largely driven by government, both in terms of employment and economic growth. Community service contributes 47% of Gross Domestic Product (GDP) followed by 20% finance and 18% trade. (Eastern Cape Socio Economic Council. 2012: Economic Snap Short-ORTDM).
1.3 Research Problem
The fundamental research issue is to assess if the:
• current funding model helps the sustainability of SMMEs in the ORTDM, • if the funds channelled by governments and private institutions in the form
of loans, grants, venture capital, etc. have reached the desired destination,
3
• funds are used efficiently, and the current funding model has any gaps, and,
• how such gaps can be closed for the benefit of SMMEs and aspiring entrepreneurs.
1.3.1 Hypothesis:
The study hypothesizes that:
• The most appropriate funding model must increase the number of SMMEs in the district municipality.
• The more funds channelled by government, the more return on investment in the form of economic growth.
1.4 Research aims and objectives
1.4.1 Primary objectives
• The objective of the study is to reflect on the current impact of the SMMEs government funding model through the Department of Trade and Industry (DTI) clusters or agencies.
• Identify if the funds channelled by government to boost and grow SMMEs make the desired impact.
1.4.2 Secondary objectives
• Ascertain the recipients of the funds channelled by government and the impact so far.
• Assess whether the private funding institutions assist the SMMEs Finance needs.
4 1.5 Research questions
• Why is the current business funding model not increasing SMMEs in the district municipality?
• Why are private funding institutions not attracted to funding SMMEs in the OR Tambo District Municipality?
• What are the practical means that can be employed to attract different forms of SMME funding models to the province and the municipality, for example, “venture capital, turn-key strategy funding and specialised funding models to suit the dynamics of the district municipality”.
1.6 Significance of the study
The purpose of the research is to evaluate and bring to the fore effectiveness of the funding model used by government through the Department of Trade and Industry (DTI) and its agencies in particular, and in passing also the private business funding institutions. Assess if the private funding institutions are making strides in developing the SMME’s sector in this municipality
1.7 Summary and overview
A great deal of taxpayers’ money has gone to a lot of SMME development initiatives. Despite this effort over the past 17 years, South Africa lags behind other developing countries, particularly the BRICS counter parts in promoting the growth and sustainability of SMMEs.
The SA economic growth for 2011 was 3.1% according to Stats SA and the unemployment rate is between 24-26 %, the ORTDM is the poorest province, and the number of new SMMEs do very little to change the dynamics of the province. The province unemployment rate is 37% and for the ORTDM it is 41% and poverty levels are estimated at 60% just below the Alfred Ndzo District Municipality which is 63%. The ORTDM is the leading highly populated municipality and the worst
5
performing in economic growth terms at 1% annually. The ORTDM employment and economic growth is largely driven by government ORTDM Integrated Development plan (IDP) 2010/2011.
The study seeks to evaluate if funds that have been channelled by SA government to SMMEs for business expansion, start-ups, grants, and special industry development have yielded quantifiable results.
The following chapter (chapter 2) presents the literature review. Chapter 3 provides detailed insight on how the study was done. The research results and findings are presented in Chapter 4. Chapter 5, presents the discussion of findings, draws conclusions and makes recommendations.
This chapter has presented the background to the research study, the research problem, the aims and objectives of the study, the research questions and the significance of the study.
6 Chapter Two: Literature review
2.1 Introduction
This chapterdetails the literature review, in the form of: • SMMEs business funding Model,
• SMME background, • Institutional frame work, • Private funding institutions, • GDP per province,
• SMME GDP contribution,
• Number of active SMME by province, • Gaps in the current funding model and
• Summary; concludes by indicating structural issues facing the SMME sector.
2.2 SMMEs business funding Model
The SMMEs business funding model refers to initiatives and programmes (loans, grants, subsidies for business plans, marketing, feasibility studies etc) used particularly by government agencies in supporting SMMEs financially and also private sector funders or financial institutions.
There`s strong consensus among analysts and academics that SMMEs create more employment opportunities compared to large businesses hence they are the engines of economic growth. SMMEs have a major role to play in the SA economy in terms of employment creation, income generation and output growth (Abor and Quarterly
7
2010:3). It is estimated that 91% of the formal business entities are SMMEs. They contribute between 52-57 % to GDP and provide 61% of employment. There is agreater need to invest in the SMME sector so as to create capacity for labour absorption and output growth, as well as to improve income generation and redistribution. The future of the South African economy and the creation of new employment of opportunities depend, to a large extent, upon developing more entrepreneurs and stimulating the growth of (SMMEs) Macleod, G. (1999).
2.2.1SMME access to finance needs
All over the world the SMMEs funding has been noted as a difficult issue and a challenge for SMMEs, particularly start-ups. This is a big problem in the sense that the South African government allocates funds through national and provincial institutions for the promotion and support of SMME’s development.
The current reality reflects that the government institutions are not succeeding in carrying this mandate boldly. For example, Msobomvu Youth Fund (which is now NYDA) has spent R100 million on a youth conference whose benefits are not easy to quantify. The perception of the opposition parties is that: the agency is working as a political wing to support the African National Congress (ANC) youth brigades. The CEO of the agency earns R1.8 million annually. This salary is equal to that of the Deputy President of the country. The Executive Chairman of the agency earns R790 000 per annum. The agency also employed 63 executive members who belong to the African National Congress Youth League (ANCYL). A salary amount of R11 million was paid to just 12 executive members of NYDA (Varsity Life. 2010).
ECDC is known in the Eastern Cape Province for its funding mood; they are not keen on funding SMMEs. Funds allocated to them for SMMEs have, in the past, been returned to the national government as they were not used, yet entrepreneurs in the province are desperate to get funding. The corporation is struggling to use its property for rentals and is grappling with debtors’ management and also mismanagement of its finances. They only managed to turn around the situation in the 2007/8 financial year.
8
The impact and achievements of government initiatives have fallen disappointingly short of aspiration. For informed observers this is simply a statement of the obvious (Business Development in South Africa, 2009. Occasional paper).
2.3 SMME background in South Africa
In 1995 the SA government started to craft a strategy for the SMME sector through a document termed the ‘White Paper’. SMMEs fall under the arm of the Department of Trade and Industry (DTI) whose objectives can be summarised as follows:
“With millions of South Africans unemployed and under-employed, the government has no option but to give its full attention to the task of job creation, and generating sustainable and equitable growth. Small, medium, and micro enterprises represent an important vehicle to address the challenges of job creation, economic growth and inequality in our country.
We believe that the real engine of sustainable and equitable growth in this country is the private sector. We are committed to doing all we can to help create an environment in which businesses can get on with their job. The White Paper was formulated to outline a national strategy for the development and promotion of small businesses in South Africa.” The DTI took the matter from conceptualisation and implementation of the framework and designing agencies and structures for broad implementation. The department is also mandated with the task to make industrialisation a success in SA.
The SMME sector in SA is dynamic because among the provinces some are doing well in the SMME status quo and some are literally struggling.
(Falkena et al., 2001:15) categorises and defines SMMEs in Table 2.1 below: in size, number of people employed, annual turnover and gross assets, excluding fixed property.
9 Table 2.1: SMME definition
Enterprise Size
Number of employees Annual turnover Gross Assets, excluding fixed property
Medium Fewer than 100 to 200 depending on industry Less than R 4 m to R 50 m depending on industry Less than R 2 m to R 18 m depending on industry
Small Fewer than 50 Less than R 2 m to R 4.5 m depending on industry
Less than R 150 000 to R 500 000 depending on industry
Very Small Fewer than 10 to 20 depending on industry Less than R 200 000 to R 500 000 depending on industry Less than R 150 000 to R 500 000 depending on industry
Micro Fewer than 5 Less than R 150 000 to R 500 000
depending on industry
Less than R 100 000
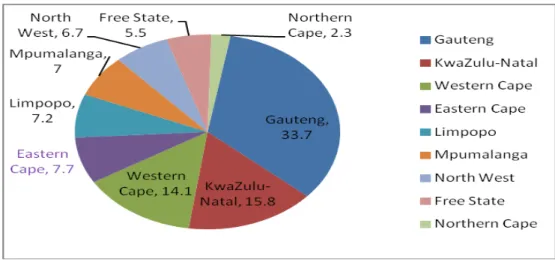
10 2.4 GDP per province
The Eastern Cape occupies only 4.9% of active business entities in the country behind Gauteng, Western Cape and KwaZulu-Natal. To catch up with the Western Cape and KwaZulu-Natal, the Eastern Cape will have to double its entities and GDP through significant sectors. The reality about EC is that it has never reached double digit GDP growth per year since the dawn of democracy. The average provincial economic growth from 1995-2011 has been less than 3% and the average EC contribution to national GDP over the past years on average has been 8%. The reality is that EC is among the worst performing provinces in the country, despite abundance of arable land and its renowned struggle icons. Figure 2.1 below shows the GDP per province and the performance of the Eastern Cape in 2010.
Figure 2.1: GDP chart per province
Constructed and adapted from statssa, 2010
The Eastern Cape is fourth in South Africa’s GDP contribution and, according to the Companies and Intellectual Property Commission (CIPC) statistics, the Eastern Cape is also fourth again on most active SMMEs in the country from the year 1800 to December 2011. This simply reflects that provinces with higher number of SMMEs make a bigger contribution to GDP. Table 2.2 below details active entities per province starting from the highest to the lowest.
11 Table 2.2: Active entities active per province
Province Active entities per province Percentage of active entities Gauteng 682,508 52.2 Western Cape 198,688 15.2 KwaZulu-Natal 173,875 13.3 Eastern Cape 63,618 4.9 Mpumalanga 59,311 4.5 Limpopo 53,273 4.1 Free State 41,784 3.2 North West 34,792 2.7 Northern Cape 10,665 0.8 Total 1,307,849 100.0
Constructed from: CIPC 2011
This is also the phenomenon with regard to municipalities with functioning industries: they are performing well in economic growth. The Nelson Mandela Metropolitan Municipality and the Buffalo City Municipality are examples of municipalities that are performing well because of the industrial areas they have. The municipalities in rural towns, particularly in the former Transkei, lag behind: the high poverty levels, low GDP growth rate, high crime rate, high illiteracy rate, low life expectancy rate are the most eminent and evident factors in ORTDM (ECCSEC, 2010. Economic indicators).
2.5 SMMEs institutional framework
The government`s main agencies and funds are distributed across mainly five different departments (UCS.2011:27):
12 2.5.1 Department of Trade and Industry (DTI)
SMMEs fall under the DTI and are categorised under two of the department`s units: Enterprise Organisation and the Empowerment and Enterprise Development division. The entities are:
a) Small Enterprise Development Agency (SEDA).
This agency was formed in 2006 as a result of a merger between Ntsika Enterprise Promotion Agency, National Manufacturing Advisory Centre (NAMAC) and the Community Public Private Partnership Programme (CPPP). The Godisa and Technology Programmes were integrated in 2006, becoming SEDA Technology Programme (STP)
b) National Empowerment Fund (NEF)
This fund was formed in 1998 and started operations in 2004. The NEF aims to fund black-owned businesses and empowers both big and small businesses. Between 2003 and 31 March 2010, the fund made disbursements of over R15 billion.
c) National Small Business Advisory Council (NSBAC)
The NSBAC was launched in 2006 and it reports to the DTI minister. The council is made up of eight members and serves to advise the minister on ways to boost support to small businesses. The council collapsed in 1998 amid allegations of mismanagement.
2.5.2 Department of Economic Development (DED)
This department was set up in 2009 to co-ordinate the South African Government`s economic policy. The department oversees various entities, including the following:
13
2.5.2.1 Khula Finance Limited (www.khula.org.za)
Khula is a wholesale finance institution which operates across the public and private sectors through a network of channels to supply funding to small businesses. It was formed in 1996 to help fund small businesses. Khula operates through financial intermediaries across the country and has strong links with commercial banks, retail financial institutions and specialist funds and joint ventures in which Khula itself is a participant. Its primary aim is to bridge the “funding gap” in the SME market not addressed by commercial financial institutions. The funding structure has four components:
• Funding for retail financial institutions (RFI) • Credit guarantee scheme
• Equity Capital, and
• Gearing capital for public and private sector funds targeting small enterprises in specific sectors.
2.5.2.2 Industrial Development Corporation (IDC) (www.idc.co.za)
This corporation was inherited from the apartheid regime and was formed in 1940. The funding of small businesses forms a large part of its mandate. Its budget allocation is in billions. There are also other provincial development corporations which are state owned through provincial departments and municipalities, but they are still funded by the state. The (Eastern Cape Development Cooperation and Buffalo Metropolitan and Nelson Mandela Metropolitan owns the two Industrial Development Zones (East London and Coega) respectively.
14
2.5.3 South African Micro-finance Apex fund (SAMAF)
The SAMAF was established to provide access to micro-loans and support to the social capital mobilisation. It’s a wholesale funding institution tasked to facilitate the provision of affordable access to finance by small and micro survivalist businesses for the purpose of growing their income and asset base. Its primary purpose is to reduce poverty and unemployment and also to extend financial services to reach deeper and broader into the rural and peri-urban areas.
2.5.3 Department of Science and Technology
The Technology Innovation Agency (TIA) is a new umbrella body set up in 2009 and launched in 2010 for funding innovation. It includes the Tshumisano Trust which housed the technology transfer stations, the innovation fund, and the Council for Scientific and Industrial Research (CSIR) `s advanced Manufacturing Technology Strategy.
2.5.4 The Presidency
The National Youth Development Agency (NYDA) was formed after a merger between the National Youth Commission and the Umsobomvu Youth Fund. Its mandate is to assist the youth with career skills and to help start their own businesses. The NYDA funds training and provides loans. The agency disbursed 7,500 micro loans to the value of R23 million and a further R4 million in loans in the 2009/2010 financial year, in the same year NYDA wasted R100 million on a youth conference.
2.5.5 Department of Agriculture
The Micro Agricultural Financial Institute of South Africa (MAFISA) was established to improve the ability to run existing agricultural businesses, and to start new ones and be able to develop these into fully commercial operations. The agency propels
15
and facilitates the development of financial services intended to uplift very small and micro level farm workers, farm tenants, small holders, landless emerging farmers and processes etc.
“Through these departments/agencies, numerous programmes for funding or
otherwise have been implemented. This set-up has however proved problematic for strategic coordination purposes as programmes tend to be implemented in isolation of each other, and risks the effectives of funding programmes to small business, a
problem that has been noted and identified by a number of commentators” including
the DTI 2008, SBP 2009a, TIMS, 2011 and (Mutezo 2010, p. 37)
The underlying conclusion of the government’s institutional framework is that it shows very poor results and seemingly is not taking us to the desired state of SMME development.
2.6 Private Funding Institutions
Numerous private organizations, some operating as NGOs using donor funding, have been formed to offer assistance to small businesses, The Get Ahead Foundation and Liberty Foundation are some examples Macleod, G. (1999). There are a number of private funding options available and used by SMMEs in South Africa:
2.6.1 Family, friends and own capital
A lot SMMEs use their own capital from savings, family and friends.
2.6.2 Micro finance
This includes but not limited to: • Matshonisa (Loan sharks)
16
• Private Banks/ Institutions other than non- commercial banks.
SMMEs get support also from other companies like Business Partners, SANLAM, Old Mutual, SAB, etc.
2.6.3 Commercial Banks
These banks are by far the most frequently used source of short-term and long-term finance by entrepreneurs when collateral is available. In South Africa there are four major banks:
• Standard Bank • ABSA
• Ned bank
• First National Bank
These banks provide funding to SMMEs in the form of loans, overdrafts and mortgage loans. The banks provide debt financing and they normally require collateral for loans, which is normally in the form of land, equipment or the building of the venture, personal assets (car, land, stock, shares, bonds, policies, etc) Peters.( 2000, p. 363).
According to Mutezo (2005, p.36), it can be safely concluded that banks restrict access to finance for SMMEs due to the nature and extent of the risks to the bank. Oxford et al. (2003, p. 46) concede that it’s reasonable and desirable for banks to channel funds primary towards applications with greater probabilities of success. Banks are risk-conservative to small businesses, especially those with no bank records, no collateral and little business experience. “As a result S.A cannot rely on the banking sector alone, to solve the problem of finance for entrepreneurs” (Foxcroft
et al. 2002, p. 16). A further problem in SA is that micro-finance is often used for
consumption rather than production. The efforts to increase access to finance among small businesses have only made a difference to a small minority of disadvantaged entrepreneurs Rwigema and Venter (2004, p. 415). There are banks like Investec
17
which provide finance and banking services to SMMEs, but which have no branches in places like the former Transkei. Despite the numerous of many government agencies, sub agencies and private institutions, finance for SMMEs is still an issue in our country and much more in the Eastern Cape, particularly in the former Transkei.
2.7 Gaps in the current funding/Financing model structure
According to the World Bank (2010), financial inclusion-providing access to a broad range of financial services for all has gained prominence in the past few years as a policy objective for national policy makers, multilateral institutions and others in the development field. Furthermore the DTI ten year review (2004) alluded to this view: “There is possibly no other dimension of the government`s small enterprise support strategy that has over the past decade received as much attention (and criticism) as the access to finance issue.”
Researchers, who have analysed the reasons for access-to-finance difficulties, say that the lack of access to finance is the biggest single obstacle along the start-up and expansion paths of small enterprises Naude and Havega (2004, p.15) .
The role of South Africa`s state-owned Development Finance Institutions (DFI) in building a democratic developmental state Development Bank of South Africa (DBSA) 2010. Traditionally, DFIs provide development finance to address market failures and so complements both government resources and market financing. Naude and Havega (2004, p.15) in their research concluded that SMMEs struggle to get finance from banks due to excessive red tape and the administration burden. Mutezo (2010, p. 29) in her dissertation made this observation, “Financial institutions rarely finance start-up businesses, are bureaucratic, without any knowledge or understanding of entrepreneurs, not willing to assist and weary in providing finance to people who do not have a business record.” What does the term “financing gap” mean? Although there is no unique answer or academic definition of the “financing gap” terminology, UCS (2011, p 52) defines it as, ‘a sizeable share of economically significant SMEs cannot obtain financing from banks, capital markets
18
or other finance suppliers.’ Burns (2007, p. 366) defines it “as the unwillingness on the part of suppliers of finance to supply it on terms and conditions that owner-managers need ”He further states that economists prefer to use the term “market failure” or “credit rationing” instead of the financing gap. The reality in SA is that we have financiers with large sums of money who can fund SMMEs and on the other side we have SMMEs who are desperately looking for funding to kick start their businesses and they are not getting funding.
2.7.1 Do we have a SMME funding gap in SA?
It is very obvious that we do have a funding gap in our country. Mutezo (2010, p. 75) states that SMMEs, experts and researchers concede that access to finance is an obstacle. Trade and Industry Policy Strategies (2002, p. 69), states that despite having a range of institutions providing long-term capital, short-term capital, equity and debt, there`s a gap. Surprising even more in SA is the “fragmentation” between formal and informal capital markets, which operate under very different priorities and constraints and with few linkages with each other.
Commercial Banks are more willing to provide banking services to SMMEs as there`s no risk than giving finance. Providing finance to SMMEs is not a bank’s primary objective. The commercial banks are more willing to provide finance to existing SMMEs with a banking record or credit worthiness compared to start-ups with none of these components.
Government institutions, on the other hand, are so many and the primary or common focus for them is to provide finance, stimulate growth and support SMMEs. The success rate of these government institutions is not so evident, especially if one reflects on the 17 years of the post South African liberation era. The Eastern Cape SMMEs are not developing at high speed and they remain far less than other provinces like Gauteng, KZN and Western Cape and as a result the province GDP has never been above 10%. What increases the gap more and more is that among these government institutions (departments, municipalities, and SMMEs agencies) there is
19
no cohesion and strong linkages. Between the private and the public sector in general there is a strong distrust and, as a result, everyone does ‘his own thing.’ To be more specific and realistic the public sector is supposed to be taking the lead as we are a developing country.
Krog (2007:93) concluded in her dissertation study that various financial institutions mostly finance small and medium enterprises; however, there is a definite gap in the financial market for the financing of small and micro enterprises. She furthers states that the gap is also exacerbated by the fact that most small and micro entrepreneurs do not have any form of security (bonds or savings) which are required for credit application. The gap may be closed through increased marketing around government initiatives available to SMMEs, such as grants and funds, as well as availability of training and mentoring services to new owners.
Finding finance, or gaining financial support for any new venture, is one of the difficulties experienced by entrepreneurs Nieman et al (2003: 147).
2.8 GDP Contribution of SMMEs
Will more funding lead to an increase in employment and SMMEs GDP contributions?
The logical response to this question is that, the more we have SMMEs that are operating, functional and profitable the more they will contribute to GDP growth and employment. Abor and Quarterly (2010:3) estimates that 91% of the formal business entities are SMMEs and they also contribute between 52-57 % to GDP and provide 61% of employment. The reason for the existence of SMMEs is the significant GDP contribution and employment contribution Nieman (2006 :12).
If more funding and structural matters affecting SMMEs are addressed, the GDP contribution of SMMEs will increase and more people will be employed.
20
A number of academics and researchers do agree that the SMME sector plays a pivotal role in employment and GDP contribution. “All the modern schools of political thought, from Karl Marx and Vladimir Lenin on the left to Friedrich Hayek and Milton Friedman on the right, agree on at least one thing: private entrepreneurship is the driver of modern economic development” Mbeki (2009 p. 11).
“The creation of 15-million jobs was very possible, if the government made radical policy changes to focus on small businesses as employment creators. Between 1985 and 2005, 90% of all new jobs in South Africa were created by small, medium and micro enterprises (SMMEs), according to a report by Trade and Industrial Policy Strategies for the Department of Trade and Industry, and the sector is widely regarded as being the largest creator of jobs within economies”Business day .2012.
2.9. Conclusion of the chapter
The chapter is concluded by highlighting a number of challenges facing SMMEs:
2.9.1 The structural challenges in the current funding model
These challenges can simply be simplified in three cluster dimensions: public, private and SMMEs). The private and SMMEs are also highlighted in the current problem because they are primary key stakeholders. However, the fundamental question of the study is to evaluate if the funds channelled by the government have made the desired impact and if the model used by government is working for the development of SMMEs in ORTDM.
2.9.2 Public sector institutions
General matters around the public sector institutions include but are not limited to: • poor efficiency from the government departments and particularly the
21
• strong lack of trust between the private sector and public sector, as a result of which there is not much cooperation with regard to SMME`s finance development needs,
• strong political bureaucracy within government agencies, and • poor skills within the SMME`s development agencies.
2.9.3 Private institutions
• Long and discouraging loan processes • Demarcation of the institutions
• Exorbitant interest repayments • Collateral requirements
2.9.4 SMMEs • Poor skills
• Education levels and business experience • Type or sector of the enterprise.
22
Chapter Three: Research design and methodology
3.1 Introduction
This chapter details the research methodology, target population, questionnaire format, data analysis, limitations of the study, challenges in the research process and ethical considerations.
3.2 Research Methodology:
According to the University of the Western Cape Research Guide: 2012, qualitative methodology refers to research which produces descriptive data through the written and/or spoken word. In qualitative research, methods such as case studies, in-depth interviews, questionnaires, participant observation and perusal of personal documents are used to obtain primary data.
According to May (2003: 199) qualitative methodology affords a means of providing distinct data and qualitative evaluation of theorising problems and approaches.
Qualitative research as a field of inquiry in its own right, it cuts across disciplines, fields, and subject matter. Qualitative research involves the studied use and collection of a variety of empirical materials - case study, personal experience, introspective, life story, interview, and observational, historical, interactional, and visual texts - that describe routine and problematic moments and meanings in individuals` lives Denzin & Lincon (1998: 3).
A questionnaire was used as the research tool. The questionnaire is effective when there`s a need to quickly and/or easily get lots of information from people in a non-threatening way. It was considered the appropriate tool and was used to answer the research questions.
Wild & Diggers (2011: 55) defines a questionnaire as “A set of questions designed to generate the data necessary to accomplish a research project objective”.
23 3.3 Target Population:
The research target population was consolidated into two main stakeholders. It is mainly SMMEs and funders (private and government).
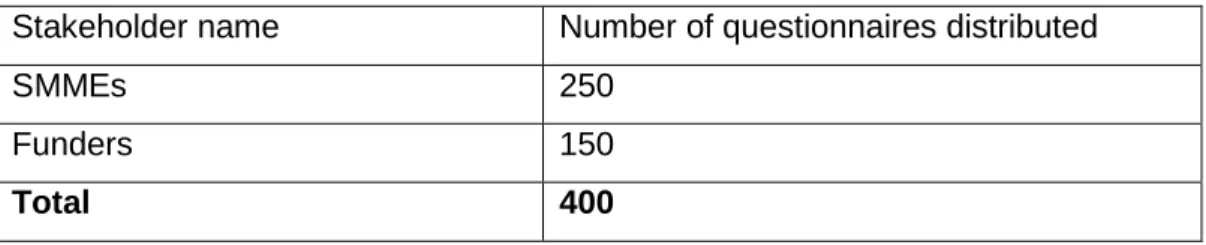
250 questionnaires were sent to SMMEs and funders were given 150 questionnaires. The figures are detailed in table 3.1 below.
Table 3.1: Sample population
Stakeholder name Number of questionnaires distributed
SMMEs 250
Funders 150
Total 400
Format adapted: Mutezo (2005:63)
3.3.1 Questionnaire Format
A questionnaire was sent out to funders and SMMEs within the OR Tambo District Municipality, per local municipality (King Sabatha Dalidyebo, Mhlontlo, Port St Johns, Ingquza Hill and Nyadeni). The questionnaires were distributed with a detailed covering letter (Appendix attached). The components of the letter details to the respondent:
• the study objective
• instructions how to fill in the questionnaire • confidentiality assurance
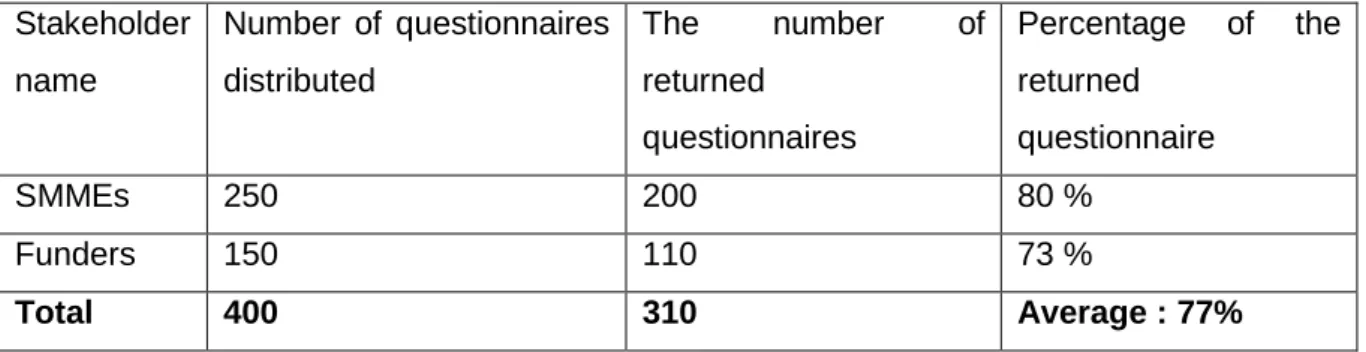
24 The questionnaire distribution
The average percentage response from the two main stake holders was 80% and 73% respectively. A total of 400 questionnaires were sent to; 250 SMMEs and 150 funders. On the SMMEs’ side 200 questionnaires were returned out of 250 and on the funders’ side 110 were returned out of 150. Table 3.2 details the stakeholders’ name, number of distributed questionnaires distributed the number of returned questionnaires and the percentage of the returned questionnaire.
Table 3.2: Response Rate
Format adapted: Mutezo (2005:63)
Both questionnaires are attached as an appendix.
The questionnaire is in two fold for Funders and SMMEs and both questionnaires have two phases (A and B).
Stakeholder name Number of questionnaires distributed The number of returned questionnaires Percentage of the returned questionnaire SMMEs 250 200 80 % Funders 150 110 73 % Total 400 310 Average : 77%
25 3.3.1.1 SMME Questionnaire
Phase A: Demographic section: the questions are closed ended as the respondents are simply requested to fill in the following:
• Names, • gender, • age,
• address or contact details, • email address,
• qualifications,
• operational life of the business, and • position in the business.
Phase B: It runs from question 5 to 19. The questions are open ended.
The questionnaires were collected via e-mail, faxes and some were collected in person.
3.3.1.2 Funders’ Questionnaire
Phase A: Demographic section: the questions are closed ended as the respondents are simply requested to fill in the following:
• Names, • gender,
• institution name, • position,
• address or contact details, and • email address.
26
Phase B: this phase runs from question 1 to 9, although question 7 becomes specific to public funders and question 9 becomes specific to commercial banks. The questions are closed and open ended.
3.4 Data Analysis
The data was listed according to question responses; conclusions were then drawn and analysed accordingly in a quantitave way, with graphs and tables.
3.5 Limitations of the study
The study focuses on the OR Tambo District Municipality (ORTDM), which is one of the Eastern Cape district municipalities and the findings cannot be generalised as a phenomenon in the Eastern Cape municipalities. Further research needs to be done to evaluate the effectiveness of the funding model in the whole province, including its rural areas.
The research was done and limited to the towns within the local municipalities of ORTDM. It excluded most of the population which is based in rural areas. The limitations of the study were mainly because of geographical dynamics, time and financial constraints.
3.6 Challenges in the research process
The research question involved two stakeholders, SMMEs and funders.
SMMEs were more willing to respond and participate and their challenges were very minimal.
Funders: Under the banner of funders, they were separated into two components, private funders and public funders.
27
Private funders included all funding sources excluding all government agencies and municipalities. Once again this category was willing to support and give assistance and their challenges were very minimal. They pointed out the fundamental issue of loan repayment, risk involved in borrowing and the protection of shareholders’ wealth.
Public funders included all the government agencies, departments and municipalities. Civil servants were very reluctant to give information and assistance, particularly aspects which are supposed to be made known to the public. The reasons for this, point to inefficiency and lack of progress in the public view and expectations. For example:
• Funds returned to the treasury in the past 10 years, which were meant for SMMEs.
• GDP contribution of SMMEs to the Eastern Cape per municipality and sector. • Lack of available researched and published articles or journals in the
province, more specifically in the former Transkei. Getting an Integrated Development Plan from these municipalities is a mammoth task and information available on such documentation is not regularly updated or is rather outdated to be specific.
3.7 Ethical Considerations
In the questionnaire which is attached as an appendix, respondents were given strong assurance that the research findings will be kept strictly confidential and in accordance with the ethical research guidelines and standards.
The following fundamentals were adhered to:
• protecting the identity and fundamental interests of research participants, and • keeping the responses of the target population with the utmost confidentiality. The participants were given a questionnaire with a covering letter which detailed the research purpose, objectives and their role in the whole research process.
28
3.8 Summary
The research target population was consolidated into two main stakeholders. It is mainly SMMEs and funders (private and government). Questionnaires were sent to SMMEs and funders. The questionnaire was also used as a data collection tool. The research results findings are presented in Chapter 4.
29 Chapter Four: Findings/Interpretation of Data
4.1 Introduction
This chapter presents qualitative findings from the questionnaire responses that were sent to the sample population. It is composed of two segments and pivotal stakeholders, SMMEs and funders, in the OR Tambo District Municipality.
Table 4.1 details the stakeholder name, number of questionnaires distributed, number of returned questionnaires and response percentage.
Table 4.1: Sample table
Format adapted: Mutezo (2005:63)
The response rate was very good on both stakeholders (SMMEs and Funders) 80% and 73% respectively, making an average of 77%. A total of 400 questionnaires were sent out to SMMEs and funders: 250 and 150 respectively. On the SMME’s side 200 questionnaires were returned out of 250 and on the funders’ side 110 were returned out of 150.
The SMMEs and Funders questionnaire distribution and collection was done according to local municipalities within the OR Tambo District Municipality. The King Sabata Dalindyebo Municipality had the highest number of respondents across the board, followed by Mhlontlo, Ingquza, Nyandeni and Port St John’s respectively. The analysis is categorised into two response components from the SMME’s and the funder’s questionnaires. Questionnaires have two sections (phase1 and phase 2). Phase 1 is mainly focused on demographic information and phase 2 is probing funding related questions from SMMEs and funders.
Stakeholder name
Number of questionnaires distributed
The number of returned questionnaires Percentage of the returned questionnaire SMMEs 250 200 80 % Funders 150 110 73 % Total 400 310 Average : 77%
30 4.2 SMME Questionnaire
Phase 1: this phase gives details of demographic information about SMMEs who responded (location/address, gender, age, and ethnicity, position in the business, qualifications and years in the business operation).
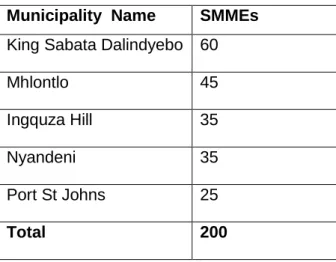
4.2.1 Demographic information Location
The SMME responses are detailed below per local municipality within ORTDM. The biggest pool of respondents is from King Sabata Dalindyebo (60), followed by Mhlontlo (45), Ingquza and Nyandeni both with (35) and, lastly, Port St John’s with (25) responses. Table 4.2 below presents that information per local municipality. Table 4.2: Location
Municipality Name SMMEs King Sabata Dalindyebo 60
Mhlontlo 45 Ingquza Hill 35 Nyandeni 35 Port St Johns 25 Total 200 Gender
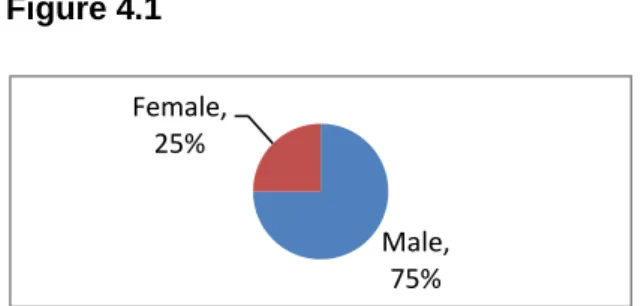
The greater portions of SMMEs in the ORDTM according to the study are owned by males (75 %) while females own 25%. Depicted below in figure 4.1
31 Figure 4.1
Age
The general age of SMME owners is categorized below in table 4.3, indicating that the greatest percentage of age is 41-50, followed by 51-60, 61-85, 31-40 and lastly 20-30 respectively. Table 4.3: Age Age Percentage 20-30 5% 31-40 15% 41-50 35% 51-60 25% 61-85 20% Ethnicity
Table 4.4 displays the percentages of respondents’ in ethnic grouping. Table 4.4: Ethnicity African 65 % Caucasian 25 % Coloured 10% Asians 5% Male, 75% Female, 25%
32 Language
The general language of the SMME respondents in ORTDM is Xhosa, followed by English, Afrikaans speaking people and other languages respectively (Figure 4.5; language). Table 4.5: Language Xhosa 60 % English 20 % Afrikaans 10% Other languages 10 %
Position in the business
45% of respondents own and manage their SMMEs, 30% are owners, 20% are employed as managers and the other 5% are senior and team leaders (tabulated in table 4.6).
Table 4.6: Position in the business
Owner 30 %
Manager 20 %
Both 45 %
Other (Specify) 5 %
Highest Qualification
A number of the SMMEs interviewed do have a strong academic background:
40% of them have a Bachelor’s degree while most of them are in legal and engineering companies, events management and other professional, service/business related enterprises.
25% have Diplomas or Certificates; most of them own engineering, events management or services/business related enterprises.
33
15% have a Master’s Degree: the biggest proportions of them are in business and professional services.
10% have Matric or less and a big chunk of this category own beauty salons.
5% have a Doctorate qualification. A high number of people in this category include medical doctors and professional consultants. Table 4.7 below tabulates and present percentages.
Table 4.7: Highest qualifications
Matric/Grade 12 or less: 10 % Certificate/Diploma 25 % Bachelor`s Degree 40 % Master`s Degree 15 % Doctorate 5 % Other: specify 0 %
Years in business operations
5-10 years business operations 50%, followed by 3-5 years at 25%, 0-2 years at 15% and the last portion of 10 + years at 10%. Table 4.8 below tabulates these figures and percentages.
Table 4.8: Years in business operations
0-2 15%
3-5 25%
5-10 50%
34 4.2.2. Phase 2
This phase provides the content and substance of SMME responses; it starts from question 5 and ends with question 18. It reflects the business sector, and describes how the people in question financed their businesses, the obstacles they encountered in accessing funding, and their opinions about funding institutions.
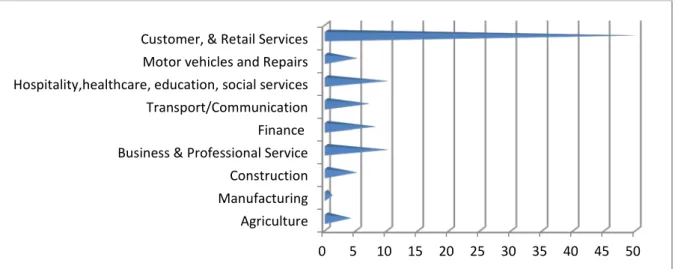
Question 5: SMME classification per economic sector
Retail is the fastest growing SMME sector and is also the engine of the ORTDM. Customer and Retail Services are at 50% followed by Hospitality, Healthcare, Business and Professional services are both at 10%. Finance, Transport/Communication is noted to be slightly below 10%. The Construction Industry and Motor Vehicles and Repairs are at 5%. The sectors struggling most according to the information received while doing the research include Agriculture and Manufacturing, 4% and 1 % respectively. In ORTDM there is no manufacturing industry as such. The little manufacturing that is happening is mainly bricks building. Figure 4.2 below depicts the SMME sector in graph scale.
Figure 4.2: SMME sector
0 5 10 15 20 25 30 35 40 45 50
Agriculture Manufacturing Construction Business & Professional Service Finance Transport/Communication Hospitality,healthcare, education, social services Motor vehicles and Repairs Customer, & Retail Services
35 Question 6: People Employed
On the research conducted: employment contribution by very small business contributed to 35%, by micro enterprise 30%, small enterprise 25% and medium enterprises contribute 10%. None of the large enterprises interviewed employed above 200 people in the ORDTM. The figures are stipulated in table 4.9 below.
Table 4.9: People employed
A micro enterprise: < 5 people 30 % A very Small business: < 6-20 people 35 % A Small Enterprise: < 20-50 people 25 % A medium Enterprise: < 50-200 people 10 % A large Enterprise: > 200 people 0%
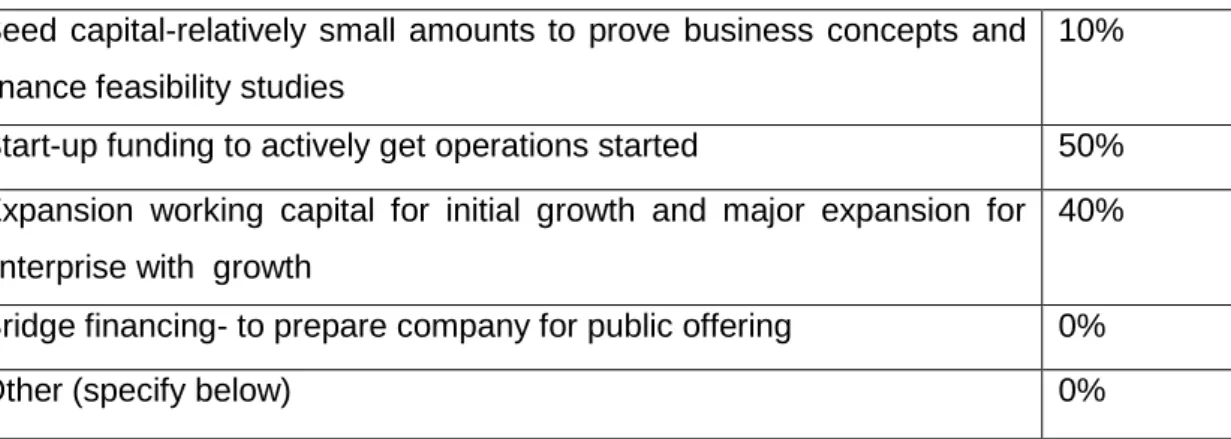
Question 7: Business life cycle stage.
The life cycle stage of interviewed SMMEs (detailed in Table 4.10):
50% were start-ups, 40% existing enterprises and 10% seed capital respectively.
Table 4.10: Business cycle
Seed capital-relatively small amounts to prove business concepts and finance feasibility studies
10%
Start-up funding to actively get operations started 50% Expansion working capital for initial growth and major expansion for enterprise with growth
40%
Bridge financing- to prepare company for public offering 0%
36 Question 8: Raising start-up capital
The 85% of interviewed SMMEs in ORTDM used their own capital to fund their start-up businesses.
The other 15 % raised capital from family and friends. These responses pose a question as to the role being played by government and commercial banks in the funding of SMMEs, especially with regard to start-ups. These percentages are graphically depicted in figure 4.3 below.
Figure 4.3: Raising Start-up capital
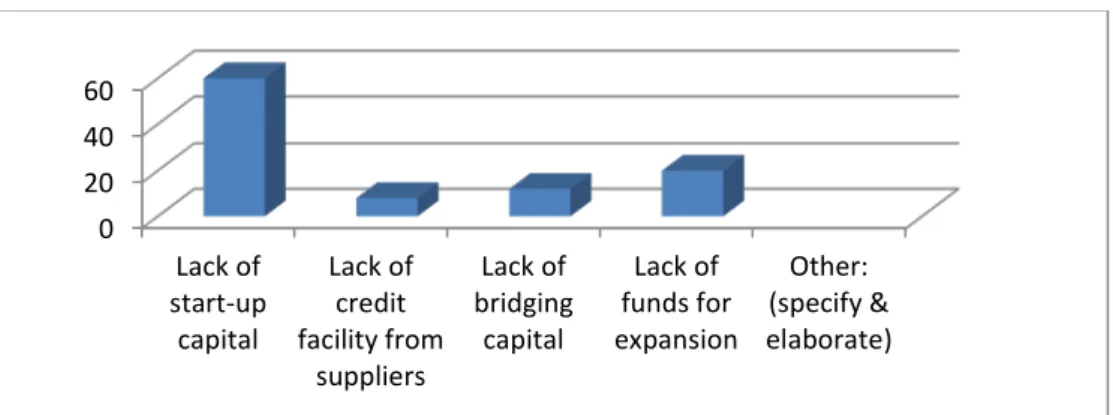
Question 9: Experienced financial support problems
60% of SMMEs indicated lack of start-up capital as the biggest problem. For existing SMMEs, getting expansion funds is lengthy and difficult process. 20% of existing SMMEs expressed this view. Figure 4.4 shows the percentages in graphical scale. Figure 4.4: Financial support.
0 10 20 30 40 50 60 70 80 90
Family and Friends Own Capital Commercial Bank (State name) Government Agency/department (state name) Other: (state & elaborate)
0 20 40 60 Lack of start-up capital Lack of credit facility from suppliers Lack of bridging capital Lack of funds for expansion Other: (specify & elaborate)
37
12% of SMMEs indicated that it was difficult to get bridging finance. Even the surety given by Khula is not always within reach since the institution is situated in East London.
8% of SMMEs said lack of credit facility from their suppliers was a challenge. Many SMMEs (subcontractors) particularly in the construction industry request credit assistance from big contractors or companies that have won tenders. General retail stores also request credit facilities from their suppliers and they confirmed that it is not an easy process.
Question 10: Approached institutions for financial assistance
60% of SMMEs approached government agencies (Seda, ECDC and NYDA) for financial assistance. This displays enormous confidence people have in these agencies. They approached these agencies because they felt that it was within their mandate to help SMMEs financially and otherwise.
Other institutions approached are spread among private institutions (commercial banks, business partners and Khula, 30%) and 10% approached micro lenders, family and friends as a form of business funding methodology. Figure 4.5 below shows approached institutions in a scale.
Figure 4.5: Approached institutions
0 10 20 30 40 50 60
38
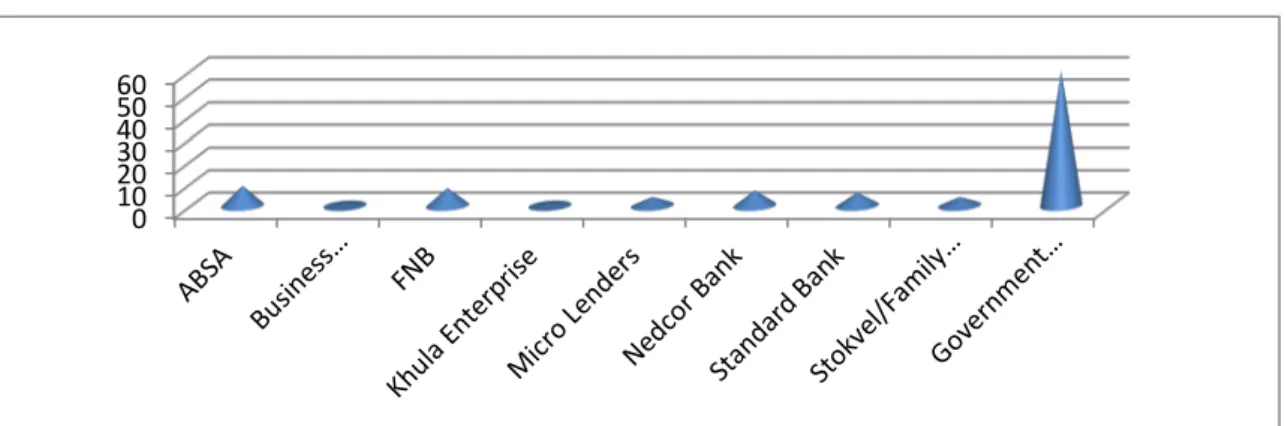
Question 11: Institutions that approved funding application
The conundrum is on funding approvals. 60% of SMMEs ended up using their own capital. The biggest proportion of SMMEs in OTRDM used their savings to start-up their businesses. Figure 4.6 give detailed graphical explanation.
The other 40% is divided among other funding stakeholders. The big four banks approved 25% of the interviewed SMMEs. A surprising thing is that the business loans were declined; however, when these applicants changed their applications into personal loans, they got the funding and then used it as start-up capital.
8% of micro funders include, to a large extent, Capitec Bank and other small financers. They do not lend to businesses but lend to individuals only.
5% of respondents used funds from their stockvels/ Imigalelo family and friends. This reflects that people rely on their families and friends to raise capital for their businesses and the model is working.
The 2% funded by ECDC indicated they had political links and were able to get funding. Also it was observed that these were existing enterprises.
Figure 4.6: Approved Funding
0 10 20 30 40 50 60 ABSA Business Partners (BP) FNB Khula Enterprise Micro Lenders Nedcor Bank Standard Bank Government Agencies (ECDC) Stokvel/Family & Friends Other : own savings
39
Question 12: Information about these institutions?
45% of the SMMEs heard about the funding institutions on television, 35% over the radio, and 10% from government departments and agencies. Referrals by friends and relatives and other print media scored 5% respectively. Explanation and percentages tabulated in table 4.11.
Table 4.11: Institutions information
Referrals by friends and relatives 5%
Over the radio 35%
Television advertisement 45%
From government departments and agencies 10%
Other : specify (print media) 5%
Question 13: the extent to which private and public institutions’ funding reaches the destitute SMMEs
A total of 90 % of the SMMEs believed that the SMMEs’ funding budget does not reach the destitute SMMEs. If it did reach them, they would have been able to secure funding for start-ups and expansion. Figure 4.7 explains the two views.
Whereas 10% believed the funding budget reached the desired SMMEs. Figure 4.7: Funding context
Start-ups, 15% Existing SMMEs, 85% Start-ups Existing SMMEs
40
Question 14: the extent to which funds channelled through different governmental SMME agencies significantly assist SMMEs development in ORTDM
70% of SMMEs expressed less confidence in government SMMEs’ agencies in terms of assistance. The bigger portion of SMMEs felt that the funds channelled to government agencies were not providing significant assistance in developing SMMEs in ORTDM.
On the contrary 30% of interviewed SMMEs were happy with the role and assistance of government SMME agencies in the ORTDM. Figure 4.8 below details two different views of SMMEs in OR Tambo.
Figure 4.8: SMME funding efficacy
Question 15: Private institutions’ willingness to assist in SMME funding Figure 4.9: Private Funders lack of willingness
Figure 4.9 above explains the willingness of Private funders in funding SMMEs in the ORTDM. 0% 20% 40% 60% Political meddling No Political meddling Existing SMMEs, 30% Start-ups, 70%
41
70% of SMMEs felt that the Private sector was not really providing the necessary support in SMME funding, and this view was captured particularly from start-ups responses.
The 30% response was captured from existing SMMEs which felt positive and answered yes to willingness of SMME funding by private institutions.
Question 16: Aspects that need modification in the funding process of SMMEs Table 4.12 below detail aspects SMMEs strongly felt needed modification.
The collateral issue was the main problem as indicated by 55% of SMMEs. This is especially demanded by banks.
Bad credit record criteria scored 20%. It is seen as a serious obstacle to accessing finance.
Red tape in the funding application process received a mark of 13%.
10% of SMMEs highlighted the whole stringent loan application process and, lastly 2% had communication problems.
Table 4.12: modification components
Communication problems - no forms in local language 2
Lack of collateral 55
Bad credit record 20
The whole application process is too stringent 10
42
Question 17: Is there a funding gap between funders and SMMEs?
The overwhelming majority of SMMEs agreed that there is a funding gap between funders and enterprises that seek funding in the ORTDM, response detailed in figure 4.9 below. “Financing gap” terminology, UCS (2011:52) defines it as, ‘a sizeable share of economically significant SMEs cannot obtain financing from banks, capital markets or other finance suppliers.’ Burns (2007:366) defines it “as the unwillingness on the part of suppliers of finance to supply it on terms and conditions that owner-managers need”.
About 90% of the interviewed SMMEs agreed that there is huge funding gap and 10 % disputed this and said that there is no funding gap; rather, it’s a funding mismatch between the funders and SMMEs which needs to be tackled by stakeholders.
Figure 4.10: Funding Gap
Question 18: Problems with the current funding model
80% of interviewed SMMEs in ORTDM said funding was their main problem, and 20 % indicated that their problem was not a matter funding. The explanation is depicted in figure 4.11.
SMMEs were not really happy with the current funding model and 80% indicated so in the research process.
Figure 4.11 Funding model problems
0 50 100 Start-ups Existing SMMEs 0 50 100 Start-ups Existing…