S-1
Supporting Information
Upshift of the
d
Band Center towards Fermi Level for
Promoting the Silver Ion Release, Bacteria Inactivation and
Wound Healing of Alloy Silver Nanoparticles
Yun Chang,1,2 Yan Cheng,1 Yanlin Feng,1,3 Kai Li, 4 Hui Jian, 1 and Haiyuan Zhang*1,2,3
1Laboratory of Chemical Biological, Changchun Institute of Applied Chemistry, Chinese Academy of Sciences, Changchun, Jilin 130022, China; 2University of Chinese Academy of Sciences, Beijing 10049, China; 3University of Science and Technology of China, Hefei, Anhui 230026 (P.R. China); 4State Key Laboratory of Rare Earth Resource Utilization, Chinese Academy of Sciences, Changchun, Jilin 130022, China.
*Corresponding author:
Haiyuan Zhang, Laboratory of Chemical Biology, Changchun Institute of Applied Chemistry, 5625 Renmin Street, Changchun, Jilin, 130022 (China); University of Chinese Academy of Sciences, Beijing 100049 (China); University of Science and
S-2
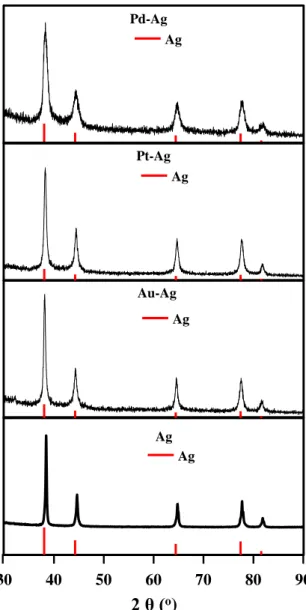
Figure S1. XRD patterns of pure and alloy Ag NPs.
Pd-Ag Ag Pt-Ag Ag Au-Ag Ag Ag Ag 30 40 50 60 70 80 90 2 θ (o)
S-3
Figure S2. XPS analysis of Au 4f in Au-Ag NPs (a), Pt 4f in Pt-Ag NPs (b), and Pd 3d in Pd-Ag NPs (c). 75 80 85 90 95
Binding energy (eV)
Au 4f
65 70
75 80
Binding energy (eV)
Pt 4f
332 337
342 347
Binding energy (eV)
Pd 3d a b c 4f7/2 4f5/2 4f7/2 4f5/2 3d5/2 3d3/2
S-4
Figure S3. Hydrodynamic size (a) and zeta potential (b) measurements of pure and alloy Ag NPs suspension (equivalent to 50 μg mL-1 Ag) in water and culture medium solution, respectively. 0 20 40 60 80 100 H y dr o dy na m ic siz e (nm ) -30 -25 -20 -15 -10 -5 0 Z eta po tent ia l (m V)
a
b
Water Culture medium
S-5
Figure S4. M (Au, Pt, and Pd)-Ag configurations for alloy nanoparticles d band center calculation.
Pd-Ag Pt-Ag
Au-Ag
S-6
Figure S5. Doped metal release behaviors and dissociation ratios of alloy Ag NPs (equivalent to 3 mg mL-1 Ag) as determined by ICP-OES analysis.
0 10 20 30 40 50 0 0.2 0.4 0.6 0.8 1 Do p ed metal d iss oci ation rat io (% ) Dop ed me tal r el ease (μ g/mL ) Au Pt Pd
S-7
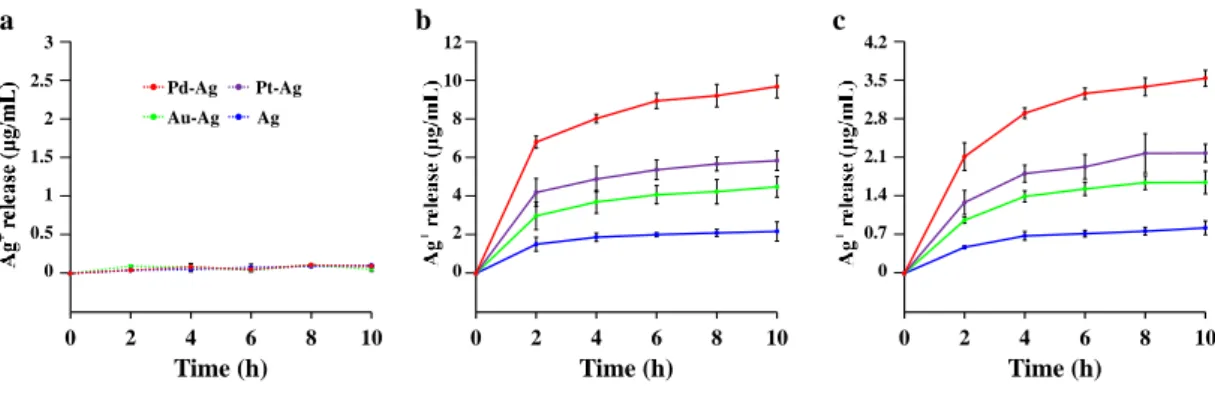
Figure S6. Ag+ release behaviors of pure and alloy Ag NPs (equivalent to 3 mg mL-1 Ag) at anaerobic conditions (a), 0.2 mM H2O2 solution (b), and phosphate buffer solution (pH=6.5) (c) as determined by ICP-OES analysis.
0 2 4 6 8 10 Time (h) 0 0.5 1 1.5 2 2.5 3 Ag Au-Ag Pt-Ag Pd-Ag 0 2 4 6 8 10 12 0 0.7 1.4 2.1 2.8 3.5 4.2 0 2 4 6 8 10 Time (h) 0 2 4 6 8 10 Time (h) a b c
S-8
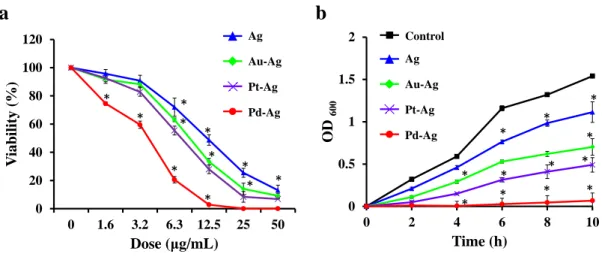
Figure S7. Antibacterial activity of pure and alloy Ag NPs against S.aureus bacteria. (a) Viability of S.aureus under the treatment of NPs with various concentrations at 12 h, *P<0.05. (b) Absorbance at 600 nm of S.aureus under the treatment of 12.5 μg mL-1 NPs (equivalent to Ag content) for different periods, *P<0.05.
0 20 40 60 80 100 120 50 25 12.5 6.3 3.2 1.6 0 V iabil ity (% ) Dose (μg/mL) 0 0.5 1 1.5 2 0 2 4 6 8 10 OD 600 Time (h) Ag Au-Ag Pt-Ag Pd-Ag Ag Au-Ag Pt-Ag Pd-Ag Control
a
b
* * * * * * * * * * * * * * * * * * * * * * *S-9
Figure S8. Antibacterial activity of Ag NPs and the mixture of doped metal ions and Ag NPs for E.coli and S.aureus bacteria. Viability of E.coli (a) and S. aureus (b) bacteria after 12 h of the treatment with NPs at various concentrations of Ag NPs and doped metal ions (the ratio based on M/Ag in metal doped Ag NPs).
0 20 40 60 80 100 120 50 25 12.5 6.3 3.2 1.6 0 V iabil ity (% ) Dose (μg/mL) 0 20 40 60 80 100 120 50 25 12.5 6.3 3.2 1.6 0 V iabil ity (% ) Dose (μg/mL) a b Ag+Pd ion Ag+Pt ion Ag+Au ion Ag Ag+Pd ion Ag+Pt ion Ag+Au ion Ag
S-10
Figure S9. (a) Optical images of bacterial colonies formed by S.aureus bacteria treated with 12.5 μg mL-1 pure and alloy Ag NPs (equivalent to Ag content). (b) SEM images of S.aureus bacteria treated or untreated with pure and alloy Ag NPs.
Control Ag Au-Ag Pt-Ag Pd-Ag
a
Control Ag Au-Ag Pt-Ag Pd-Ag
b
S-11
Figure S10. Oxidative stress responses of S.aureus bacteria treated with NPs. (a) Fluorescence images of DCF-stained S.aureus bacteria showing intracellular ROS production. (b) Cellular GSH levels in S.aureus bacteria determined by GSH-Glo assay, **P<0.01. (c) Lipid peroxidation assessment of S.aureus bacteria based on an MDA assay, **P<0.01.
Control Ag Au-Ag Pt-Ag Pd-Ag
a
0 0.5 1 1.5 2 2.5 3 3.5 M DA f o ld incr ea se 0 20 40 60 80 100 120 G SH (% ) 6.3 μg mL-1 3.2 μg mL-1b
c
6.3 μg mL-1 3.2 μg mL-1 12.5 μg mL-1 12.5 μg mL -1 ** ** ** ** ** ** ** ** 50 μm 50 μm 50 μm 50 μm 50 μmS-12
Figure S11. Cytotoxicity measurement. The viability of HaCat cells (a) and 3T3 cells (b) treated with different concentrations of pure and alloy Ag NPs after 24 h of incubation. 0 20 40 60 80 100 120 12.5 6.3 3.2 Cell v ia bility (% ) Concentration (μg mL-1) 0 20 40 60 80 100 120 12.5 6.3 3.2 Cell v ia bility (% ) Concentration (μg mL-1) Ag Au-Ag Pd-Ag Pt-Ag Ag Au-Ag Pd-Ag Pt-Ag
a
b
S-13
Figure S12. In vivo antibacterial analysis. Photographs of bacterial colonies obtained from E.coli–infected wound tissue treated with PBS, pure and alloy Ag NPs suspension for 2 days.
S-14
Figure S13. Wound sizes of various groups in different healing periods.