See discussions, stats, and author profiles for this publication at: http://www.researchgate.net/publication/276509800
Estimating bank default with generalised
extreme value regression models
ARTICLE in JOURNAL OF THE OPERATIONAL RESEARCH SOCIETY · MARCH 2015
Impact Factor: 0.95 · DOI: 10.1057/jors.2014.106
READS
19
2 AUTHORS: Raffaella Calabrese University of Essex 25PUBLICATIONS 36CITATIONS SEE PROFILE Paolo Giudici University of Pavia 94PUBLICATIONS 1,116CITATIONS SEE PROFILEEstimating bank default with
generalised extreme value regression
models
Raffaella Calabrese
University of Essex
[email protected]
Paolo Giudici
University of Pavia
[email protected]
AbstractThe paper proposes a novel model for the prediction of bank fail-ures, on the basis of both macroeconomic and bank-specific microe-conomic factors. As bank failures are rare, in the paper we apply a regression method for binary data based on extreme value theory, which turns out to be more effective than classical logistic regression models, as it better leverages the information in the tail of the default distribution. The application of this model to the occurrence of bank defaults in a highly bank dependent economy (Italy) shows that, while microeconomic factors as well as regulatory capital are significant to explain proper failures, macroeconomic conditions are relevant only when failures are defined not only in terms of actual defaults but also in terms of mergers and acquisitions. In terms of prediction effective-ness, the model based on extreme value theory outperforms classical logistic regression models.
1
Introduction
In the latest financial crisis, started in 2007, the core capital of banks has proved to be insufficient to cover impairment losses arising from loans and security portfolios. Consequently, several banks have been strengthened their capital base or reduced their asset exposure. Other banks have been bailed out by state aids or have defaulted. To reduce the risk of similar crises in the future and to enhance the resilience of the banking sector, a new regulatory framework, the so-called Basel III package, has been proposed, implying more stringent capital re-quirements for financial institutions (Basel Committee on Banking Supervision, 2011). The application and the supervision of the new regulatory framework increases the importance of having reliable sta-tistical models that, given an appropriate definition of distress of a bank, can identify their most likely predictor variables, thereby pro-viding early warning indicators of crisis.
For listed banks, both the definition of distress and the set predic-tors are naturally provided by financial markets: shares, bonds and credit default swap prices data are available with a high frequency and can thus be employed to capture in advance “early warning” signals. However, the majority of banks are not listed, in particular the small-est, often the most fragile as only a weak“safety net” is available for them. The issue thus becomes that of finding a definition of distress, and a correlated set of predictors, not based on financial market infor-mation but, rather, on microeconomic and macroeconomic data, less frequent, but closer to the fundamentals of a bank and of the economy in which the bank operates.
In this paper we aim to build a predictive model of bank distress, based on universally available information: microeconomic data from the balance sheet of a bank and macroeconomic information on the region where the bank operates. The advantage of such a model is clearly its universal applicability; its main weakness is the fact that the data on which its is based are not frequently updated, as they are available at most with a quarterly periodicity.
Note however that also financial market models, when available, have their pitfalls. Market information is often dependent not on the fundamentals of a bank or of the economy in which it operates, but, rather, on the market sentiment, often caused by speculative or irrational behaviours. Indeed, when Lehman Brothers filed for bankruptcy in September 2008 some analysts were almost caught by
surprise: two weeks prior to bankruptcy, the official Moodys KMV one-year Estimated Default Frequency (EDF) based on financial mar-ket data, for Lehman Brothers was only at 0.62% (Fantazzini and Maggi, 2013).
A further problem is that, while in financial market models distress can be defined in quantitative terms, such as the share price going below a certain threshold (the default threshold in Merton’s model, 1974 or the market VaR as in Acharya et al. (2010), for the predictive models to consider a precise definition of distress is more controversial. A very objective definition (such as the actual default of a bank) may take too long to be observed and, often, is not observable or observed in a very limited number of instances. Wider definitions of distress, that include situations of “de facto” default, such as induced mergers, state aid interventions or recommendations of supervisory authorities, may shorten the time span and increment the number of observed distressed banks, but at the price of an increased subjectivity.
In the attempt of overcoming the above difficulties, in this paper we suggest a novel predictive method of bank failures. On one hand, we employ two alternative “objective” definitions of distress, based on the actual codification of the event: “default of the bank” and “de-fault or merger and acquisition with other banks”. On the other hand, we apply Calabrese and Osmetti (2013)’s generalised linear model for binary data, that explains the distress event as a rare tail event of a latent variable, function of the available micro and macroeconomic in-formation, through a Generalised Extreme Value (GEV) link function. In such a way, while maintaining objectivity of the distress definition, we make an efficient use of the available information, leveraging what contained in the tail of the default distribution, rather than in its core. Our proposal will be tested on an economy that is highly depen-dent on the banking sector: the Italian economy, characterised by a large number of unlisted and small banks, rather crucial for worldwide systemic risks. From Bureau Van Djyk’s Bankscope database we shall consider the application of the GEV model to 783 Italian banks, ob-served over the period 1996-2011. The explanatory variables of this model are addressed directly by appropriate banking regulation and supervision authorities under the CAMELS1 framework, which is ap-plied in the US and has been adapted elsewhere. Furthermore, we choose Italian macroeconomic indicators for the GEV model in com-1Capital adequacy, Asset quality, Management soundness, Earnings and profitability,
pliance with some studies in the literature (Arena, 2008).
For the definition of bank failure, some authors exclude mergers from it (Arena, 2008), other authors include them (Bongini et al., 2001; Gonzalez-Hermosillo, 1999). This contradictory indications im-ply that it is necessary to check the robustness of our results to the inclusion or exclusion of mergers and acquisitions from the definition of bank failure (default). In this analysis we shall obtain, for the Italian banking sector, that the two definitions lead to different determinants of default. By excluding bank mergers and acquisitions, accounting variables are pivotal to explain bank distress. On the contrary, by including them, only macroeconomic variables become relevant.
The paper is organised as follows. Section 2 presents a literature review that sets the background of our model. The methodological proposal is described in Section 3. Empirical evidences, which illus-trate the actual implementation of the model to the Italian banking sector, are presented in Section 4. Finally, Section 5 contains some concluding remarks and future directions of research.
2
Literature review
The study of bank failures is important for two reasons. First, an understanding of the factors related to bank failure enables regula-tory authorities to supervise banks more efficiently. In other words, if supervisors can detect problems early enough, regulatory actions can be taken, to prevent a bank from failing and, therefore, to reduce the costs of its bail-in, faced by shareholders, bondholders and depos-itors; as well as those of its bail-out, faced by the governments and, therefore, by the taxpayers. Second, the failure of a bank very likely induces failures of other banks or of parts of the financial system as a whole. Understanding the determinants of a single bank failure may thus help to understand the determinants of financial systemic risks, were they due to microeconomic, idiosyncratic factors or to macroe-conomic imbalances. When problems are detected, their causes can be removed or isolated, to limit “contagion effects”.
The literature on predictive models for single bank failures is rel-atively recent: until the 1990s most authors emphasize the absence of default risk of a bank (see e.g. Gup, 1998; Roth, 1994), in the presence of a generalised expectation of state interventions. However, in the last years we have witnessed the emergence of financial crisis
in different areas of the world, and a correlated emphasis on systemic financial risks. Related to this, there have been many developments of the international financial regulation, aimed at mitigating such risks. In addition, government themselves are less willing than before to save banks, partly for their financial shortages and partly for a grow-ing negative sentiment from the public opinion. As a consequence of all of these aspects, the very recent years are seeing a growing body of literature on bank failures, and systemic risks originated from such them.
The studies on bank failures can be classified into three main streams: financial market models, scoring models and macroeconomic models.
Financial market models originate from the seminal paper of Mer-ton (1974), in which the market value of a bank’s assets, typically modelled as a diffusion process, is insufficient to meet its liabilities. Due to its practical limitations, Merton’s model has been evolved into a reduced form (see e.g. Vasicek, 1984), leading to a widespread diffu-sion of the resulting KMV model, and the related implementation in Basel’s credit portfolio model. For a review of this evolution see, for example, the book by Resti and Sironi (2007). In order to implement market models, diffusion process parameters and, therefore, bank de-fault probabilities can be obtained on the basis of share price data that can be collected almost in real time from financial markets. Market data are relatively easy to collect, are public, and are quite objective. On the other hand, they may not reflect the true fundamentals of the underlying financial institutions, and may lead to a biased esti-mation of the probability of failure. This bias may be stronger when the probability of multiple failures are to be estimated, as it occurs in systemic risk. Indeed, the recent paper by Idier et al. (2012) shows that market models have been proven not much reliable in predictive terms. Fantazzini and Maggi (2013) show, in a similar experiment, that market models may be good in very short-term predictions, but not in medium and long-term ones.
The diffusion of corporate scoring models, that followed the sem-inal paper by Altman (1968) has induced the production of some scoring models for banks themselves: noticeable examples are Sinkey (1975), Tam and Kiang (1992), Rose and Kolari (1985), Cole and Hunter (1998). The development of the Basel regulation (www.bis.org) and the recent financial crisis have further boosted the literature on scoring models for banking failure predictions. Recent examples
in-clude Arena (2008), Davis and Karim (2008) who use logit mod-els; Vazquez and Federico (2012) who use a probit model; Gomez-Gonzalez and Kiefer (2007) who use a hazard function
ap-proach and Klomp and de Haan (2012) who use a principal
compo-nent factor approach.
The emergence of systemic risks has also directed the attention on macroeconomic models to predict bank failures, especially for those countries whose economies are heavily dependent on banks. As in Merton’s reduced form model, the main intuition behind these models is to decompose failure risk into an idiosyncratic component, that can be studied using microeconomic data, and a systematic component, that can be addressed with macroeconomic data. See, for example, the papers by Koopman et al. (2012) and, more recently, Mare (2012) and Kanno (2013) who applied this kind of models respectively, to the Italian and Japanese banking systems. An interesting, and comple-mentary approach, is suggested in Kenny et al. (2012) who suggest employing economists’ opinions as expert assessments of risks.
A different approach, somewhat standing between the previous ones, based on the capital at risk reported by banks in their financial statements, is provided by the Symbol model of De Lisa et al (2011). This approach inverts the Vasicek model Basel II formula (Vasicek, 1984) so to obtain, for each bank, the probability of default that cor-responds to the amount of regulatory capital set aside for the coverage of financial risks. The advantage of this approach is an estimate of the default probability that takes into account the actual riskiness of the loan assets of a bank. However, the estimated capital at risk is a measure that depends on the chosen internal model, as well as on the strategies of a bank and, therefore, the model may not be fully ade-quate for external early warning monitoring (see for instance Berger et al., 2008, for a discussion on how capital ratios can be managed by banks). In any case, simulation based approaches, as the Symbol model, are growing in importance, following the regulatory empha-sis on dynamic stress tests of banking asset quality and capital, as emphasised in the recent paper by Halaj (2013).
A related stream of literature is that on systemic risk, which is very recent, and follows closely the developments of the recent finan-cial crisis, started in 2007. A comprehensive review is provided in Brunnermeier and Oehmke (2012) who also provide a historical com-parison of different crisis. Specific measures of systemic risk have been proposed, in particular, by Adrian and Brunnermeier (2009), Acharya
et al. (2010), Brownless and Engle (2011), Huang et al. (2011), Billio et al. (2011) and, from a different perspective, Segoviano and Good-hart (2009). All of these approaches are built on financial market price information, on the basis of which they lead to the estimation of appropriate quantiles of the estimated loss probability distribution of a financial institution, conditional on a crash event on the financial market. Market models, however, do not capture the determinants of single bank failures and this is even more true for systemic fail-ures, whose determinants are to be found in common idiosyncratic risk factors and/or common macroeconomic causes, as illustrated, for example, in the recent paper by Idier et al. (2013).
In this paper we aim to provide a model for the estimation of single bank failures, that can be universally applied to all banks, that can take into account both microeconomic and macroeconomic data. Statistical scoring models appear a natural choice for this objective.
3
Methodology
Scoring models for the estimation of bank defaults have two main preliminary choices to be made: which distress definition to employ and which explanatory variables to use as potential predictors of such distress.
Concerning the former, non financial scoring models typically use an objective measure of distress, which is related to the event of a company not paying its obligations in time. For banks this definition cannot be employed, but other definitions do exist, especially from a normative viewpoint. For example, the Bureau Van Djyk’s Bankscope database, which we shall employ in this paper, defines a bank in de-faut when it is in at least one of the following states: bankruptcy, dissolution or in liquidation. For some authors (Bongini et al., 2001; Gonzalez-Hermosillo, 1999; Vazquez and Federico, 2012), banks that were merged or acquired by another banks can also be included in the definition of failure. However, mergers and acquisition might have been carried out for strategic aims rather than for insolvency rea-sons (Arena, 2008). Other authors include in the definition of distress state aid and government intervention (see e.g. Buehler et al., 2009 and Brown and Dinc, 2009). The definition of state aid is indeed quite subjective and, probably, this enlargement has to be evaluated as a function of the regulatory framework of the country to which
it is applied. Last, it should be mentioned that some authors use, rather than a distress binary variable, a continuous one, expressed in terms of (lacking) capital, as in Merton’s model (see e.g. Memmel and Raupach, 2009 and Maurin and Toivanen, 2012 ). It must be said, however, that this approach is fine when the aim is regulatory cap-ital itself, otherwise capcap-ital should be maintained as an explanatory variable, given its endogeneous nature.
Concerning the definition of predictors, both microeconomic data, obtained from the balance sheet of a bank, and macroeconomic data, relative to the country in which the bank operates, may be consid-ered. Some authors (e.g. Arena, 2008; Bongini et al., 2001; Gonzalez-Hermosillo, 1999; Mannasooa and Mayes, 2009) claim that only mi-croeconomic indicators should be used, such as those addressed di-rectly by appropriate banking regulation and supervision authorities under the CAMELS2 framework, which is applied in the US and has been adapted elsewhere. Other microeconomic indicators can also be used: for example, Bongini et al. (2002) and Carapeto et al. (2010) compare different sets of indicators and regulatory measures and con-clude that there is not a single answer but, very likely, different sets of indicators may be used simultaneously, depending on the availability of good quality data. It should also be mentioned that some authors suggest, given the very large number of indicators of banking distress, to combine them through a principal components or factor analytic approach (see, for instance, Canbas et al., 2005, Klomp and de Haan, 2012, Billio et al. 2011): this has the disadvantage of being a pure exploratory approach, not suited for predictive purposes, as in our cur-rent context. On the other hand, other authors (Arena, 2008) show that macroeconomic conditions in the markets where a bank operates also appears to affect the probability of bank failure, and, therefore, should be included. Banking crises tend to erupt when the macroe-conomic environment is weak, particularly when growth is low and inflation is high.
In this paper we will consider two alternative definitions of bank failure: one that includes only actual defaults, as previously defined, and one that adds to them mergers and acquisition events. We will not include state aids in the definition of distress, due to the subjec-tivity of this information. Furthermore, in the Italian banking system that we are going to consider in the application, only four Italian 2Capital adequacy, Asset quality, Management soundness, Earnings and profitability,
banks have received state aid in the recent crisis, and for very limited amounts (relatively to their asset sizes). Concerning predictors, ours will be chosen according to the CAMELS framework, as well as from the current Basel regulatory framework, so to take into account bank specific conditions as well as the regulatory environment. In addition, we will include macroeconomic variables into the model, along with microeconomic variables, as in the recent literature (see, for example Maurin and Toivanen, 2012).
We can proceed now with model specification. The most com-monly used model for credit scoring applications is logistic regression (see e.g., Altman, 1968 and, for bank default prediction, Arena, 2008, Bongini et al., 2001, Mannasooa and Mayes, 2009). Logistic regression models are generalised linear models (see e.g. McCullagh and Nelder, 1989), specified by a Bernoulli response random variable and a logis-tic link function, which relates a function of the expected value of the response variable to a linear combination of the available predictor variables. In our context, the event “failure of a bank”, as previosuly defined, can be represented by a Bernoulli random variable Yi with a
parameterπi that indicates the probability of failure of a given bank,
for i= 1,2, ..., n banks under analysis. The logistic link can then be specified as follows: logit(πi) =ln( πi 1−πi ) =β0+ p X j=1 βjxji =ηi,
for j = 1,2, ..., p predictor variables and for all i = 1,2, ..., n banks under examination.
From the previous expression the predicted failure probability for a bank can be obtained as:
πi = 1/(1 +exp(ηi)).
Details on estimation methods and inferential procedures for gen-eralised linear models and, therefore, for logistic regression models, can be found in McCullagh and Nelder (1989).
There is one main drawback associated with the application of logistic regression models to bank failure prediction: the number of observed failures is usually very small. Hence, the use of the logistic link function may not be appropriate because of its symmetry around 0.5, which implies that the predicted default probability in the above expression approaches zero at the same rate as it approaches one. In
other words, these models assign the same importance to the char-acteristics of “good” and “bad” banks, ignoring the rarity of bank failures. This is not ideal, as the characteristics of failures are more informative than those of non-defaults and, consequently, πi will be
underestimated (Calabrese and Osmetti, 2013). The same problem holds for probit link models and, more generally, to all symmetric link functions for binary response variables. This drawback suggests using an asymmetric link function, as proposed by Calabrese and Osmetti (2013) and Wang and Dey (2010).
The main idea behind Calabrese and Osmetti (2013)’s proposal is to concentrate estimation efforts on the tail of the distribution, adopting a link function that lets the predicted default probability to approach one slower than it approaches zero. To achieve this aim, Cal-abrese and Osmetti (2013) suggest using the inverse of the cumulative distribution function of a Generalised Extreme Value (GEV) random variable as a link function in a generalised linear model for Bernoulli response variables.
Embrechts et al. (1997) and Dowd (2002) give an extensive overview of extreme value theory for risk management, which is indeed a ro-bust framework to analyse the tail behaviour of distributions. The Generalized Extreme Value (GEV) is a very flexible model and its cumulative distribution function is given by
F(x) = exp ( − 1 +τ x−µ σ −1/τ) defined onSX ={x: 1 +τ(x−µ)/σ >0}.
Note that, in the above definition, there are three unknown param-eters: τ, the tail parameter;µ, the location parameter andσ(>0), the scale parameter. Some well-known distributions can be obtained for different values of the tail parameter τ: for τ > 0 the Fr´echet distri-bution, for τ <0 the Weibull distribution and for τ →0 the Gumbel distribution.
The GEV regression model proposed by Calabrese and Osmetti (2013) is defined by a link function that corresponds to the inverse cumulative function of the GEV distribution, that can be called GEV regression model or “gevit”, in analogy with the “logit”:
gevit(πi) = −ln(πi)−τ−1 τ =β0+ p X j=1 βjxji=ηi,
for j = 1,2, ..., p predictor variables and i = 1,2, ..., n banks under examination.
From the previous expression the predicted default probability of a bank can be obtained as the cumulative distribution function of the GEV, calculated in correspondence with the oberved linear combina-tion of the predictor variables ηi:
πi= exp{−[1 +τ ηi]−1/τ}, (3.1)
which exists only when 1 +τ ηi >0.
Clearly, the above expression is asymmetric and, therefore, under-estimation of the default probability may be overcome. In addition, the proposed model is rather general: depending on the value of τ, several special cases can be recovered; for example, when τ → 0 the GEV random variable follows a Gumbel distribution and its cumula-tive distribution is the log-log function, which gives rise to the log-log generalised linear model (Agresti, 2002).
Note that the construction of the gevit model proposed is similar to that of the probit model, in which the cumulative distribution function of the Gaussian distribution is used, rather than that of the GEV. However, as already mentioned, the probit predictive default curve is symmetric as well as the logit one and, therefore, it would not solve our problem.
As the log-likelihood derivatives of the gevit model does not have closed form, maximum likelihood estimators need to be obtained nu-merically, using iterative optimisation algorithms. Such algorithms have been developed and implemented in a publicly available soft-ware: the R package BGEVA (Calabrese et al., 2013). This package uses the penalized maximum likelihood method (Ruppert et al., 2003), employed in semiparametric regression. By introducing smooth func-tions in the regression model, the penalty matrices remove the part of smooth term complexity which has no support from the data. To ob-tain the penalized maximum likelihood estimates, the BGEVA package exploits the trust region algorithm (Nocedal and Wright, 2006).
Note that the above optimisation algorithms, like many others, requires the specification of initial values to be used in an iterative scheme. In the BGEVA package, the initial values for the parameter vectorβ can be obtained from the estimates of the logistic regression model. This method is applied for different values of τ and the ones with the best predictive accuracy can be chosen.
To summarise, parameter estimation can be performed, with the previous caveats, within the context of generalised linear models. This implies that the ouputs of the analysis can be read off as usually, and this is an important advantage for model users. In addition, differently from what suggested by the literature on ”adjusted” logistic models (see e.g. King and Zeng, 2001), no (subjective) correction factors need to be specified.
From an interpretational viewpoint, because of the structure of the gevit predictive default probability, the effect sign of the predic-tors is the opposite from what appears from the standard output. This because, in the interpretation of the regression parameters β, if the parameter βj is positive and all the other parameters are fixed,
by increasing the j-th regressor, xj, the estimated predictive failure
probability πi decreases.
We remark that GEV models, like logistic and probit models, are static in time. Hazard models generalise static models by explicitly accounting for time, so that the whole process of deterioration of creditworthiness can be followed. In addition, hazard models allow nonlinear effects of the ex-planatory variables on the dependent variable, which is the time to bank failure after the occurrence of a negative shock (Gomez-Gonzalez and Kiefer, 2009). While GEV models are also able to capture non linear effects of the explanatory variables on the default event, they are static, as their aim is the prediction of the failure point, independently of where it occurs in time. For this reason in this paper we shall com-pare the performances of our proposal to those of the most popular static model, the classical logistic regression model.
The two models will be compared by calculating the correspond-ing ROC Curve, and the associated AUC and H measures (see e.g. Hand, 2009 and Hand, 2010). To attain more precise conclusions, we will consider whether the reported differences in AUC and/or H are significant, within a formal statistical hypotheses testing procedure.
More precisely, following Hanley and McNeil (1983), we will con-sider the test statistic
Z = Tl−Tg sd(Tl−Tg)
whereTl andTg are the AUC or the H measures for the logistic model
(Tl) and the GEV model (Tg), respectively. Unlike Hanley and McNeil
test will be, respectively, the mean and the standard deviation of the differenceTl−Tg computed on the M bootstrap replicates.
4
Empirical evidences
Financial statements for banks and financial institutions can be ob-tained from Bankscope, a comprehensive database of balance sheet and income statement data for individual banks across the world pro-vided by the private company Bureau Van Dijk. The information made available to us covers the period 1996-2011, with observations on an annual basis.
We have decided to concentrate our analysis on the Italian banking system. All Italian banks with a Bankscope account are 1,053, of which only for 783 banks all data are available. Missing observations typically concern small banks, whose characteristics are very similar to many other banks with complete data: we do not see a selection bias issue, in this respect. The Italian banking system is particularly suited to illustrate the behaviour of a predictive scoring model for bank defaults. It is a market that presents a low concentration of operators, compared to other countries: there are many banks, most of which are not publicly traded: currently less than 20 out of 1,053. Italian Banks can be grouped, structurally, into three main groups: a) retail community banks, small and operating at a very local level, with few branches, with most of them belonging to a federation umbrella; b) retail community banks, operating at the regional or macro regional level, with a reasonable size, often listed. Although characterised by a bigger size, the governance of such banks is similar to that of the smaller community banks, with many shareholders, powered with per-capita voting rights; c) commercial banks, which are of a bigger size and are classical public companies. The biggest of them have, as main shareholders, foundations that are controlled by regional governments. Some others have, as main shareholders, other European banks and insurance companies.
From the previous description it is clear that the Italian banking system is quite entropic and, therefore, interesting, from our statisti-cal point of view. It would very much less so, from a financial market based modelling perspective. Furthermore, it must be added that, in Italy: 99% of the non financial companies are small and medium en-terprises, with many of them family based; most companies, not only
SMEs but also large ones, have a very limited access to financial mar-kets and, therefore, depend heavily on bank credit; Italy has a high national debt, currently around 130% of the GDP, and a large pro-portion of it is owned by Italian banks. These three additional factors explain why the Italian financial system is heavily bank-dependent and why an approach based on financial market data would not be effective.
During the latest financial crisis, banks have been suffering consid-erably. Differently from what happened in other European countries, state aid has been very limited and no bail outs have been undertaken; however, in the recent years provisions and write-offs of loan credits have increased dramatically and banks do require capital injections. These are not easy to obtain, as the country solvency risk and finan-cial frictions in Europe has increased cost and availability of funding. Notwithstanding the difficult situation, few banks have gone default, and these are to be found mainly within the small community banks. The action of the regulator, the Bank of Italy, has always been firm in terms of monitoring the system and this may explain why the sys-tem is resilient. However, as the situation is getting worse and the European banking union is approaching, it makes a lot of sense to study the characteristics of the italian banking system, with the aim of understanding which are the most likely factors of default of Italian banks, so to have better and more timely prevention tools. This is the applied scope of this paper.
The early warning indicators of bank failure present in Bankscope can be divided into two sets: those that are bank specific and macroe-conomic or external factors that affect all banks. Overall there is no universal set of indicators used across previous studies, although there is more commonality over broad-based macroeconomic variables, such as GDP and inflation indexes (see e.g. Mannasoo and Mayes, 2009). In contrast, the set of bank-specific variables is less uniform across studies.
As discussed, financial ratios associated with the CAMELS rating system can be used to measure bank-level fundamentals related to the asset and liability structure of a bank, assuming that these ratios capture the market, credit, operational, and liquidity risk faced by banks. We decided to use these ratios as explanatory variables of bank failure in our model and, therefore, whether they are significant, can be interpreted as determinants of such failure. In addition, because of the importance and impact of capital requirements, we have inserted
the capital ratios monitored by Basel regulation in the model. Last, the most important macroeconomic variables have also been included and, therefore, our model mixes microeconomic with macroeconomic explanatory factors.
In compliance with Basel regulation, our model attempts to predict bank failure one year in advance. Therefore, all explanatory variables are evaluated one year in advance, with respect to the time in which the bank failure response variable is evaluated.
High correlation among variables is a drawback, since it leads to multicollinearity in the regression models. In order to measure the impact of multicollinearity, we have computed the Variance Inflation Factor (VIF) for each explanatory variable. From the 14 explanatory variables that were initially chosen, those with a VIF higher than 5 were removed, leading to 11 remaining predictors.
With data on such predictors, and on the response variable, for all banks and time periods considered, we have applied both the logis-tic regression model and the GEV regression model described in the previous Section. We have considered both definitions of bank failure: one “restricted”, that includes only defaults and one that includes, besides defaults, also banks that have been merged or acquired. Since the observed percentage of defaults for the restricted definition is equal to 4.469%, the logistic regression model is unsuitable to correctly clas-sify “good” and “bad” banks. Hence, we report only the estimation results of the GEV regression model.
Table 1 shows our obtained estimates, when the definition of bank failure includes only defaulted banks: bankrupted, dissolved or in liq-uidation, according to Bankscope. Conversely, Table 2 shows the ob-tained results by including mergers and acquisitions in the definition of bank failure.
Table 1 about here Table 2 about here
Comparing the results in Table 1 with those in Table 2, the first relevant finding is that financial and capital ratios are significant to explain the first definition of default but not for the second defini-tion. This outcome confirms that mergers and acquisitions might have been carried out for strategic rather than for distress reasons. The re-sults for the larger definition of default seem, on the other hand, be strongly influenced by the economic cycle, since Table 2 shows that most macroeconomic variables (with the exclusion of the interest rate) are important for the second definition of bank failure. To complete
Variable Estimate Std. Error z value Pr(>|z|)
τ -1.421 0.673
Intercept 59.082 34.570 1.709 0.087.
Asset quality
Loan loss Reserves/Loans 2.640 0.085 3.101 0.001 **
Loans/Total assets -0.003 0.001 -2.088 0.036 *
Capital
Equity/Total assets 0.389 0.141 2.748 0.006 **
Tier 1 capital ratio 0.810 0.274 2.950 0.003 **
Total capital ratio 0.413 0.211 1.953 0.050 .
Liquidity
Liquid Assets/Total Deposits -0.064 0.027 -2.347 0.018 *
Operations Return On Assets 0.072 0.028 2.531 0.011 * Macroeconomic variables GDP rate 37.290 38.962 0.957 0.338 Inflation rate -0.580 0.305 -1.902 0.057 . Unemployment rate -1.591 1.008 -1.579 0.114 Interest rate -0.737 0.695 -1.060 0.289
Table 1: Signif. codes: 0 “***” 0.001 “**” 0.01 “*” 0.05 “.” 0.1 “ ” 1 Parame-ter estimates on 783 Italian banks from 1996 to 2011. The definition of failure includes bankruptcy (no bank), dissolved (16 banks) and in liquidation (19 banks).
the picture, note that Tier 1 capital ratio is the only microeconomic variable that is significant (at 5%) for the “enriched” definition of de-fault that includes mergers and acquisitions. On the other hand, the inflation rate is the only macroeconomic variable that is significant (at 5%) for the “restricted” definition of default.
To understand how the explanatory variables affect bank distress, we recall that, when the parameter estimate is positive, by increasing
Variable Estimate Std. Error z value Pr(>|z|)
τ -1.421 0.673
Intercept 59.082 34.570 1.709 0.087.
Asset quality
Loan loss Reserves/Loans 2.640 0.085 3.101 0.001 **
Loans/Total assets -0.003 0.001 -2.088 0.036 *
Capital
Equity/Total assets 0.389 0.141 2.748 0.006 **
Tier 1 capital ratio 0.810 0.274 2.950 0.003 **
Total capital ratio 0.413 0.211 1.953 0.050 .
Liquidity
Liquid Assets/Total Deposits -0.064 0.027 -2.347 0.018 *
Operations Return On Assets 0.072 0.028 2.531 0.011 * Macroeconomic variables GDP rate 37.290 38.962 0.957 0.338 Inflation rate -0.580 0.305 -1.902 0.057 . Unemployment rate -1.591 1.008 -1.579 0.114 Interest rate -0.737 0.695 -1.060 0.289
Table 2: Signif. codes: 0 “***” 0.001 “**” 0.01 “*” 0.05 “.” 0.1 “ ” 1 Parame-ter estimates on 783 Italian banks from 1996 to 2011. The definition of failure includes bankruptcy (no bank), dissolved (16 banks) and in liquidation (19 banks).
the corresponding variable and fixing all the others, the estimate of the probability of bank default decreases and, conversely, when the estimate is negative.
For financial and capital variables, the signs and the mag-nitude of the estimates can be read off from Table 1. Regard-ing asset quality, the amount of loss reserves is significant and is expected to be negatively related to the risk of bank
fail-Variable Estimate Std. Error z value Pr(>|z|)
τ -0.148 0.189
Intercept 54.710 11.321 4.832 0.001 ***
Asset quality
Loan loss Reserves/Loans 0.067 0.045 1.480 0.138
Loans/Total assets -0.001 0.007 -0.168 0.866
Capital
Equity/Total Assets -0.042 0.057 -0.752 0.452
Tier 1 capital ratio 0.184 0.095 1.923 0.054 .
Total capital ratio 0.152 0.094 1.615 0.106
Operations
Return on Assets 0.194 0.228 0.853 0.393
Liquidity
Liquid Assets/Total Deposits -0.002 0.011 -0.173 0.862
Macroeconomic variables
GDP rate 16.601 5.561 2.985 0.002 **
Inflation rate -0.493 0.0831 -5.935 0.002 ***
Unemployment rate -1.133 0.353 -3.204 0.001 **
Interest rate -0.259 0.354 -0.730 0.465
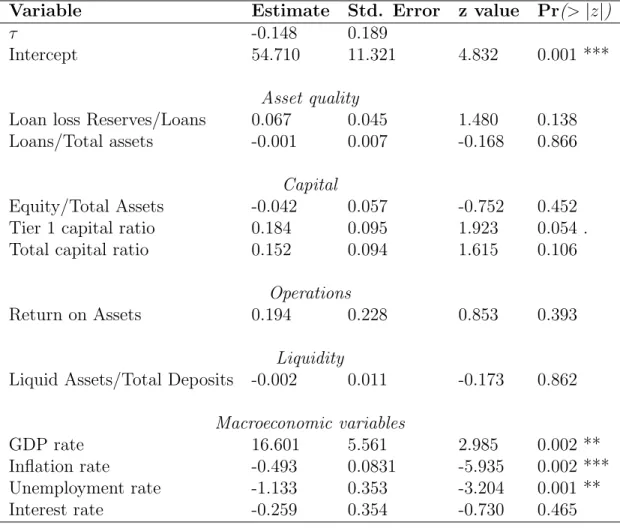
Table 3: Signif. codes: 0 “***” 0.001 “**” 0.01 “*” 0.05 “.” 0.1 “ ” 1 Parameter estimates on 783 Italian banks from 1996 to 2011. The definition of failure includes bankruptcy (no bank), dissolved (16 banks), in liquidation (19 banks), merged or acquired (306 banks).
ure: the higher the coverage, the lower the risk, as expected; the loans to assets ratio, instead, is positively related, in ac-cordance with what expected, analogously to Arena (2008), Ashcraft (2008) and Boyd et al. (2009).
Concerning capital, the signs of the estimates in Table 1 coincide with what expected for the leverage ratio, equity to total assets, as in Arena (2008): higher solvency implies lower
risk of failure. Simlilarly, both Basel II capital ratios are negatively correlated with the risk of bank failures. Between the two, the most significant is the Tier1 capital ratio.
Concerning liquidity we consider a deposit run off ra-tio and look at what percentage of deposit and borrowings could be met if they were withdrawn suddenly. In contrast with what expected (Arena, 2008), this ratio turns out to be positively related to the risk of bank failure. Wagner (2006) explains a similar finding by noting that, although higher as-set liquidity directly benefits stability by facilitating asas-sets liquidation during crisis, it also makes crisis less costly for banks. As a result, banks have an incentive to take on an amount of new risk that more than offsets the positive direct impact on stability.
In terms of operations, The ROA variable is, on the other hand, negatively correlated with the probability of failure.
Finally, concerning macroeconomic variables, their effects should be read off from Table 2. The estimates in Table 2 show that, while an increase in the GDP growth rate has a negative effect on the risk of bank distress (it decreases the risk), an increase in the inflation rate or in the unem-ployment rate has a positive effect (they increase the risk). Macroeconomic effects, therefore, are in line with the expec-tations and this seems to be a valid conclusion, especially as merger and acquisition events do prevail in the data behind Table 2. Note finally that, among the macroeconomic vari-ables, the interest rate does not seem to have a significant effect on bank failure.
From a quantitative viewpoint, the magnitude of the co-efficient estimates can be interpreted comparing the values of the predicted default probabilities in (3.1) under different values of the predictor to be interpreted. For example, con-cerning capital variables, if a bank increases its leverage from the regulatory minimum 3% by one point, at 4%, its default probability decreases by about 1.5%; if, instead, it increases the Tier1 ratio from the minimum 8% by one point, at 9%, its default probability decreases by about 3%. Alternativey, one can employ the estimated coefficients and approximate the elasticity of the default probability with respect to an explanatory variable using the linear approximation at the
mean point: it turns out that such elasticity is equal to -1.16 for the leverage and -3.20 for the Tier1 ratio.
We now show that the GEV model, besides being more natural, also outperforms logistic regression in terms of actual performance. It is well known that the performance of models can be highly sensitive to the data sample used for validation. To avoid embedding unwanted sample dependency, models should be validated on observations that are not included in the sample used to estimate the model. Hence, we run out-of-sample validation to compare the GEV and the logis-tic regression models. For this aim we consider the confusion matrix (Giudici, and Figini, 2009) and the Area Under the Curve (AUC) index that is built upon the confusion matrix (Hand, 2001). In addi-tion, we consider the the H measure, as it overcomes the drawbacks of the AUC, when class sizes and classification error costs are extremely unbalanced (Hand, 2009 and 2010): both these characteristics are sat-isfied in our context.
Finally, we consider the more conventional MAE and MSE mea-sures, defined as:
M AE = Pn i=1|yi−πˆi| n M SE= Pn i=1[yi−πˆi]2 n .
All calculations are based on the same data partition, where 70% of the observations is used as training set and 30% as validation set. We shall report the false positive rate (the number of predicted de-faults that do not occur, over the number of non-dede-faults) and the false negative rate (the number of predicted non-defaults that actu-ally default over the number of defaults) of the two models only for a control sample.
It is more costly to classify a bank as good-performing when it is in bankruptcy than to classify a bank as in bankruptcy when it is safe. In particular, when a bankrupted bank is classified as good performing by the model, irreversible actions may erroneously follow. For instance, the economic system may keep lending to the bank. If the bank becomes bankrupt, the lenders can loose their loans, with important consequences on the stability of the economic system. On the contrary, when a good-performing bank is classified as bankrupt, reversible actions may be taken: for example, state aid can be granted, but this can be returned when the good performance of the bank is verified. For all these reasons, false negative errors are more important than false positive errors.
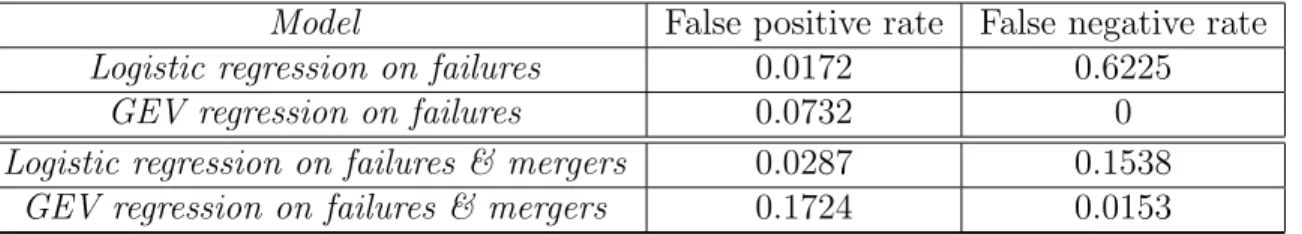
Table 3 shows the false positive and false negative errors, for the two models, and the two alternative definitions of bank failures, for the same control sample.
Table 3 about here
Model False positive rate False negative rate
Logistic regression on failures 0.0172 0.6225
GEV regression on failures 0.0732 0
Logistic regression on failures & mergers 0.0287 0.1538
GEV regression on failures & mergers 0.1724 0.0153
Table 4: Prediction errors of the logistic and the GEV regression models on the control sample.
Table 3 shows that false negative errors for the logistic model are much higher than the ones for the GEV model. Conversely, false positive errors are slightly higher for the GEV than for the logistic regression model. If, false negative errors are deemed more important, as should be the case in our context, the GEV regression model clearly outperforms logistic regression.
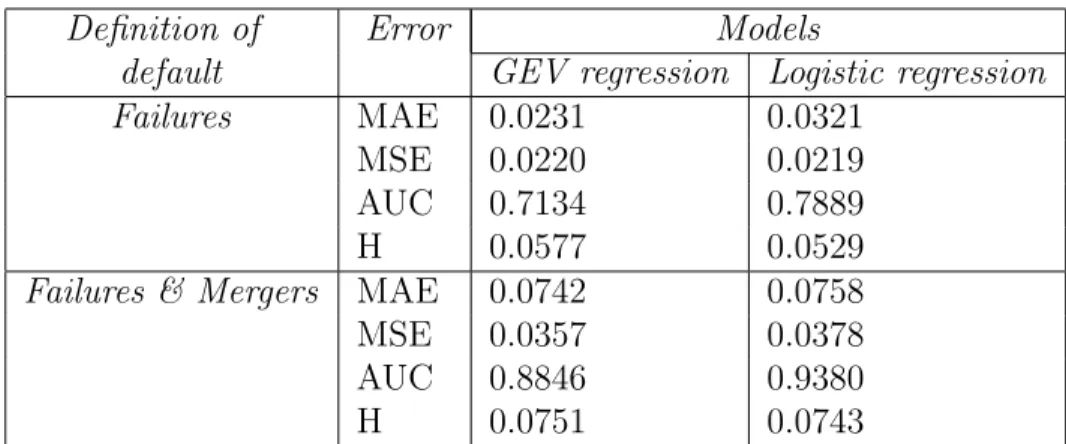
To further assess the predictive performance of the GEV regression model and the logistic model for the two definitions of bank failure, we have applied a non-parametric bootstrap method. Replications for the bootstrap are handled by the plyr package of R-program. Since the number of bank defaults is very low, the bootstrap is stratified: the same number of bank defaults than in the original sample is se-lected in each bootstrap replicate. Table 4 reports the means of the H measure (Hand, 2009), AUC, MAE and MSE computed on 2,000 different bootstrap samples. The same number of replications is used by Robin et al. (2011).
Table 4 about here
From Table 4 the GEV regression model shows MAE average er-rors lower than the respective erer-rors of the logistic regression model, for both definitions of bank failure. The mean of MSE is lower for the GEV model if failures are defined as failures and mergers, but it is slightly higher than the logistic one for the first definition of default. The average H measure for the GEV model is always higher than the same measure for the logistic regression model. On the contrary, this relationship is inverted if we consider the AUC. To understand this
Definition of Error Models
default GEV regression Logistic regression
Failures MAE 0.0231 0.0321
MSE 0.0220 0.0219
AUC 0.7134 0.7889
H 0.0577 0.0529
Failures & Mergers MAE 0.0742 0.0758
MSE 0.0357 0.0378
AUC 0.8846 0.9380
H 0.0751 0.0743
Table 5: Average forecasting accuracy measures for different PDs on the control sample.
discrepancy we remark that the H measure is equivalent to averaging the misclassification loss over a cost ratio distribution which enables us to better represent highly unbalanced misclassification costs. Instead, this weight function in the AUC depends on the score distributions (Hand, 2009), so that different classification models may be incoher-ently evaluated and compared. To sum up, the H measure is more reliable than the AUC in our context.
We have finally compared the performances of the two models, the GEV model and the classical logistic regression one, by means of the hypotheses test suggested by Hanley and NcNeil described in the methodological Section. The approximate p-value of the test allows us to reject the hypothesis that the logistic and the GEV models show the same performance for both definitions of bank distress: the pure default one and the one with mergers. This for the AUC as well as the H measure. This points toward the significance of the overall superiority of the GEV model.
5
Conclusions
We have proposed a novel predictive model, aimed at efficiently esti-mating the probability of default of financial institutions, based on a generalised extreme value regression model. The model has been ap-plied and tested on the Italian banking system, characterised by the presence of a large number of banks, and a large number of unlisted
and small banks.
Our main finding is that, when distress is defined only in terms of actual default (bankruptcy, liquidation or closure), microeconomic bank-specific variables are the most relevant predictors of bank fail-ure; conversely, when distress is enlarged to include mergers and ac-quisitions, macroeconomic factors come into play. More generally, our results suggest that, coherently with the recent literature, both micro and macro data sources should be included in the set of early warning indicators aimed at predicting bank failures.
In terms of predictive performance, generalised extreme value re-gression models perform better than logistic rere-gression models, espe-cially in terms of reducing the number of false negatives (i.e. bank failures classified as “good”), which are key in an early warning per-spective aimed at a preventive action.
We believe that the proposed model could substantially benefit from the application to other contexts, and comparison with other methods. For this purpose we underline that we have used data from an accessible repository (Bankscope), and that our model is imple-mented in the R software package BGEVA. Both the data and the software are therefore accessible and replicable.
In particular, it may be interesting to apply our model to banking systems where financial market data is available for a significant num-ber of institutions, and compare our results with market based implied probabilities of default. In the Italian system, this would not be fea-sible, as the number of listed banks is very small and has changed considerably over time.
Another possible extension of this paper is to embed it into a systemic risk modelling framework. This especially in the light of the fallacies of market-based models (see e.g. Idier et al. 2013). This would include modelling explicitly correlation between banks, arising from the unsecured interbank market or from common asset loans, in the same economical system. A possibility is to explore spatial regression models, as in Calabrese and Elkink (2012). Alternatively, our model can complement the simulation-based model of De Lisa et al. (2011).
Another extension could be, in a problem characterised by many potential explanatory variables, to allow for model uncertainty, rather than conditioning inferences on the single generalised linear model chosen. This would call for a GEV model averaged Bayesian analy-sis, following for instance the approach of Figini and Giudici (2013),
endowed with prior elicitation as suggested in Kenny et al. (2013).
Finally, an important extension would be to build a dy-namic GEV model, as in Gomez-Gonzalez and Kiefer (2007), so to understand how creditworthiness deteriorates in time, for example after stress events.
6
Acknowledgements
The Authors acknowledge useful comments and discussion at the Credit2013 conference in Venice and at the FEBS/LabEx ReFi 2013 conference in Paris.
They also acknowledge comments and suggestions by the anony-mous referees, that have helped improving the paper.
Finally, the Authors acknowledge financial support from the MIUR PRIN project MISURA: Multivariate statistical models for risk assess-ment.
7
References
Acharya V. V., Pedersen L. H., Philippon T. and Richardson M. (2010). Measuring systemic risk. Working paper, Federal Reserve of Cleveland.
Adrian T., Brunnermeier M. K. (2010). CoVaR. Technical report, Princeton University.
Agresti A. (2002). Generalised linear models. Wiley, New York. Altman E. (1968) Financial ratios, discriminant analysis and the prediction of corporate bankruptcy. The Journal of finance, 23 (4), 589-609.
Ashcraft A. B. (2008) Are bank holding companies a source of strength to their banking subsidiaries? Journal of Money, Credit and Banking 40, 273-294.
Arena M. (2008) Bank failures and bank fundamentals: A com-prarative analysis of Latin America and East Asia during the nineties using bank-level data. Journal of Banking and Finance 32, pp. 299-310.
Basel Committee on Banking Supervision (1988) International con-vergence of capital measurement and capital standards, Bank for In-ternational Settlement.
Basel Committee on Banking Supervision (2004) International con-vergence of capital measurement and capital standards: A revised framework, Bank for International Settlements.
Basel Committee on Banking Supervision (2011) A global regula-tory framework for more resilient banks and banking systems. Bank for International Settlements.
Berger A., De Young R., Flannery, M.J. , Lee, D. and Oztekin O. (2008) How do large banking organisations manage their capital ratios? Journal of financial services research, 34, 123-149.
Billio M., Getmansky M., Lo, A. and Pelizzon, L. (2012) Econo-metric measures of connectedness and systemic risk in the finance and insurance sector. Journal of Financial Economics, 104 (3), 535-559
Boyd J. H., De Nicolo G., Jalal A. M. (2009) Bank Competition, Risk, and Asset Allocations. International Monetary Fund, Working Paper.
Bongini P., Claessens S., Ferri G., (2001) The political economy of distress in east asian financial institutions. Journal of Financial Services Research 19 (1), 5-25.
Bongini P., Laeven, L. and Majnoni, G. (2002) How good is the market at assessing bank fragility? a horse race between different indicators. Journal of banking and finance 26, 1011-1028.
Brown C., Dinc I.S. (2009) Too many to fail? Evidence of Reg-ulatory Forbearance When the Banking Sector is Weak. Review of Financial Studies. 24 (4), 1378-1405.
Brownlees C.T., Engle, R.F. (2011). Volatility. correlation and tails for systemic risk measurement. Technical report, New York Uni-versity.
Brunnermeier M., Oehmke, M. (2012). Bubbles, Financial Crises, and Systemic Risk, NBER Working Papers 18398, National Bureau of Economic Research.
Buehler K., Samandari H., Mazingo, C. (2009). Capital ratios and financial distress: lessons from the crisis. McKinsey working papers on risk.
Calabrese R., Elkink J. A. (2012) Estimators of Binary Spatial Autoregressive Models: A Monte Carlo Study. Working Papers, Geary Institute, University College Dublin.
Calabrese R., Osmetti S. (2013) Modelling SME Loan Defaults as Rare Events: an Application to Credit Defaults. Journal of Applied Statistics 40 (6), 1172-1188.
Generalized Extreme Value Additive Models. R package version 0.1. Canbas S., Cabuk A., Kilic S.B. (2005) Prediction of commercial bank failure via multivariate statistical analysis of financial structures: the turkish case. European Journal of Operational research 166, 528-546.
Carapeto M., Moeller S., Faelten A., Vitkova, V. and Bortolotto, L. (2010). Distress classification measures in the banking sector. Tech-nical report, Cass Business School, City University of London.
Cole L., Gunther N. (1998). Predicting bank failures: a compari-son of on and off-site monitoring systems. Journal of financial services research, n.13, 103-117.
Davis E.P., Karim, D. (2008). Comparing early warning systems for banking crisis. Journal of financial stability 4, 89-120.
De Lisa, R., Zedda, S., Vallascas, F., Campolongo, F. and March-esi, M. (2011) Modelling deposit insurance scheme losses in a Basel 2 framework. Journal of financial services research, 40, 123-141.
Dowd K. (2002). Measuring Market Risk, John Wiley and Sons, Chichester.
Embrechts P., Klupelberg C. and Mikosch T. (1997) Modelling Extremal Events for Insurance and Finance, Springer Verlag, Berlin.
Fantazzini D., Maggi M. (2013) Computing Reliable Default Prob-abilities in Turbulent Times. In: Wehn, C. S., Hoppe C., Gregoriou G. N. (Eds.), Rethinking Valuation and Pricing Models, 241-255.
Giudici, P., Figini, S. (2009). Applied Data Mining for Business and Industry, Wiley, London.
Gomez-Gonzalez, J., Kiefer, N. M. (2009) Bank Failure: Evidence From the Colombian Financial Crisis. The International Journal of Business and Finance Research, 3, 15-31.
Figini S., Giudici P. (2011). Statistical merging of rating models, Journal of Operational Research Society 62(6), 10671074.
Figini S., Giudici P. (2013). Credit risk predictions with Bayesian model averaging. DEM Working Papers Series 034, University of Pavia, Department of Economics and Management.
Gonzalez-Hermosillo B. (1999) Determinants of Ex-Ante Banking System Distress: A Macro-Micro Empirical Exploration of Some Re-cent Episodes. IMF Working Paper n. 33.
Gup B.E. (1998) Bank failures in the Major trading countries of the world: causes and estimation. Quorum Books.
Hand D.J., Mannila H., Smyth P. (2001) Principles of Data Mining, MIT Press.
Hand D. J. (2009) Measuring classifier performance: a coherent alternative to the area under the ROC curve, Machine Learning 77, 103-123.
Hand D.J. (2010) Evaluating diagnostic tests: the area under the ROC curve and the balance of errors, Statistics in Medicine 29, 1502-1510.
Halaj G. (2013) Optimal asset strcuture of a bank. Bank reactions to stressful market conditions. ECB working papers n. 1533.
Hanley J. A., McNeil B.J. (1983) A method of comparing the areas under receiver operating characteristic curves from the same cases. Radiology, 148, 839-843.
Huang X., Zhou H. Zhu, H. (2011). Systemic risk contribution. Technical report, Board of Governors of the Federal reserve System.
Idier J., Lame’ G., Mesonnier, J.S. (2013) How useful is the marginal expected shortfall for the measurement of systemic exposure? a prac-tical assessment. Working paper series n. 1546, European Central Bank.
Kanno M. (2013) Credit migration forecasting and correlation be-tween business and credit cycles. Technical report, Kanagawa Univer-sity.
Kenny G., Kostka T., Masera, F. (2013) Can macroeconomist fore-cast risk? Event-based evidence from the Euro area. ECB working paper n. 1540.
King G., Zeng L. (2001). Logistic Regression in Rare Events Data. Political Analysis 9: 137-163.
Klomp J., de Haan J. (2012) Banking risk and regulations: does one size fit all? Journal of banking and finance, 36, pp. 3197-3212.
Koopman S.J., Lucas A., Schwaab, B. (2012) Dynamic factor mod-els with macro, frailty and industry effects for U.S. default counts: the credit crisis of 2008. Journal of business and economic statistics, 30, pp. 521-532.
Mannasoo K., Mayes D. G. (2009) Explaining bank distress in Eastern European transition economies. Journal of Banking and Fi-nance, 33 (2), 244-253.
Mare D.S. (2012) Contribution of macroeconomic factors to the prediction of small bank failures. Technical report, the University of Edinburgh.
Maurin L., Toivanen M. (2012) Risk, Capital Buffer and Bank Lending a Granular Approach to the Adjustment of Euro Area Banks. European Central Bank, Working Paper Series n. 1499.
McCullagh, P. and Nelder, J. (1989). Generalised linear models. Chapman and Hall, New York.
Memmel C., Raupach, P. (2010) How do banks adjust their capital ratios? Journal of Financial intermediation, 19, pp. 509-528.
Merton R.C. (1974). On the pricing of corporate debt: the risk sructure of interest rates. Journal of Finance 2, pp. 449-471.
Nocedal J., Wright S. J. (2006). Numerical Optimization. Springer-Verlag, New York.
Porath D. (2006) Estimating probabilites of default for German savings banks and cooperatives. Schmalenbach Business review, 58, pp. 214-233.
Resti A., Sironi A. (2007) Risk management and shareholders’ value in banking. Wiley.
Robin X., Turck N., Hainard A., Tiberti N., Lisacek F. Sanchez J., M¨uller M. (2011) pROC: an open-source package for R and S+ to analyze and compare ROC curves. BMC Bioninformatics, 12, 77-85.
Rose P.S., Kolari J.W. (1985) Early warning systems as a moni-toring device for bank condition. Quarterly journal of business and economics 24, 43-60.
Roth M. (1994) Too big to fail and the instability of the banking system: some insights from foreign countries. Business economics, 4, pp. 43-49.
Ruppert D., Wand M. P., Carroll R. J. (2003). Semiparametric Regression. Cambridge University Press, London.
Segoviano M.A., Goodhart C. (2009). Banking stability measures. IMF working paper.
Sinkey J.F. (1975). A multivariate statistical analysis for the char-acteristics of problem banks. Journal of Finance, 1, pp. 21-36
Smith R. L. (1985). Maximum likelihood estimation in a class of non-regular cases. Biometrika, 72, pp. 6790.
Tam K.Y., Kiang, M.Y. (1992) Managerial applications of neural networks: the case of bank failure predictions. Management Science n.7, pp. 926-947.
Vasicek O. A. (1984). Credit valuation. KMV corporation, March. Vazquez F., Federico, P. (2012) Bank funding structures and risk: evidence from the global crisis. International monetary fund working papers n. 29.
Wagner W. (2006) The liquidity of bank assets and banking sta-bility. Journal of Banking & Finance 31, 121-139.
for binary response data: an application to b2b electronic payments system adoption. The annals of applied statistics 4, pp. 2000-2023.