arXiv:1801.10089v2 [cond-mat.str-el] 29 Jun 2018
compound FePS3
C.R.S. HainesCavendish Laboratory, Cambridge University, J.J. Thomson Ave, Cambridge CB3 0HE, UK and Department of Earth Sciences, Cambridge University, Downing Street, Cambridge CB2 3EQ, UK
M.J. Coak
Cavendish Laboratory, Cambridge University, J.J. Thomson Ave, Cambridge CB3 0HE, UK Center for Correlated Electron Systems, Institute for Basic Science, Seoul 08826, Republic of Korea and
Department of Physics and Astronomy, Seoul National University, Seoul 08826, Republic of Korea
A. R. Wildes
Institut Laue-Langevin, 71 Avenue des Martyrs, 38042 Grenoble Cedex 9, France
G. I. Lampronti
Department of Earth Sciences, Cambridge University, Downing Street, Cambridge CB2 3EQ, UK
C. Liu and P. Nahai-Williamson
Cavendish Laboratory, Cambridge University, J.J. Thomson Ave, Cambridge CB3 0HE, UK
H. Hamidov
Cavendish Laboratory, Cambridge University, J.J. Thomson Ave, Cambridge CB3 0HE, UK Navoiy Branch of the Academy of Sciences of Uzbekistan, Galaba Avenue, Navoiy, Uzbekistan and National University of Science and Technology “MISiS”, Leninsky Prospekt 4, Moscow 119049, Russia
D. Daisenberger
Diamond Light Source, Chilton, Didcot OX11 0DE, UK
S.S. Saxena
Cavendish Laboratory, Cambridge University, J.J. Thomson Ave, Cambridge CB3 0HE, UK and National University of Science and Technology “MISiS”, Leninsky Prospekt 4, Moscow 119049, Russia
(Dated: July 2, 2018)
Two-dimensional materials have proven to be a prolific breeding ground of new and unstudied forms of magnetism and unusual metallic states, particularly when tuned between their insulating and metallic phases. In this paper we present work on a new metal to insulator transition system FePS3. This compound is a two-dimensional van-der-Waals antiferromagnetic Mott insulator. Here
we report the discovery of an insulator-metal transition in FePS3, as evidenced by x-ray diffraction
and electrical transport measurements, using high pressure as a tuning parameter. Two structural phase transitions are observed in the x-ray diffraction data as a function of pressure and resistivity measurements show evidence of the onset of a metallic state at high pressures. We propose models for the two new structures that can successfully explain the x-ray diffraction patterns.
I. INTRODUCTION
Recent and substantial interest in FePS3 stems from
the fact that, like graphite, FePS3 can be delaminated to give single layers. Its magnetic properties, and par-ticularly the Ising-like nature of its Hamiltonian, make the compound particularly promising as it maintains its bulk-like magnetic behaviour even for a single monolayer [1]. As the ab-planes of the metal ions are linked only
by van-der-Waals forces, the MPX3 family form model
two-dimensional antiferromagnetic systems, leading to a number of more recent publications on the magnetic structures [2–6] and even attracting the moniker ‘mag-netic graphene’ [7].
The family of compounds here designated MPX3,
where M represents a transition metal such as Fe, Ni or Mn and X = S or Se, are easily synthesised and have been widely categorized, historically due to interest in lithium intercalation between crystal planes to serve as a bat-tery material [8–18]. A comprehensive review is given by Grasso and Silipigni [19]. These materials all have very similar crystal structures and interactions, but subtly dif-fering magnetic properties across the metal elements due to the richness of the exchange couplings present. Crys-tallographic data from x-ray diffraction studies [10, 12] give a monoclinic unit cell with space group of C2/m and a honeycomb arrangement of the magnetic metal ions.
[19] with extremely high room-temperature resistivities (reflecting the high purity of samples that can be pro-duced) and band gaps in excess of 1 eV as determined by optical measurements [20]. A series of calculations of the band structure have been carried out [17, 21–23] but do not successfully reproduce the insulating state of these materials, predicting half-filled metallic bands. This leads to the conclusions that MPX3 are Mott
in-sulators, and as such could be driven to an insulator-metal or Mott transition by applying pressure to tune the band structure. FePS3 was chosen to investigate as
it has the lowest resistivity and band gap of the eas-ily synthesized compounds and was therefore assumed to require the least pressure to metallize. Initial evidence of metallic behaviour was first presented at the SCES2014 conference in 2014 by Haines et. al. [24] and then again independently by Tsurubayashi et. al. in 2017 [25]. The current letter is the first published report showing the metal-insulator transition in FePS3.
Substantial interest lies in tuning Mott insulators to-wards their metallization transition. The simple Hub-bard model traditionally used to describe such systems only yields solutions in the limiting metallic and insu-lating cases. Tuning the parameters of the system to an intermediate state accesses physics that is not yet fully understood. Additionally, many unconventional superconducting materials are low-dimensional and lie in close proximity to antiferromagnetic Mott insulator phases in their phase diagrams and theoretical calcula-tions [26] suggest that these states have a strengthening influence on the formation of superconductivity. Tun-able (for instance through pressure) antiferromagnetic two-dimensional Mott insulators then provide a rich and clean environment to probe the core mechanisms of sev-eral unsolved problems in condensed matter physics.
II. METHODS
High pressure XRD patterns were collected at room temperature at the Diamond Light Source on the I15 beamline. FePS3 is difficult to grind into an isotropic
powder. This is due to the fact that when put under strain the crystals tend to shear parallel to theab-planes leading to small platelets and therefore strong preferred orientation. This was mitigated by grinding in liquid nitrogen. The diamond anvil cell (DAC) was filled with powdered sample. No pressure transmitting medium was used. X-rays with an energy of 29.2 keV (λ= 0.4246 Å)
were used to collect the diffraction patterns. This is suf-ficiently high energy to pass through the diamond anvils. A MAR345 2D detector was used to record the diffrac-tion pattern with exposure times of between 15 s and 45 s. Pressure in the DAC was determined by measur-ing the shift in the fluorescence wavelength of ruby [27] spheres that were placed inside the high pressure region.
The data were initially processed using Dawn [? ] (with a LaB6 calibration) and the subsequent Rietveld
refine-ments were calculated using TOPAS-Academic [28]. Measurements of resistivity were performed using a Keithley 2410 Source Meter with a fixed supplied cur-rent of 0.01µA and verified on a Keithley Electrometer
at 40 V. As the current-voltage response of this sam-ple is not simply Ohmic, the same excitation was used throughout to allow comparison of data - but limiting the measurable range of resistances. Contact resistances to FePS3were found to be significant if precautions were
not taken - on order of MΩfor simple silver epoxy
elec-trical contacts, and with significant voltage dependence. To avoid this, the ambient pressure measurements were prepared with gold conducting pads evaporated onto the sample surface. In the Bridgman cells used for the high pressure resistivity measurements contact is formed by mechanically pressing Pt wires into the sample, which was seen to give good contact.
Measurements were performed in several Bridgman anvil cells [29] with both tungsten carbide and sintered diamond anvils. A steatite powder pressure medium was used in the Bridgman cells, leading to a uniaxial compo-nent (along the samplec∗-axis) of the pressure achieved,
as well as pressure gradients within the sample estimated at around 20%. The pressure in these cells is estimated from the load applied during pressurization.
Temperature control was achieved through an Oxford Instruments Heliox He-3 cryostat, an ICE Oxford 1 K pumped helium cryostat and an adiabatic demagneti-zation refrigerator developed in-house. Care was taken to vary temperatures slowly (typically a few Kelvin per hour) to allow the large thermal mass of the pressure cells to equilibrate.
III. RESULTS
It was clear upon observing the evolution of the diffrac-tion patterns, see Fig. 1, that there were two phase transitions. The first phase transition (PT1) at approx-imately 4 GPa and the second (PT2) at approxapprox-imately 14 GPa. The structure is known at ambient pressure (0 GPa), however, the high pressure structures were not known. The first task was therefore to produce physi-cally sensible models for the two unknown structures that could be used to fit the high pressure diffraction patterns. In both phase transitions new diffraction peaks develop while other peaks disappear. This allowed the identi-fication of monophasic diffraction patterns for all three phases: the pattern at 0 GPa corresponds to the low pres-sure (ambient prespres-sure) monoclinic C2/m phase [10, 12]; the one at 10.1 GPa to a high-pressure phase, here desig-nated HP I; finally, the pattern at 18.1 GPa corresponds to a second high-pressure phase, HP II. Assuming only that the structure doesn’t go through a major
reconstruc-FIG. 1. Raw data after calibration and integration. The data have been scaled to the low angle background (giving arbitrary intensity, see right y-axis) and then the offset set to the pressure at which the data were collected (shown on the left y-axis). The 0.0 GPa data has been truncated for the two highest intensity peaks to allow all the patterns to be plotted together. The two phase transitions can be seen to take place over the region coloured blue (PT1) and that coloured black (PT2). The three patterns that we identified as being monophase are labelled with their pressures. The wavelength of the x-rays wasλ= 0.4246 Å.
FIG. 2. Schematics showing the evolution of the structure of FePS3 with pressure. The three refined structures at their
corresponding pressures are drawn to scale. The Fe atoms are shown in brown, the P atoms are shown in purple, and the S atoms are shown in yellow. The views show different pro-jections of the same number of unit cells, hence the ’sulphur only’ figures show only those sulphurs between two adjacent ab planes. Also shown are all interatomic bonds for r <= 3.6 Angstroms. The figures were created using the VESTA software [30].
tion we can equate the lowest angle (highest d-spacing) peak at around a 2θof 3-4 ° in Fig. 1 to the interplanar distance. The details of the refinements can be found in the Supplementary Material.
Figure 2 shows views of the refined structures for the different phases. At ambient pressure, the sulphur atoms
150 200 250 300 Temperature (K) 0 0.5 1 1.5 2 2.5 Resistivity ( cm) 1012 FePS3 3 4 5 6 1/T (K-1) 10-3 20 22 24 26 28 30 ln( )
FIG. 3. Resistivityρof FePS3plotted against temperature at
ambient pressure. The inset plotsln(ρ) against the recipro-cal of temperature, showing good agreement with thermally activated Arrhenius-type behaviour.
form two-dimensional hexagonally-coordinated layers, and there is a close-packing coordination between the layers. The close packing is not visible in the view along the c∗-axis featuring all the atoms (view (b) for HP 0
in Fig. 2) because sulphur atoms are directly below Fe and P atoms, but is visible if only the sulphur atoms are shown (view (c) for HP 0 in Fig. 2). A shear of∼a/3
along thea-axis, however, preserves the close-packing be-tween the two sulphur layers while reducing the volume of the unit cell by putting the Fe atoms directly above one another, and likewise for the P atoms. This is apparent in the view alongc∗, shown in Fig. 2. The HP I structure
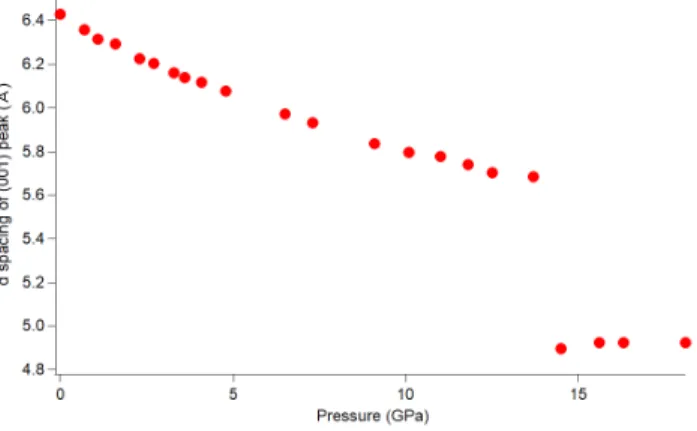
also appears to show some buckling of the sulphur layers, possibly due to strain. The buckling disappears at the higher pressure transition to HP II, where the structure adopts a higher symmetry. The pressure dependence of the interplanar distance is shown in Fig. 2(a). At the second phase transition there is a dramatic collape of the interplanar distance: from approximately 5.7 Å to 4.9 Å. This is a collapse of nearly 15 %. More detail can be found in the Supplementary Material.
The temperature dependence of the resistivity ρ of FePS3 in the absence of any applied pressure is plotted
in Fig. 3, from room temperature down to the tempera-ture when the resistance becomes too high to measure on the apparatus used. The resistivity values found match with the orders of magnitude observed previously [13] and are insulating in nature. The inset shows a fit of the resistivity to an Arrhenius-type thermally-activated conduction process across a fixed band gap ρ ∝ e
T0
T
-plottinglnρagainst 1
T will yield a straight line if this
re-lation holds, which is indeed seen in the graph, with some divergence towards the highest temperatures measured, potentially due to carrier saturation. The extracted band
gap, found from the gradient andT0,is then 0.452(1) eV.
The overall result matches that in previous studies [31], but in this reference an activation energy of 0.60(1) eV is quoted, and values up to 1.5 eV have been found from optical measurements [8]. Reasons for this mismatch are not clear, but there may be sample or orientation depen-dence. 0 100 200 300 Temperature (K) 100 105 1010 Resistance ( ) 4.0 GPa 0 100 200 300 Temperature (K) 102 103 104 Resistance ( ) 4.5 GPa 0 100 200 300 Temperature (K) 0 1 2 3 Resistance ( ) 5.5 GPa 0 100 200 300 Temperature (K) 0.1 0.15 0.2 Resistance ( ) 22.5 GPa a) c) b) d)
FIG. 4. Resistance of FePS3 against temperature for 4
in-creasing pressures, estimated as a) 4.0 GPa, b) 4.5 GPa, c) 5.5 GPa and d) 22.5 GPa. A transition from insulating to metallic behaviour is seen as pressure is increased, as well as an upturn in the resistivity at low temperatures in the high pressure measurements.
Two independent sets of measurements in the quasi-hydrostatic Bridgman anvil cells are shown in Fig. 4 and Fig. 5. In both cases the stated pressure values are estimates based on the external load applied to the cells
FIG. 5. Resistivity of FePS3 plotted against temperature, at
pressures from an estimated 3.0 GPa (blue, topmost) to 13.5 GPa (red) in a Bridgman anvil cell - reproducing the data shown in Fig. 4. The resistivity is drastically suppressed with applied pressure - note the logarithmic axis, and an upturn seen in the higher-pressure data.
0 50 100 150 200 250 300 Temperature (K) 0.8 1 1.2 1.4 1.6 1.8 2 Resistivity ( cm) 104 11.0 GPa T = 122.85 K 12.0 GPa T = 113.05 K 13.5 GPa T = 101.38 K FePS3 0 1 1.66 1.67 1.68 1.69 1.7 1.71 10 4 FePS3 12.0 GPa
FIG. 6. Detail of Fig. 5 - resistivity of FePS3 plotted against
temperature, at pressures from an estimated 11.0 GPa (blue, topmost) to 13.5 GPa (red) in a Bridgman anvil cell. Inset shows the low-temperature data at 12.0 GPa, which levels off or saturates at the lowest temperatures.
in pressurization, with a typical error of up to 20%. The lower-pressure data (Fig. 4 (a) and upper curves in Fig. 5) still show the ambient-pressure insulating temperature dependence, but increasing pressure drastically decreases the magnitude of the resistivity. At pressures above an estimated 5.0 GPa the resistivity begins to decrease with decreasing temperature - indicative of metallic behaviour. The application of pressure also leds to a decrease in the size of the resistivity by up to 8 orders of magnitude. Fig. 4 also appears to capture an intermediate state, where the insulator-metal transition is visible as a broad peak in the resistance around 180 K, but has moved outside of the measurable temperature range in subsequent pressure points.
In the higher-pressure data taken in Bridgman cells, shown in (c) and (d) of Fig. 4 and in Fig. 6, metallic (though sub-linear - perhaps semi-metallic) resistivity is observed at high temperatures. At lower temperatures however, an upturn in the resistivity is seen. This fea-ture should not be attributed to a simple insulating state, as the increase in resistivity as temperature decreases is slight and far from matching the exponential dependence of an Arrhenius or variable-range-hopping activated be-haviour, or the logarithmic dependence of the Kondo effect. The 12.0 GPa data, which were taken down to 100 mK (Fig. 6, inset), additionally show a levelling off or saturation of the resistivity as the temperature ap-proaches zero; this resembles the saturation effects com-monly seen in semiconductors. What can however be concluded from Fig. 5 is that as pressure is increased this upturn feature is suppressed in size and temperature scale. FePS3at ambient pressure orders
upturn may also have some connection to the magnetic properties of the compound at high pressure.
IV. DISCUSSION
The application of pressure changes the structure and electronic properties of FePS3. Through the analysis of
powder x-ray diffraction data under pressure we have discovered and produced models for two previously un-known phases of FePS3. The change from the ambient
pressure structure to HPI amounts to a shear of the unit cell by ∼a/3 along the a-axis. A shear between the ab
-planes with pressure seems feasible as the -planes are only weakly bound by van der Waals forces and they slide eas-ily over one another. Inspection of the stacking normal to the ab planes, i.e. along thec∗-axis, for the different
structures supports a coherent shear model.
Under ambient conditions, the layered van-der-Waals antiferromagnet FePS3 displays insulating behaviour,
with an electronic band gap around 0.5 eV, in agreement with previous studies. The application of comparatively low pressures, up to 2.0 GPa, has little effect on the resis-tivity but higher pressures reduce the sample’s resisresis-tivity values at a dramatic rate. In the quasi-hydrostatic Bridg-man cells, a reduction in sample resistance values from GΩto Ωranges is seen, and a resistance increasing with
temperature from pressures around 5.0 GPa, indicative of a metallic rather than insulating state. Electronic struc-ture calculations suggest FePS3 to be a Mott or
Charge-Transfer insulator, and this insulator-metal transition ob-served through applied pressure strongly supports this view. Additionally, in the metallic phase at pressures above the transition, an upturn in the resistivity is ob-served at temperatures below 150 K, suppressed with in-creasing pressure. The upturn could not be described by any common forms of exponential insulator type temper-ature dependencies or scattering mechanisms such as the Kondo effect. Further information into the band struc-ture and nastruc-ture of carriers in this high-pressure state is needed to properly understand this feature.
We show that FePS3 undergoes an insulator-metal
transition at high pressures and we are able to corre-late the electronic transition with concomitant changes in the crystallographic structure. The experiments are challenging, but the data are unambiguous and conclu-sive.
A strain or pressure induced transition to a metallic phase is not only relevant for the graphene community. The transition of a layered antiferromagnetic insulator to a conductor is also found in high-temperature super-conductors, which is a subject of long-standing interest. The electronic properties of high-temperature supercon-ductors are controlled by doping, and it is very diffi-cult to unravel the effects that come into play in non-stoichiometric systems. Our study suggests another
av-enue, as the application of pressure to a stoichiometric system provide causal relations that are far less ambigu-ous, and we believe that pressure studies on FePS3 may
also provide insight into the origins of high-temperature superconductivity.
ACKNOWLEDGEMENTS
This work was carried out with the support of the Di-amond Light Source and we thank Heribert Wilhelm for advice and help with the X-ray diffraction experiments at Diamond. The authors would like to thank G.G. Lon-zarich, P.A.C. Brown, S.E. Dutton, L.J. Spalek and D. Jarvis for their help and discussions. We would also like to acknowledge support from Jesus College of the Uni-versity of Cambridge, the Engineering and Physical Sci-ences Research Council, IHT KAZATAMPROM and the CHT Uzbekistan programme. The work was carried out with financial support from the Ministry of Education and Science of the Russian Federation in the framework of Increase Competitiveness Program of NUST MISiS (№ К2-2017-024). This work was supported by IBS-R009-G1.
[1] J. Lee, S. Lee, J. Ryoo, S. Kang, T. Kim, P. Kim, C. Park, J. Park, and H. Cheong, Nano Letters16, 7433 (2016).
[2] D. Lançon, H. Walker, E. Ressouche,
B. Ouladdiaf, K. Rule, G. McIntyre,
T. Hicks, H. Rønnow, and A. Wildes,
Physical Review B94(2016), 10.1103/physrevb.94.214407. [3] A. Wildes, V. Simonet, E. Ressouche, G.
McIn-tyre, M. Avdeev, E. Suard, S. Kimber,
D. Lançon, G. Pepe, B. Moubaraki, and et al., Physical Review B92(2015), 10.1103/physrevb.92.224408. [4] A. Wildes, K. Rule, R. Bewley, M. Enderle, and T. Hicks,
J. Phys.: Condens. Matter24, 416004 (2012).
[5] A. Wildes, H. Rønnow, B. Roessli,
M. Harris, and K. Godfrey,
Physical Review B74(2006), 10.1103/physrevb.74.094422. [6] A. Wildes, B. Roessli, B. Lebech, and K. Godfrey,
J. Phys.: Condens. Matter10, 6417 (1998). [7] J.-G. Park, 28, 301001 (2016).
[8] R. Brec, D. M. Schleich, G. Ouvrard, A. Louisy, and J. Rouxel, Inorganic Chemistry18, 1814 (1979). [9] K. Rule, G. McIntyre, S. Kennedy, and T. Hicks,
Phys. Rev. B76, 134402 (2007).
[10] G. Ouvrard, R. Brec, and J. Rouxel,
Materials Research Bulletin20, 1181 (1985).
[11] S. Kurosawa, K.and Saito and Y. Yamaguchi, Journal of the Physical Society of Japan52, 3919 (1983). [12] W. Klingen, G. Eulenberger, and H. Hahn,
Die Naturwissenschaften55, 229 (1968).
[13] K. Ichimura and M. Sano,
Synthetic Metals45, 203 (1991).
[14] P. Joy and S. Vasudevan,
[15] G. Le Flem, R. Brec, G.
Ou-vard, A. Louisy, and P. Segransan,
Journal of Physics and Chemistry of Solids43, 455 (1982).
[16] J. Rouxel, P. Molinie, and L. Top,
Journal of Power Sources9, 345 (1983).
[17] N. Kurita and K. Nakao,
Journal of the Physical Society of Japan58, 610 (1989).
[18] N. Kurita and K. Nakao,
Journal of the Physical Society of Japan58, 232 (1989).
[19] V. Grasso and L. Silipigni,
Rivista Del Nuovo Cimento25, 2002 (2002).
[20] V. Grasso, S. Santangelo, and M. Piacentini, Solid State Ionics20, 9 (1986).
[21] M. Whangbo, R. Brec, G. Ouvrard, and J. Rouxel, Inorganic Chemistry24, 2459 (1985).
[22] V. Zhukov, S. Alvarez, and D. Novikov,
Journal of Physics and Chemistry of Solids57, 647 (1996). [23] M. Piacentini, F. Khumalo, C. Olson, J. Anderegg, and
D. Lynch, Chemical Physics65, 289 (1982).
[24] C. R. S. Haines, M. J. Coak, P. Nahai-Williamson, C. Liu, and S. S. Saxena, inSCES2014, We-217 (2014) p. 788. [25] M. Tsurubayashi, K. Kodama, M. Kano, K. Ishigaki,
Y. Uwatoko, T. Watanabe, K.Takase, and Y. Takano, “Pressure dependence of electric resistivity of FePS3,” Nihon
University Science and Engineering Office, Academic Lecture Abstract Collection.
[26] P. Monthoux and G. Lonzarich,
Phys. Rev. B66, 224504 (2002).
[27] H. Mao, J. Xu, and P. Bell,
Journal of Geophysical Research91, 4673 (1986). [28] A. A. Coelho,TOPAS-Academic, Version 6 (2016). [29] J. Wittig, Zeitschrift fï¿œr Physik195, 215 (1966).
[30] K. Momma and F. Izumi,
Journal of Applied Crystallography44, 1272 (2011). [31] V. Grasso, F. Neri, S. Patane, L. Silipigni, and M.
Pia-centini, Phys. Rev. B42, 3, 1690 (1990).
[32] R. Allmann and R. Hinek,
Acta Crystallographica Section A63, 412 (2007).
[33] P. W. Stephens, Journal of Applied Crystallography32, 281 (1999).
[34] A. Boultif and D. Louër,
Journal of Applied Crystallography37, 724 (2004). [35] W. I. F. David, K. Shankland, J. van de Streek,
E. Pidcock, W. D. S. Motherwell, and J. C. Cole, Journal of Applied Crystallography39, 910 (2006). [36] C. R. Groom, I. J. Bruno, M. P. Lightfoot, and S. C.
Ward, Acta Crystallographica Section B72, 171 (2016).
SUPPLEMENTARY MATERIAL
A. Crystallography and solving the new structures
of FePS3
The first phase transition seems to lead to fewer peaks, suggesting higher symmetry, but as yet we still find the best match with a modified monoclinic C2/m structure. This is closely related to the starting structure, with the primary difference being a change in β from ∼107° to ∼90°. Additionally, the P-P distance increases, reflecting
the change in the atomic stacking along the c* axis. The P-P pairs are separated by a sulphur atom at 0 GPa,
FIG. S1. The interplanar distance is given by the (001) d spacing. This distance is reduced smoothly by applied pres-sure until the second phase transition at∼14 GPa when it
collapses dramatically. !"#$!% $! ! &'()'*+(,"-./0'(*1 2 ! $2 $! 2 3"-4)56))*1
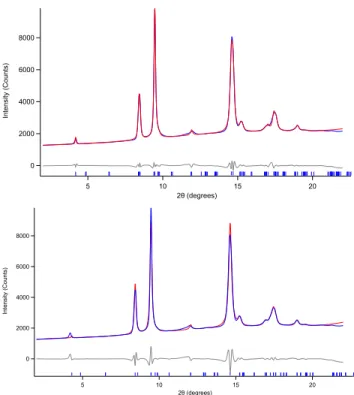
FIG. S2. Rietveld refinement plot of 0 GPa diffraction pattern with known C2/m structure showing experimental (blue), cal-culated (red) and difference (grey) curves. Reflection posi-tions are marked in blue. The large peak at approximately 22.5°is from the diamond anvils of the pressure cell. The re-gion immediately around the peak has been excluded from the fit. The wavelength of the x-rays wasλ= 0.4246 Å.
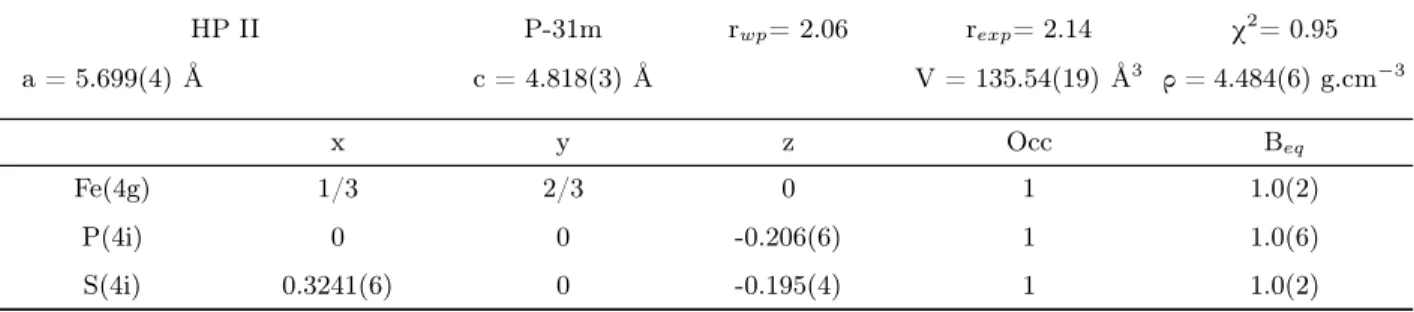
while the ab-planes have sheared at higher pressures such that this is no longer the case and P-P pairs form a chain along c*. The change in the c* stacking is shown in Fig.2. The second phase transition then leads to the closely related P-31m trigonal structure. The principal changes here are the increase in symmetry and the collapse of the interlayer spacing.
Rietveld refinements were performed using Topas V6. A shifted Chebyshev function with 6 parameters was used to fit the background. The Pseudo-Voigt function used to model the peak shape and the parameters describing the diffractometer geometry were first optimized using an LaB6 standard. These were fixed for the structural
refinements, while two isotropic parameters were used to take into account the sample Lorentzian contribution to peak broadening for size and microstrain respectively
un-Ouvrard 1985 C2/m R = 4% Rw= 5% a = 5.947(1) Å b = 10.300(1) Å c = 6.7222(8) Å β= 107.16(1) ° V = 393.3(2) Å3 x y z Occ Beq Fe(4g) 0 0.3326(1) 0 1 1.11(1) P(4i) 0.0566(3) 0 0.1692(3) 1 0.65(2) S(4i) 0.7501(3) 0 0.2470(3) 1 0.88(2) S(8j) 0.2488(2) 0.1655(1) 0.2485(2) 1 0.87(1)
TABLE S1. Refinement parameters from Ouvrard[10].
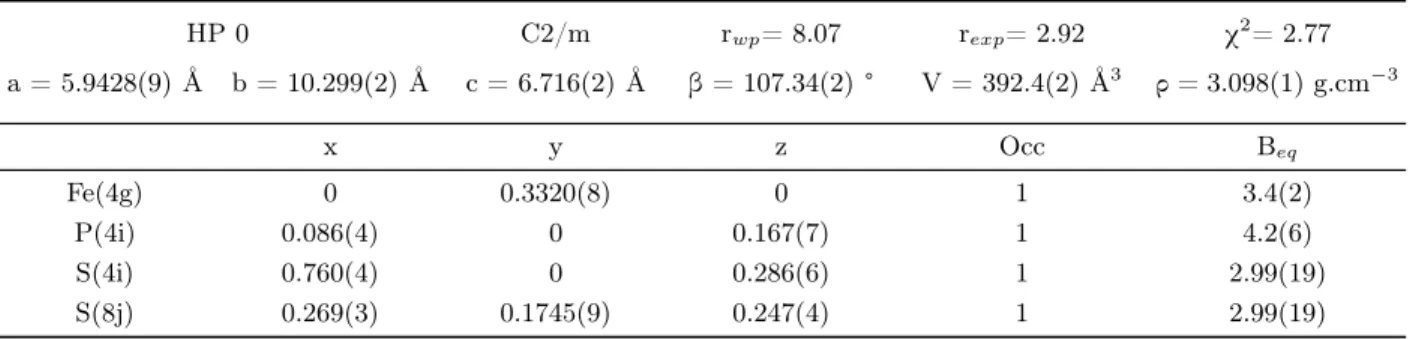
HP 0 C2/m rwp= 8.07 rexp= 2.92 χ 2 = 2.77 a = 5.9428(9) Å b = 10.299(2) Å c = 6.716(2) Å β= 107.34(2) ° V = 392.4(2) Å3 ρ= 3.098(1) g.cm−3 x y z Occ Beq Fe(4g) 0 0.3320(8) 0 1 3.4(2) P(4i) 0.086(4) 0 0.167(7) 1 4.2(6) S(4i) 0.760(4) 0 0.286(6) 1 2.99(19) S(8j) 0.269(3) 0.1745(9) 0.247(4) 1 2.99(19)
TABLE S2. Refined crystal structure parameters for the 0 GPa (HP 0) data.
!!! "!!! #!!! $!!! ! %&'(&)*'+,-./0&')1 $! 23 2! 3 $4,-5(67(()1
FIG. S3. Rietveld refinement plot of 10.1 GPa diffraction pat-tern with proposed C2/m structure for the 1st high pressure phase - HPI showing experimental (blue), calculated (red) and difference (grey) curves. Reflection positions are marked in blue. The wavelength of the x-rays wasλ= 0.4246 Å.
less otherwise stated. Structural parameters were refined with an anti-bump restraint for the P-P interatomic dis-tance. A minimum value of 0.1 Å2was set for the thermal
parameters (one for each atomic species). Goodness of fit indices, Rwpvalues and structural parameters at
conver-gence are reported in Tables S1 and S3. Final Rietveld refinement plots are shown in Figures S2, S3 and S4 re-spectively. The ambient FePS3crystal structure [10] was
retrieved from the ICSD [32] to fit the 0 GPa powder pattern. The March-Dollase model for preferred
!!! "!!! #!!! ! $%&'%()&*+,-./%&(0 #! 12 1! 2 #3+,4'56''(0
FIG. S4. Rietveld refinement plot of 18.1 GPa diffraction pat-tern with proposed P-31m structure for the 2nd high pressure phase - HPII showing experimental (blue), calculated (red) and difference (grey) curves. Reflection positions are marked in blue. The wavelength of the x-rays wasλ= 0.4246 Å.
tation was applied on the (0 0 1) crystallographic plane. An anisotropic model [33] for sample microstrain contri-bution was found to improve the fit significantly. The anisotropic broadening changes with increasing pressure (see Figure S2 from 8 to 10°) and it is likely to be related to stacking faults phenomena. We are currently work-ing on a stackwork-ing faults model that will describe these changes in detail. The RBragg was found to be 7.35 at
convergence. A few minor peaks disappear in the diffrac-tion patterns when pressure increases to 10 GPa (see the
HP I C2/m rwp= 2.45 rexp= 2.14 χ 2 = 1.15 a = 5.7620(12) Å b = 9.988(2) Å c = 5.803(5) Å β= 89.33(2) ° V = 333.3(3) Å3 ρ= 3.648(3) g.cm−3 x y z Occ Beq Fe(4g) 0 0.3225(13) 0 1 1.0(10) P(4i) 0 0 0.184(15) 1 0.1(12) S(4i) 0.638(4) 0 0.259(13) 1 0.1(6) S(8j) 0.127(2) 0.16239 0.299(8) 1 0.1(6)
TABLE S3. Refined crystal structure parameters for the HP I phase (10 GPa data).
HP II P-31m rwp= 2.06 rexp= 2.14 χ 2 = 0.95 a = 5.699(4) Å c = 4.818(3) Å V = 135.54(19) Å3 ρ= 4.484(6) g.cm−3 x y z Occ Beq Fe(4g) 1/3 2/3 0 1 1.0(2) P(4i) 0 0 -0.206(6) 1 1.0(6) S(4i) 0.3241(6) 0 -0.195(4) 1 1.0(2)
TABLE S4. Refined crystal structure parameters for the HP II phase (18 GPa data). 5 to 10°range in Fig.S3). Because of this apparent
in-crease in symmetry, indexing in cubic, hexagonal, trigo-nal, tetragonal and orthorhombic symmetries was exten-sively attempted on the 10 GPa diffraction pattern with the indexing algorithm DICVOL [34], which is included in the software DASH [35] from the CCDC suite[36]. One hexagonal unit cell was found to be rather convincing but a Pawley fit proved that it fails to fit the (0 0 1) peak properly (see Figure 1 in the SI). The pattern can instead be fitted with an orthorhombic C-centered unit cell (see Figure 1 in the SI). However, so far we have been unable to model the structure with an orthorhombic su-pergroup of C2/m. Therefore, our conclusion is that the HP I crystal structure is in fact monoclinic with the same space group as the 0 GPa crystal structure. We believe that the stacking faults model we are currently work-ing on could shed more light on the structural behaviour
during this phase transition. An 8th order spherical har-monics model for preferred orientation was found to be necessary to fit the peak intensities in this case. The
RBragg was found to be 0.47 at convergence. A Pawley
fit showed that the 18.1 GPa diffraction pattern could be fitted with the hexagonal unit cell identified during the indexing of the 10 GPa pattern. A manual determi-nation of systematic extinctions excluded any reflection condition. A structural model was built assuming that the layers would be perpendicular to [0 0 1] with the P atoms lying on the 3-fold axis and stack one onto the other without any shift on the a,b plane (see Fig.2). The space group P-31m, which has no systematic absences, was found to be compatible with this structural model. An 8th order spherical harmonics model for preferred ori-entation was used. The RBragg was found to be 0.44 at
!!! "!!! #!!! $!!! ! %&'(&)*'+,-./0&')1 $! 23 2! 3 $4,-5(67(()1 !!! "!!! #!!! $!!! ! %&'(&)*'+,-./0&')1 $! 23 2! 3 $4,-5(67(()1
FIG. S5. Pawley fit plot of 10.1 GPa diffraction pattern with the identified potential Cmmm (upper) and P3 (lower) sym-metries for the 1st high pressure phase - HPI showing exper-imental (blue), calculated (red) and difference (grey) curves. Reflection positions are marked in blue.