sciences
ArticleMyoglobin-Based Classification of Minced Meat
Using Hyperspectral Imaging
Hamail Ayaz1, Muhammad Ahmad2,* , Ahmed Sohaib1, Muhammad Naveed Yasir1 , Martha A. Zaidan3,* , Mohsin Ali1, Muhammad Hussain Khan1and Zainab Saleem1
1 Advance Image Processing Research Lab (AIPRL), Department of Computer Engineering,
Khwaja Freed University of Engineering and Technology (KFUEIT), Rahim Yar Khan 64200, Pakistan; [email protected] (H.A.); [email protected] (A.S.); [email protected] (M.N.Y.); [email protected] (M.A.); [email protected] (M.H.K.);
[email protected] (Z.S.)
2 Department of Computer Science, National University of Computer and Emerging Sciences, Islamabad, Chiniot-Faisalabad Campus, Chiniot 35400, Pakistan; [email protected]
3 Institute for Atmospheric and Earth System Research (INAR)/Physics, University of Helsinki, FI-00560 Helsinki, Finland
* Correspondence: [email protected] (M.A.); [email protected] (M.A.Z.) Received: 07 September 2020 ; Accepted: 25 September 2020 ; Published: 29 September 2020
Abstract: Minced meat substitution is one of the most common frauds which not only affects consumer health but impacts their lifestyles and religious customs as well. A number of methods have been proposed to overcome these frauds; however, these mostly rely on laboratory measures and are often subject to human error. Therefore, this study proposes novel hyperspectral imaging
(400–1000 nm) based non-destructiveisos-besticmyoglobin (Mb) spectral features for minced meat
classification. A total of 60 minced meat spectral cubes were pre-processed using true-color image formulation to extract regions of interest, which were further normalized using the Savitzky–Golay filtering technique. The proposed pipeline outperformed several state-of-the-art methods by achieving an average accuracy of 88.88%.
Keywords:hyperspectral imaging; myoglobin (Mb) spectral features;isos-besticpoints; substitution; Bovine (beef); Ovine (mutton); Poultry (chicken); minced meat; classification.
1. Introduction
Meat color is used to identify the different kinds of minced meat. Fresh meat that is protected from air contact (in vacuum packages, for instance) has a purple/red color which is the result of myoglobin’s (Mb’s) presence. Mb is one of the key pigments that are responsible for the color of meat. However, when the meat is exposed to air, Mb becomes oxy-Mb, which turns the meat a cherry red
color [1]. In minced meat, the protein pigment, i.e., Mb, is generally categorized into three stages:
dexo-myoglobin (DMb), meta-myoglobin (MMb) and oxy-myoglobin (OMb) [2]. Those states are
used to classify meat color, type and age by assessing the oxidation using the Lambert–Beer law application [3–6].
The similarities in the Mb pigments of different species, as shown in Table1, are used in the most
common food fraud known as "substitution." Substitution fraud not only affects the consumer’s
lifestyle but also religious practices, diet and health [7]. In 2013, the selling of horse-meat brought
a lot of attention to false labeling (substitution) issues in the meat industry [8]. Meat fraud is
usually done due for financial benefit; e.g., mutton is two times more costly than beef [9]; therefore,
selling beef in place of mutton will earn double the profit. Furthermore, meat fraud may cause
serious health issues, such as allergies [10], gastric cancer [11], type-2 diabetes [12] and death [13]
in some extreme cases. To counter the substitution fraud, several classification techniques have
been proposed, such as chromatography, drip loss, pH testing and DNA-based analysis [14–16].
However, these techniques require laboratory measures (manual operations) and are often subject
to human errors [17–19].
Table 1.Similarity percentage among red meat and Poultry Mb [20]. Species Beef Buffalo Sheep Goat Chicken
Beef 100
Buffalo 98.0 100
Sheep 98.7 96.7 100
Goat 97.4 95.4 98.7 100
Chicken 72.5 71.2 72.5 71.5 100
In addition to the traditional methods, multiple non-destructive imaging techniques (which only
work in a visible spectrum, i.e., color, texture and marbling) have also been proposed [21–23].
These techniques deal with fresh, cold and stored meat through chemo-metric and regression based classification models, such as partial least square regression (PLSR), linear regression (LR) and support
vector regression (SVR) [14,24,25]. However, imaging techniques (such as L*, a*, B*, chromatography
and gray level co-variance matrix (GLCM)) only work with limited color information by utilizing only visible spectrum range. In advance to these traditional technologies, hyperspectral imaging (HSI) not only provides information about the spatial distribution but also the spectral information by examining a wide range of the electromagnetic spectrum.
HSI has been used in remote sensing [26–28], and the medical and food industries [29,30]. HSI is
also being used for minced and whole meat-type classification [14,17,18,31,32]. For instance, Mahmoud
Al-Sarayreh et al. [33] used HSI for adulteration detection of chunk meat types, i.e., mutton, beef and
pork. These meat types were detected and classified using a support vector machine (SVM) and a convolutional neural network (CNN) with an accuracy of 94%. Furthermore, other meat properties,
such as color, texture, marbling and exudation, were also examined [34–36], and they classified the
pork meat as reddish pink (RFN), pale pinkish gray (PSE), pinkish firm (PFN), reddish soft (RSE)
and dark purplish red (DFD). Qiao et al. [34] also exploited all those properties to classify the pork
meat types using an artificial neural network (ANN) with an average accuracy of 78%–80%. Similarly,
in 2017, Velas et al. [31] proposed a method to classify the 35longissimus dorsibeef muscle samples
depending upon their marbling patterns using HSI. To score the high classification rate, each muscle was examined through the decision tree (DT) classifier with 99.00% accuracy and 0.08% classification
error. Barbon et al. [37] also used REPTree based on DT to identify and classify the chicken meat with
77.20% accuracy overall.
Minced meat classification has been examined by HSI-systems using regression-based models. For
instance, Mohammed Kamruzzaman et al. [14] presented a study-based on V-NIR region to investigate
the adulteration of horse meat in minced beef (Bovine) meat. The regression coefficients (R) were used to achieve the best calibration model with reduced dimensional data. The optimal PLSR model was
established with coefficients of determinationR2 = 0.99, 0.99, 0.98 for calibration, cross-validation
and prediction respectively. Ropodi et al. [25] proposed multispectral imaging-based detection of
minced beef (Bovine) adulteration with horse minced meat using 110 samples of mince beef (Bovine) and horse. Adulteration identification was carried out using RF, PLSR-DA and SVM classifiers with
an overall accuracy of 95.31%. Zhang et al. [38] used HSI-system in the V-NIR region to detect the
adulteration of carrageenan in minced chicken meat by using absorbance (A) and Kubelka–Munck (KM) spectrums. Based on PLSR classification results, absorbance spectra were found to perform best with a Root Mean Square Error of Prediction Set (RMSEP) of 0.48 and a coefficient of determination
for prediction data (R2p) of 0.92. Similarly, Rady et al. [39] proposed the effectiveness of hyperspectral
protein (TVP, beef and pork). The adulteration was estimated using a PLSR model to achieve a ratio between performance and deviation (RPD) of 0.69 for beef adulteration with pork and 0.93 for beef adulteration with TVP.
The aforementioned studies only used classical patterns of HSI, which affects the reliability of adulteration detection systems, as these highly depend upon the meat marbling and texture patterns. Moreover, they requires homogeneous samples which are subjected and hard to reproduce methods; e.g., a sample with inter-muscular fat can not be measured correctly if the system has been trained on a different texture pattern. This study presents two novel contributions. First, as per the author’s knowledge, for the very first time we have formulated a true-color image of HSI data to
correctly segment the meat images. Second, this study proposed a (isos-bestic) Mb-based spectral
feature classification method for minced meat to help in eradicating the substitution fraud from the meat industry.
2. Materials and Methods
This section describes the sample preparation, data acquisition, pre-processing, image correction and segmentation. The key steps of the methodology are listed below:
1. Meat sampling:Purchasing and mincing of Bovine/beef, Ovine/mutton and Poultry/chicken. To ensure no adulteration in minced meat types, proper cleaning of mixer is done every time, prior the mincing process.
2. HSI-sytem:Data acquisition using HSI system and calculation of reflectance and absorption. 3. Pre-processing:Formation of a true-color image to select the exact region of interest (ROI). 4. Spectral features:Extraction of intensity features through spectral characteristics of theisos-bestic
point of Mb pigments.
5. Classification:Classification of minced meat types using SVM.
2.1. Meat Sampling
In total, 60 samples (20 Bovine/beef, 20 Ovine/mutton and 20 Poultry/chicken) were acquired in 35 days in the months of November and December from a commercial abattoir in the of city Rahim Yar Khan, Pakistan, within 1 hour of slaughtering. The meat chunks were sealed in a zip-locker plastic bag and placed in an ice cooler box (0–4 deg C) to ensure the freshness of the meat. The meat was transported to the laboratory within 1 h of sample collection. Furthermore, to ensure equal volume and weight of each meat type, the gathered samples were minced using an electronic mincer with two cross blades for approx 5–7 s. During the mincing process, the mixer was properly cleansed after mincing each meat type. Finally, the minced meat was placed in the cylindrical container for data acquisition. The samples were measured using an HSI system after approximately 15 min intervals post-mincing. On the average, the complete data acquisition of each sample was done 2 h and 30 min postmortem. Moreover, in order to ensure that the Mb pigments’ values remained intact in fresh meat, it was important to perform the procedure in 2–4 h, or else the Mb pigments would have deteriorated
to form a darker brown color due to the longer exposure to oxygen [2].
2.2. Data Acquisition
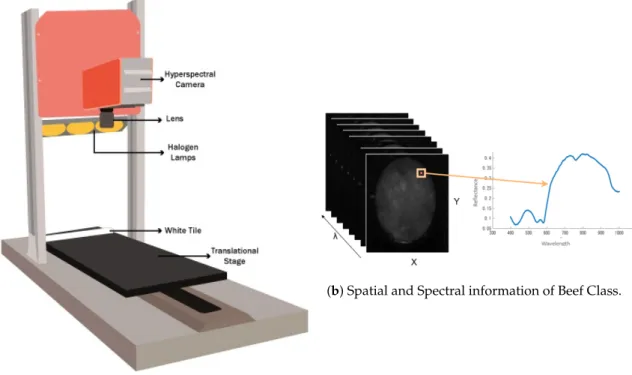
A push broom/line scanner HSI system (Specim Fx 10) was used in this study. The laboratory
setup is shown in Figure1a. This scanner was coupled with a 1.4/8 mm lens having a numerical
aperture of 1.7 and can capture the effective pixel size of 19.9×9.97µm with the spectral sampling
of 2.7 nm. HSI system was also coupled with a flat moving translational stage having a size of
21×40 cm. The system captures the visible and near infra-red (V-NIR) range of electromagnetic
spectrum (395–1000 nm). The other components attached to HSI system were 3 halogen lamps of 75 Watt light capacity and color temperature of 3350 kelvin and a laptop supported by data capturing
software (LUMO scanner) using a serial communication port via pleoraGigE–Visionconnector. Finally, to ensure the removal of ambient noise, the whole system was kept in a dark box.
(a) V-NIR Hyperspectral Imaging System.
(b) Spatial and Spectral information of Beef Class.
Figure 1.Laboratory protocol (Specim Fx 10) used in this study for minced meat data acquisition.
To ensure equal quantity for each sample, a glass cylindrical container was used to contain 65 g
of minced meat. During data acquisition the spatial binning was set as 2×2. The frame rate was
set as 60 fps while the exposure time was 16 ms. The translational stage moved with the speed of 25 mm/s which captured the composition of sample using row by row operation. The stage also
had aceramicwhite reference tile fixed at the start position of the translational medium and captured
100 rows for each sample. In addition, 100 rows of dark frame were also captured by using the closing of camera’s shutter.
Image Correction
The HSI system used in this study acquired 224 spectral bands (λ) with 789×512 spatial pixels
due to the acquisition software (Lumo Scanner), as shown in Figure1b. The spectral radiance cube
generated by the HSI system includes the sensor’s noise, illumination and several other atmospheric
effects (air particles, light effects, particle size, etc.), which can cause false results [40]. Therefore,
to exclude those effects, actual reflectance of the object was calculated by using the imperial line
method [41]. For reflectance calculation a dark and white reference is required to remove the
atmospheric effects. Thus, white referenceWwas captured by scanning a white tile and the dark
referencebwas captured by obscuring the camera lens fully using an opaque black cap. All the samples
were prepared in the same way using Equation (1).
R= Rad−b
W−b (1)
whereRis the normalized accurate reflectance cube;Radrepresents spectral radicance captured by
HSI-system, with 0% reflectance forband 99.9% forW. Furthermore, each minced meat spectrum
absorbs some portion of light, which cannot be observed through normal visualization [2,42]. Therefore,
A=log 1
R (2)
where Aand R represent absorption and accurate reflectance cube, respectively. The calculated
absorption spectrum represents the composition of chemical bonds; for instance, the 430 nm wavelength band contains information about absorption of hemoglobin pigments, the 500–600 nm one
about respiratory pigments and 760 nm, 940 nm and 996 nm about the second overtone of O–H [32,44]
in the minced meat spectrum.
2.3. Spatail-Spectral Pre-Processing
2.3.1. Spatial Pre-Processing
Generally, an HSI cube contains a rich amount of information, which is computationally complex. Therefore, the region of interest (ROI) needs to be extracted, and usually, in HSI systems a
random image is selected from all bands for this purpose [14,18]. The selected image needs further
image processing, for instance, image adjustment, binary thresholding or morphological operations, to extract ROI. Furthermore, the selected random band image may contain some extra information regarding some components of sample like muscular fat which can effect the segmentation. Therefore, the true-color image of each sample was formed for further processing.
True-Color Image:
To compute the true-color image, each visual region of accurate reflectance cube was divided
into three sub-regions,θR,θGandθBwith the segmentation wavelength ranges:R, 610–700 nm;G,
500–570 nm; andB, 450–500 nm [45]. Thus, for each segmented region, the correlation coefficient
ρ(X, Y)was computed by Equation (3).
ρ(X,Y) = C(X,Y)
σXσY (3)
whereρrepresents the correlation coefficient ofX,YandσX; andσYrepresents the standard deviation
ofXandY. The co-variance matrixCwas computed by Equation (4) [46].
C(X,Y) = 1 N N
∑
i=1 (Xi−µX)(Yi−µY) (4)whereµXandµYrepresent means ofXandY. The correlation coefficient returns a value in the range
of(−1, 1)—anti-correlation at−1 and high correlation at 1. The sum of the three highest average
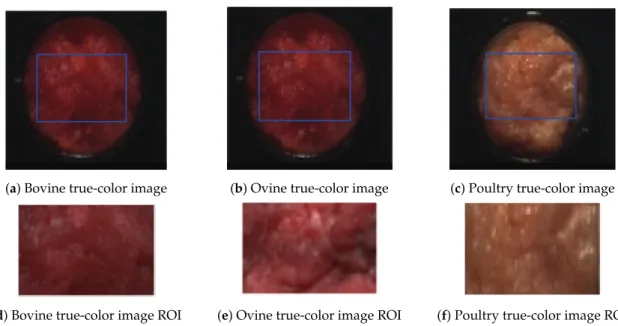
correlations, within the segmented regions, were coupled to produce a true-color image, as shown in
Figure2. Moreover, Figure2a–c shows the true-color images of Bovine, Ovine and Poultry minced
meat, which were reduced to the size of 159×165 for better visualization and understanding of the
reader and contain background of both the tray and the glass cylinder edges. Furthermore, other
methods use an illuminant to compute true-color images, such as CIE-D65 and CIE-D50 [2,17].
Finally, blob analysis technique was used to extract ROIs of each sample from true-color image, which analyzed the minced meat through color values, surrounding regions and brightness level. The detail color information of true-color image produced very precise and accurate ROIs as shown in
(a) Bovine true-color image (b) Ovine true-color image (c) Poultry true-color image
(d) Bovine true-color image ROI (e) Ovine true-color image ROI (f) Poultry true-color image ROI Figure 2.True-color images generated using correlation coefficient method and the generated ROIs. (a) Bovine minced meat; (b) Ovine minced meat; (c) Poultry minced meat; (d) Bovine ROI representation; (e) Ovine ROI representation; (f) Poultry ROI representation.
2.3.2. Spectral Pre-Processing
The segmented regions needs to be pre-processed due to highly sensitive natural properties
of light which generate random noises (size, shape and distribution of particles [47]) in the minced
meat spectrum. Therefore, to eliminate these noises, Savitzky–Golay Filtering [48] is applied to
the segmented region as a spectral pre-processing method. Golay filtering works by applying polynomial fitting to the input spectrum and preserve the spectral features rather than eliminating noise; i.e., low filtering can result in spectral noises and too much filtering can flatten the spectral response, which can alter the effects of classification. The effect of spectral smoothing can be seen in Figure3.
Figure 3.Comparison between pre-processed spectrum (Smoothing spectrum) and computed spectrum (normal spectrum) of Bovine minced meat.
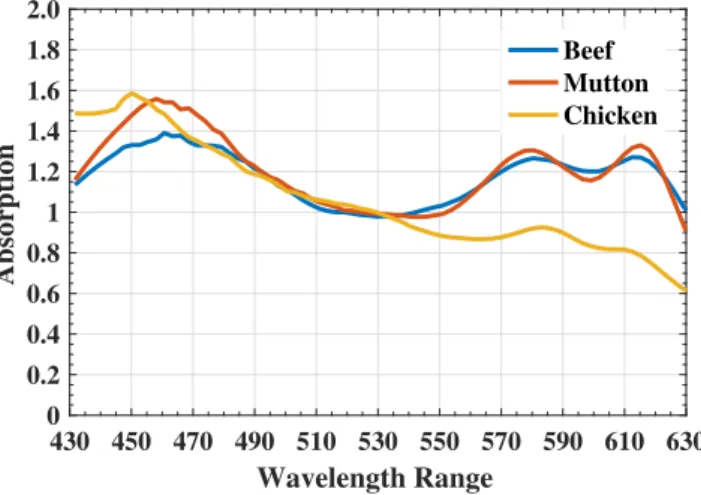
2.4. Spectral Features
After noise removal, the feature extraction process is carried out based on the Mb pigments found in the minced meat class. MetaMb (MMb), DexoMb (DMb) and OxyMb (OMb) represent protein
pigments which have a spectral intersection at wavelength of 525 nm [2]. This intersection point is
known as theisos-besticpoint of Mb pigment. Thisisos-besticpoint in Mb pigments can be utilized
to extract the spectral features for minced meat classification. The mathematical representation of
isos-besticfeature extraction is found in Equation (5):
Fi= Aλ
A49
(5)
where λ represents wavelength bands which are 224 in this study, the 49 band represents the
wavelength of 525 nm, A represents the absorption and Fi is the proposed feature extracted at
wavelengthλ. The sample spectral features for Bovine, Ovine and Poultry are shown in Figure4.
These spectral features are further utilized for model training.
430 450 470 490 510 530 550 570 590 610 630 Wavelength Range 0 0.2 0.4 0.6 0.8 1 1.2 1.4 1.6 1.8 2.0 Absorption Beef Mutton Chicken
Figure 4.A single point Mb-based spectral features spectrum for each meat class. Soret absorption band (430-450 nm), meta-Mb (500–515 nm), dexa-Mb (545–560 nm), oxa-Mb (580–610 nm).
2.5. Classification
To classify the minced meat into Bovine, Ovine and Poultry, total samples were divided into
training and test data with a ratio of 70% to 30%. In this study, non-linear SVM [49] has been used to
classify the minced meat types.
SVM is a linear model; however, it has been widely used to classify both linear and non-linear
problems [25]. The main idea of SVM is that it creates a hyperplane to divide the dataset into classes. For
linearly separable data, it finds the maximal margin hyperplane between the classes. For non-linearly separable data, it maps the feature data into a high-dimensional space to find the optimal separating hyperplane [50]. In a nutshell,ntraining samples can be represented as (xi,yi) withi=1, 2, 3, . . . ,n,
wherexeRk iskdimensional vector andyi e(1,−1) are the class labels. Furthermore, SVM uses a
set of functions to take the input data and transform it into required form, known as kernels. Thus, the kernel function needs to be selected very carefully while training a SVM classifier.
In this study, radial basis function (RBF) kernel function is used for SVM. The values of the two main parameters of RBF are set as gamma = 0.8 and C= 1.0. The trained model was further validated through blind classification of the test data.
3. Results and Discussion 3.1. Spectral Features Analysis
The spectral information of samples, captured from HSI system, was distributed among 224
wavelength bands for this study. Figure5shows the 24 spectral bands of acquired samples, spanning
over the 395–1000 nm range with the difference of 10 bands in each image. Figure5a shows Ovine,
Figure5b shows Bovine and Figure5c shows Poultry minced meat along with wavelength band
However, the wavelength ranging from 400 to 430 nm has very low spectral intensities due to the limitation of halogen lamps; i.e., these lamps formed a very low-intensity response in the blue region,
as shown in Figure5d. Therefore, these bands needed to be removed before the classification process.
(a) Ovine spectral images (b) Bovine spectral images
(c) Poultry spectral images
(d) Spectrum distribution of Halogen Lamp Figure 5. The entire electromagnetic spectrum of minced meat type. (a) Ovine spectral images; (b) Bovine spectral images; (c) Poultry spectral images; (d) spectrum distribution of halogen lamp.
True-color image contains the information about samples similar to what is collected by the human visual system. The correlation coefficient is used widely to compute the true-color images for
remote sensing data [45]. For this study the segmented regions (such asθR(Red),θG(green) andθB
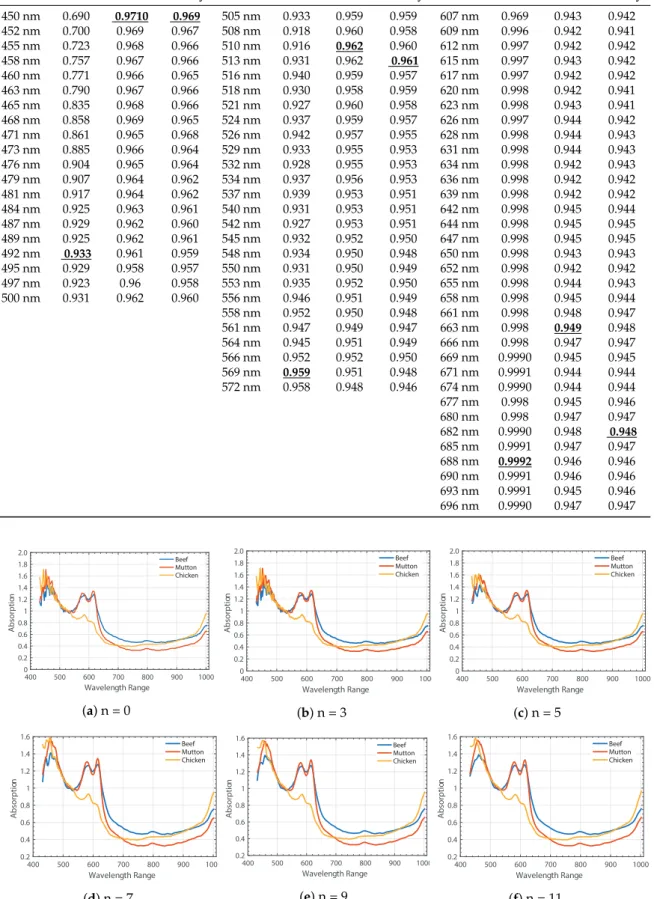
(blue)) have been examined for each band. The reflectance values are used to compute the correlation values. The highest value represents the most important wavelength in the segmented region; e.g., for Bovine minced meat, 492, 569 and 688 nm bands were selected based on the correlation values,
as shown in Table2.
Figure6a shows the Mb spectral patterns of each minced meat which contains the Mb pigments at
the range of 470–630 nm and oxidation levels at 760–1000 nm. The acquired spectrum contains random
noises which affect the classification results; thus, Figure6b–f shows the Golay filtering results for
noise removal. It can be clearly seen that degree of polynomial and window size (n) must be selected appropriately to acquire the noise-free Mb pigments. Window size 7 and 9 smooths the spectral features
like dexa-Mb and oxa-Mb, as shown in Figures6d,e; however, the ambient noises are still visible in
the range of 430–510 nm which contains the critical information of meta-Mb and soret absorption.
Thus, these ambient noises are removed with the window size 11 for golay filtering. Figure6f shows
Table 2.The correlation values for true-color images. The underlined boldface values show the selected wavelengths (ñm) used to formulate true-color images
.
Band # θB Band # θG Band # θR
Bovine Ovine Poultry Bovine Ovine Poultry Bovine Ovine Poultry
450 nm 0.690 0.9710 0.969 505 nm 0.933 0.959 0.959 607 nm 0.969 0.943 0.942 452 nm 0.700 0.969 0.967 508 nm 0.918 0.960 0.958 609 nm 0.996 0.942 0.941 455 nm 0.723 0.968 0.966 510 nm 0.916 0.962 0.960 612 nm 0.997 0.942 0.942 458 nm 0.757 0.967 0.966 513 nm 0.931 0.962 0.961 615 nm 0.997 0.943 0.942 460 nm 0.771 0.966 0.965 516 nm 0.940 0.959 0.957 617 nm 0.997 0.942 0.942 463 nm 0.790 0.967 0.966 518 nm 0.930 0.958 0.959 620 nm 0.998 0.942 0.941 465 nm 0.835 0.968 0.966 521 nm 0.927 0.960 0.958 623 nm 0.998 0.943 0.941 468 nm 0.858 0.969 0.965 524 nm 0.937 0.959 0.957 626 nm 0.997 0.944 0.942 471 nm 0.861 0.965 0.968 526 nm 0.942 0.957 0.955 628 nm 0.998 0.944 0.943 473 nm 0.885 0.966 0.964 529 nm 0.933 0.955 0.953 631 nm 0.998 0.944 0.943 476 nm 0.904 0.965 0.964 532 nm 0.928 0.955 0.953 634 nm 0.998 0.942 0.943 479 nm 0.907 0.964 0.962 534 nm 0.937 0.956 0.953 636 nm 0.998 0.942 0.942 481 nm 0.917 0.964 0.962 537 nm 0.939 0.953 0.951 639 nm 0.998 0.942 0.942 484 nm 0.925 0.963 0.961 540 nm 0.931 0.953 0.951 642 nm 0.998 0.945 0.944 487 nm 0.929 0.962 0.960 542 nm 0.927 0.953 0.951 644 nm 0.998 0.945 0.945 489 nm 0.925 0.962 0.961 545 nm 0.932 0.952 0.950 647 nm 0.998 0.945 0.945 492 nm 0.933 0.961 0.959 548 nm 0.934 0.950 0.948 650 nm 0.998 0.943 0.943 495 nm 0.929 0.958 0.957 550 nm 0.931 0.950 0.949 652 nm 0.998 0.942 0.942 497 nm 0.923 0.96 0.958 553 nm 0.935 0.952 0.950 655 nm 0.998 0.944 0.943 500 nm 0.931 0.962 0.960 556 nm 0.946 0.951 0.949 658 nm 0.998 0.945 0.944 558 nm 0.952 0.950 0.948 661 nm 0.998 0.948 0.947 561 nm 0.947 0.949 0.947 663 nm 0.998 0.949 0.948 564 nm 0.945 0.951 0.949 666 nm 0.998 0.947 0.947 566 nm 0.952 0.952 0.950 669 nm 0.9990 0.945 0.945 569 nm 0.959 0.951 0.948 671 nm 0.9991 0.944 0.944 572 nm 0.958 0.948 0.946 674 nm 0.9990 0.944 0.944 677 nm 0.998 0.945 0.946 680 nm 0.998 0.947 0.947 682 nm 0.9990 0.948 0.948 685 nm 0.9991 0.947 0.947 688 nm 0.9992 0.946 0.946 690 nm 0.9991 0.946 0.946 693 nm 0.9991 0.945 0.946 696 nm 0.9990 0.947 0.947 400 500 600 700 800 900 1000 Wavelength Range 0 0.2 0.4 0.6 0.8 1 1.2 1.4 1.6 1.8 2.0 Ab so rp ti on Beef Mutton Chicken (a) n = 0 400 500 600 700 800 900 1000 Wavelength Range 0 0.2 0.4 0.6 0.8 1 1.2 1.4 1.6 1.8 2.0 Ab sorp tio n Beef Mutton Chicken (b) n = 3 400 500 600 700 800 900 1000 Wavelength Range 0 0.2 0.4 0.6 0.8 1 1.2 1.4 1.6 1.8 2.0 Ab sorp tio n Beef Mutton Chicken (c) n = 5 400 500 600 700 800 900 1000 Wavelength Range 0.2 0.4 0.6 0.8 1 1.2 1.4 1.6 Ab sorp tio n Beef Mutton Chicken (d) n = 7 400 500 600 700 800 900 1000 Wavelength Range 0.2 0.4 0.6 0.8 1 1.2 1.4 1.6 Ab sorp tio n Beef Mutton Chicken (e) n = 9 400 500 600 700 800 900 1000 Wavelength Range 0.2 0.4 0.6 0.8 1 1.2 1.4 1.6 Ab sorp tio n Beef Mutton Chicken (f) n = 11
Figure 6. Savitzky–Golay spectral Pre-processing with several window sizes (n) for smooth Mb spectrum.
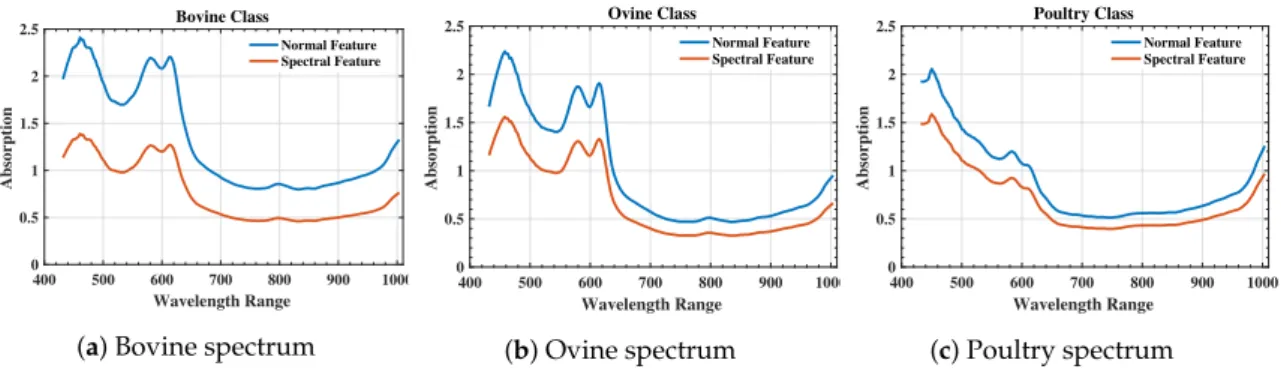
The mean spectral features extracted from Mb spectra through pre-processing and classical
absorption spectrum for each minced meat are shown in Figures7a–c. The Mb spectral feature
difference within the intensity values from the classical absorption spectral methods can be observed in these images. The intensity spectrum variation for Bovine and Ovine meat classes is high due to the presence of high Mb values, whereas it is considerably lower in poultry minced meat. The combined
spectra of each class indicates a clear difference in the range of the spectrum, as shown in Figure6f.
400 500 600 700 800 900 1000 Wavelength Range 0 0.5 1 1.5 2 2.5 Absorption Bovine Class Normal Feature Spectral Feature
(a) Bovine spectrum
400 500 600 700 800 900 1000 Wavelength Range 0 0.5 1 1.5 2 2.5 Absorption Ovine Class Normal Feature Spectral Feature (b) Ovine spectrum 400 500 600 700 800 900 1000 Wavelength Range 0 0.5 1 1.5 2 2.5 Absorption Poultry Class Normal Feature Spectral Feature (c) Poultry spectrum Figure 7.Difference in spectrum representations of Mb-based spectral features (spectral features) and classical absorption feature (normal Feature) of Bovine, Ovine and Poultry class minced meat. 3.2. Meat-Type Classification
For classification, non linear SVM was trained on 60×50×211 = 633, 000 features extracted from
each sample category (Bovine, Ovine and Poultry). A total of 14 ROIs giving (14×633, 000 = 8, 862, 000)
features were randomly chosen from each minced meat class, which were further split into 70:30 ratio as training and testing data. To compute the classification average accuracy, the following method was adopted.
Accuracy= T.P
T.S (6)
whereT.PandT.Srepresent the true predictions and the total number of samples, respectively. Table3
shows the training accuracy of the SVM classifier by using Mb based spectral features, with the average accuracy of 0.985.
Table 3.Confusion matrix of the training set. Class Ovine Poultry Bovine
Ovine 0.98 0 0.02
Poultry 0 0.994 0.006
Bovine 0.023 0 0.977
Average Accuracy: 98.5
Finally, to validate the results, 11, 394, 000 features from 18 different minced meat samples were tested containing 6 samples from each meat type and achieved an overall accuracy of 0.888, as shown
in Table4. Figures8–12represent the pictorial classification results of our proposed spectral pattern,
whereas Figure9represents the ground truth of the each mined meat. Figure10shows the classification
results of Bovine minced meat, Figure11represents the Ovine minced meat and Figure12contains the
poultry minced meat classification results. Furthermore, to make the predictions between Bovine and Ovine, a minimum of 70% for the threshold was considered to be optimal. The individual threshold
values for each minced meat class can be observed in Table5, where Bovine= class 1, Poultry = class 2
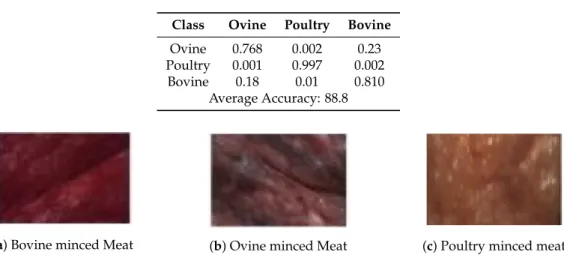
Table 4.Confusion matrix of the test set. Class Ovine Poultry Bovine Ovine 0.768 0.002 0.23 Poultry 0.001 0.997 0.002
Bovine 0.18 0.01 0.810 Average Accuracy: 88.8
(a) Bovine minced Meat (b) Ovine minced Meat (c) Poultry minced meat Figure 8.Color ROI representation of each minced meat type. (a) Bovine; (b) Ovine; (c) Poultry
(a) Bovine class (b) Ovine class (c) Poultry class
Figure 9.Ground truth representations for classification of minced meat types. (a) Bovine class; (b) Ovine class; and (c) Poultry class.
(a) Acc = 0.980 (b) Acc = 0.951 (c) Acc = 0.929 (d) Acc = 0.975 (e) Acc =0.833 (f) Acc = 0.209 Figure 10.Classification results for the Bovine minced meat class. Spots in Bovine minced meat class represent spectral misclassifications of Ovine minced meat class and Acc represents the accuracy of the Bovine class for each sample.
(a) Acc = 0.963 (b) Acc = 0.998 (c) Acc = 0.783 (d) Acc = 0.811 (e) Acc = 0.814 (f) Acc = 0.232 Figure 11.Classification results for the Ovine minced meat class. Spots in ovine minced meat class represent the spectral misclassifications of Bovine minced meat class and Acc represents the accuracy of the Ovine class for each sample.
(a) Acc = 1.00 (b) Acc = 1.00 (c) Acc = 1.00 (d) Acc = 1.00 (e) Acc = 0.9996 (f) Acc = 0.991 Figure 12.Classification results for the poultry minced meat class. Spots in poultry minced meat class represent the spectral misclassifications of Bovine and Ovine minced meat classes and Acc represents the accuracy of the poultry class for each sample.
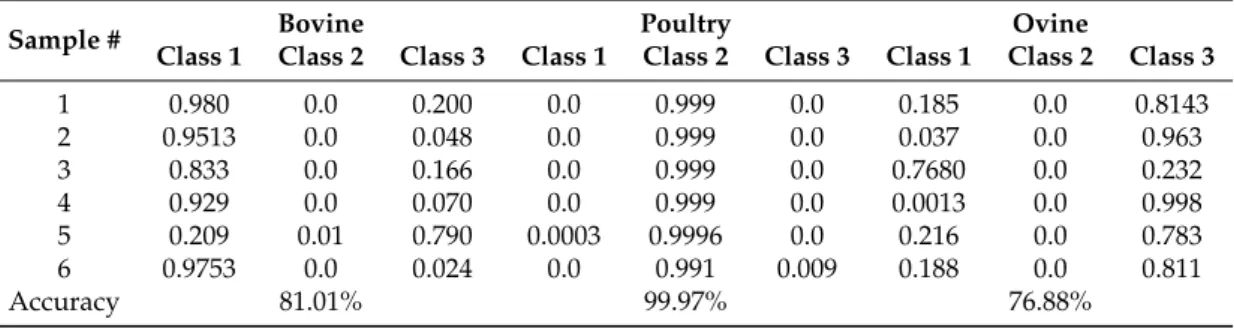
Table 5.Bovine, Ovine and Poultry minced meat classification performance; class1, class2 and class3 represent Bovine, Poultry and Ovine, respectively.
Sample # Bovine Poultry Ovine
Class 1 Class 2 Class 3 Class 1 Class 2 Class 3 Class 1 Class 2 Class 3
1 0.980 0.0 0.200 0.0 0.999 0.0 0.185 0.0 0.8143 2 0.9513 0.0 0.048 0.0 0.999 0.0 0.037 0.0 0.963 3 0.833 0.0 0.166 0.0 0.999 0.0 0.7680 0.0 0.232 4 0.929 0.0 0.070 0.0 0.999 0.0 0.0013 0.0 0.998 5 0.209 0.01 0.790 0.0003 0.9996 0.0 0.216 0.0 0.783 6 0.9753 0.0 0.024 0.0 0.991 0.009 0.188 0.0 0.811 Accuracy 81.01% 99.97% 76.88%
3.3. Comparison With State-of-the-Art PCA Models
Table6presents the comparative results with state-of-the-art classical spectral pre-processing
methods on minced meat test data. To ensure correct comparison, the hyper-parameters were optimized
according to the proposed studies in the literature [25,32,51]. The classical pre-processing methods
evaluate the response of test data through PCA, which in this study gave the overall accuracy of 82.01%.
However, by utilizing the pipeline proposed by Ropodi et al. [25] the accuracy achieved was 94.00%.
This proposed pipeline consists of two stages; at stage 1 the accuracy was 82.01%, whereas it increased to 94.00% in stage 2 due the correct classification of misclassified samples by increasing the train set using correctly classified samples. Moreover, the proposed pre-processing and Mb spectral features for the minced meat classification method outperformed several classical methods by achieving the overall accuracy of 88.88%.
Table 6.Comparative results with the state-of-the-art methods using same test data.
Feature Classifier Optimization Accuracy
Reflectance Spectrum + PCA [32] SMO rbf ; Tolerance=0.001; C=1.0 82.01% Reflectance Spectrum + PCA [25] 2-Step SVM rbf ; Tolerance=0.001; C=1.0 94.00% Reflectance + PCA + GLGCM [51] SVM rbf ;Tolerance=0.001; C=1.0 72.22%
Proposed Methodology
Spectral Features SVM rbf ; Tolerance=0.001; C=1.0 88.88%
4. Conclusions
This study formulates true-color images to extract accurate ROIs similar those from human
perception. This study also proposed a novelisos-bestic based Mb spectral features extraction for
minced meat (Bovine, Ovine and Poultry) using an HSI-system. The extracted features describe the formation of proteins pigments, i.e., the chemical composition of meat respiratory pigments. These extracted features are later fed to a nonlinear SVM classifier for the classification of minced meat. The experimental results reveal that the proposed pipeline significantly improves the performance as compared to the state-of-the-art methods. The classical methods use spectral features such as reflectance
and absorption to classify thechunkmeat types, whereas in this study, we usedisos-bestic-based Mb
spectral features for minced meat-type classification with an average accuracy of 88.88%. The future direction of our study is to analyze the classification accuracy based on several deep architectures, such as AlexNet, ResNet, DesNet and GoogleNet.
Author Contributions:Conceptualization, H.A., M.A. (Muhammad Ahmad), A.S., M.N.Y., M.A. (Mohsin Ali) and M.H.K.; data curation, H.A., M.A. (Muhammad Ahmad) and Z.S.; formal analysis, H.A.; investigation, H.A. and M.A. (Muhammad Ahmad); methodology, H.A., M.A. (Muhammad Ahmad), A.S. and M.A.Z.; supervision, M.A. (Muhammad Ahmad) and A.S.; validation, H.A., M.A. (Muhammad Ahmad), M.N.Y. and Z.S.; visualization, H.A., M.A. (Muhammad Ahmad), M.N.Y., M.A. (Mohsin Ali), M.H.K. and Z.S.; writing—original draft, H.A., M.A. (Muhammad Ahmad), M.A.Z., M.H.K. and Z.S.; writing—review and editing, H.A., M.A. (Muhammad Ahmad),
A.S., M.N.Y., M.A.Z., M.A. (Mohsin Ali), M.H.K. and Z.S. All authors have read and agreed to the published version of the manuscript.
Funding:“This research received no external funding”
Conflicts of Interest:“The authors declare no conflict of interest.”
Declaration of Competing Interest: KFUEIT plans to file a patent based on this work, in which H. Ayaz, M. Ahmad and A. Sohaib are inventors.
References
1. The Color of Meat and Poultry. Available online: https://www.fsis.usda.gov/wps/portal/fsis/topics/food-safety-education/get-answers/food-safety-fact-sheets/meat-preparation/the-color-of-meat-and-poultr y/the-color-of-meat-and-poultry/ct_index#:~:text=When%20meat%20is%20fresh%20and,a%20pleasing ly%20cherry%2Dred%20color.(accessed on 19 August 2020).
2. American Meat Science Association;AMSA Meat Color Measurement Guidelines: AMSA; American Meat Science Association: Savoy, IL, USA, 2012.
3. Tang, J.; Faustman, C.; Hoagland, T. Krzywicki revisited: Equations for spectrophotometric determination of myoglobin redox forms in aqueous meat extracts.J. Food Sci.2004,69, C717–C720. [CrossRef]
4. Viriyarattanasak, C.; Hamada-Sato, N.; Watanabe, M.; Kajiwara, K.; Suzuki, T. Equations for spectrophotometric determination of relative concentrations of myoglobin derivatives in aqueous tuna meat extracts.Food Chem. 2011,127, 656–661. [CrossRef]
5. Cheng, L.; Liu, G.; He, J.; Wan, G.; Ma, C.; Ban, J.; Ma, L. Non-destructive assessment of the myoglobin content of Tan sheep using hyperspectral imaging.Meat Sci.2019,167, 107988. [CrossRef] [PubMed] 6. Wu, S.; Luo, X.; Yang, X.; Hopkins, D.L.; Mao, Y.; Zhang, Y. Understanding the development of color and
color stability of dark cutting beef based on mitochondrial proteomics.Meat Sci.2020,163, 108046. [CrossRef] [PubMed]
7. Ballin, N.Z. Authentication of meat and meat products.Meat Sci.2010,86, 577–587. [CrossRef] [PubMed] 8. Stanciu, S.; Stanciuc, N.; Dumitrascu, L.; Ion, R.; Nistor, C. The effects of horse meat scandal on Romanian
meat market.SEA-Pract. Appl. Sci.2013,1, 174–181.
9. Cawthorn, D.M.; Steinman, H.A.; Hoffman, L.C. A high incidence of species substitution and mislabelling detected in meat products sold in South Africa.Food Control2013,32, 440–449. [CrossRef]
10. Bottero, M.T.; Dalmasso, A. Animal species identification in food products: Evolution of biomolecular methods.Vet. J.2011,190, 34–38. [CrossRef]
11. Zhu, H.; Yang, X.; Zhang, C.; Zhu, C.; Tao, G.; Zhao, L.; Tang, S.; Shu, Z.; Cai, J.; Dai, S.; et al. Red and processed meat intake is associated with higher gastric cancer risk: a meta-analysis of epidemiological observational studies.PLoS ONE2013,8, e70955. [CrossRef]
12. Barnard, N.; Levin, S.; Trapp, C. Meat consumption as a risk factor for type 2 diabetes. Nutrients2014, 6, 897–910. [CrossRef]
13. Sinha, R.; Cross, A.J.; Graubard, B.I.; Leitzmann, M.F.; Schatzkin, A. Meat intake and mortality: A prospective study of over half a million people.Arch. Internal Med.2009,169, 562–571. [CrossRef] [PubMed]
14. Kamruzzaman, M.; Makino, Y.; Oshita, S.; Liu, S. Assessment of visible near-infrared hyperspectral imaging as a tool for detection of horsemeat adulteration in minced beef.Food Bioprocess Technol.2015,8, 1054–1062. [CrossRef]
15. Ahmed, M.U.; Hasan, Q.; Hossain, M.M.; Saito, M.; Tamiya, E. Meat species identification based on the loop mediated isothermal amplification and electrochemical DNA sensor.Food Control2010,21, 599–605. [CrossRef]
16. Vallejo-Cordoba, B.; González-Córdova, A.F.; Mazorra-Manzano, M.A.; Rodríguez-Ramírez, R. Caillary electrophoresis for the analysis of meat authenticity.J. Sep. Sci.2005,28, 826–836. [CrossRef] [PubMed] 17. ElMasry, G.; Barbin, D.F.; Sun, D.W.; Allen, P. Meat quality evaluation by hyperspectral imaging technique:
an overview.Crit. Rev. Food Sci. Nutr.2012,52, 689–711. [CrossRef] [PubMed]
18. Kamruzzaman, M.; ElMasry, G.; Sun, D.W.; Allen, P. Application of NIR hyperspectral imaging for discrimination of lamb muscles.J. Food Eng.2011,104, 332–340. [CrossRef]
19. Ma, J.; Sun, D.W.; Pu, H.; Cheng, J.H.; Wei, Q. Advanced techniques for hyperspectral imaging in the food industry: Principles and recent applications.Ann. Rev. Food Sci. Technol.2019,10, 197–220. [CrossRef]
20. Suman, S.P.; Joseph, P. Myoglobin chemistry and meat color. Ann. Rev. Food Sci. Technol.2013,4, 79–99. [CrossRef]
21. Denoyelle, C.; Berny, F. Objective measurement of veal color for classification purposes. Meat Sci. 1999, 53, 203–209. [CrossRef]
22. Fletcher, D. Broiler breast meat color variation, pH, and texture.Poult. Sci.1999,78, 1323–1327. [CrossRef] 23. Xing, J.; Ngadi, M.; Gunenc, A.; Prasher, S.; Gariepy, C. Use of visible spectroscopy for quality classification
of intact pork meat.J. Food Eng.2007,82, 135–141. [CrossRef]
24. Liu, Y.; Chen, Y.R. Analysis of visible reflectance spectra of stored, cooked and diseased chicken meats. Meat Sci.2001,58, 395–401. [CrossRef]
25. Ropodi, A.I.; Panagou, E.Z.; Nychas, G.J.E. Multispectral imaging (MSI): A promising method for the detection of minced beef adulteration with horsemeat.Food Control2017,73, 57–63. [CrossRef]
26. Ahmad, M.; Khan, A.; Khan, A.M.; Mazzara, M.; Distefano, S.; Sohaib, A.; Nibouche, O. Spatial prior fuzziness pool-based interactive classification of hyperspectral images. Remote Sens. 2019, 11, 1136. [CrossRef]
27. Ahmad, M.; Shabbir, S.; Oliva, D.; Mazzara, M.; Distefano, S. Spatial-prior Generalized Fuzziness Extreme Learning Machine Autoencoder-based Active Learning for Hyperspectral Image Classification.Optik-Int. J. Light Electron Opt.2020. [CrossRef]
28. Ahmad, M.; Raza, R.A.; Mazzara, M. Multiclass Non-Randomized Spectral–Spatial Active Learning for Hyperspectral Image Classification.Appl. Sci.2020,10, 4739. [CrossRef]
29. Fu, X.; Chen, J. A review of hyperspectral imaging for chicken meat safety and quality evaluation: application, hardware, and software.Compr. Rev. Food Sci. Food Saf.2019,18, 535–547. [CrossRef]
30. Fowler, S.M.; Schmidt, H.; Scheier, R.; Hopkins, D.L. Raman spectroscopy for predicting meat quality traits. InAdvanced Technologies for Meat Processing; CRC Press: Cleveland, OH, USA, 2017; pp. 83–112.
31. Velásquez, L.; Cruz-Tirado, J.; Siche, R.; Quevedo, R. An application based on the decision tree to classify the marbling of beef by hyperspectral imaging.Meat Sci.2017,133, 43–50. [CrossRef] [PubMed]
32. Sanz, J.A.; Fernandes, A.M.; Barrenechea, E.; Silva, S.; Santos, V.; Gonçalves, N.; Paternain, D.; Jurio, A.; Melo-Pinto, P. Lamb muscle discrimination using hyperspectral imaging: Comparison of various machine learning algorithms.J. Food Eng.2016,174, 92–100. [CrossRef]
33. Al-Sarayreh, M.; M Reis, M.; Qi Yan, W.; Klette, R. Detection of red-meat adulteration by deep spectral–spatial features in hyperspectral images.J. Imaging2018,4, 63. [CrossRef]
34. Qiao, J.; Ngadi, M.O.; Wang, N.; Gariépy, C.; Prasher, S.O. Pork quality and marbling level assessment using a hyperspectral imaging system.J. Food Eng.2007,83, 10–16. [CrossRef]
35. Qiao, J.; Wang, N.; Ngadi, M.; Gunenc, A.; Monroy, M.; Gariepy, C.; Prasher, S. Prediction of drip-loss, pH, and color for pork using a hyperspectral imaging technique.Meat Sci.2007,76, 1–8. [CrossRef] [PubMed] 36. ElMasry, G.; Sun, D.W.; Allen, P. Near-infrared hyperspectral imaging for predicting colour, pH and
tenderness of fresh beef.J. Food Eng.2012,110, 127–140. [CrossRef]
37. Barbon, S.; Costa Barbon, A.P.A.d.; Mantovani, R.G.; Barbin, D.F. Machine Learning Applied to Near-Infrared Spectra for Chicken Meat Classification.J. Spectrosc.2018,2018, 12. [CrossRef]
38. Zhang, Y.; Jiang, H.; Wang, W. Feasibility of the detection of carrageenan adulteration in chicken meat using visible/near-infrared (vis/nir) hyperspectral imaging.Appl. Sci.2019,9, 3926. [CrossRef]
39. Rady, A.; Adedeji, A.A. Application of Hyperspectral Imaging and Machine Learning Methods to Detect and Quantify Adulterants in Minced Meats.Food Anal. Methods2020, 1–12. [CrossRef]
40. Khan, M.H.; Saleem, Z.; Ahmad, M.; Sohaib, A.; Ayaz, H. Unsupervised adulterated red-chili pepper content transformation for hyperspectral classification.arXiv2019, arXiv:1911.03711.
41. Farrand, W.H.; Singer, R.B.; Merényi, E. Retrieval of apparent surface reflectance from AVIRIS data: A comparison of empirical line, radiative transfer, and spectral mixture methods.Remote Sens. Environ. 1994,47, 311–321. [CrossRef]
42. Reis, M.M.; Van Beers, R.; Al-Sarayreh, M.; Shorten, P.; Yan, W.Q.; Saeys, W.; Klette, R.; Craigie, C. Chemometrics and hyperspectral imaging applied to assessment of chemical, textural and structural characteristics of meat.Meat Sci.2018,144, 100–109. [CrossRef]
43. Mamani-Linares, L.; Gallo, C.; Alomar, D. Identification of cattle, llama and horse meat by near infrared reflectance or transflectance spectroscopy.Meat Sci.2012,90, 378–385. [CrossRef]
44. Cozzolino, D.; Murray, I. Identification of animal meat muscles by visible and near infrared reflectance spectroscopy.LWT-Food Sci. Technol.2004,37, 447–452. [CrossRef]
45. Su, H.; Du, Q.; Du, P. Hyperspectral image visualization using band selection.IEEE J. Sel. Top. Appl. Earth Obs. Remote Sens.2013,7, 2647–2658. [CrossRef]
46. Nelson-Wong, E.; Howarth, S.; Winter, D.A.; Callaghan, J.P. Application of autocorrelation and cross-correlation analyses in human movement and rehabilitation research.J. Orthop. Sports Phys. Therapy 2009,39, 287–295. [CrossRef]
47. Yu, Y.; Yu, H.; Guo, L.; Li, J.; Chu, Y.; Tang, Y.; Tang, S.; Wang, F. Accuracy and stability improvement in detecting Wuchang rice adulteration by piece-wise multiplicative scatter correction in the hyperspectral imaging system.Anal. Methods2018,10, 3224–3231. [CrossRef]
48. Schafer, R.W.; others. What is a Savitzky-Golay filter.IEEE Signal Process. Mag.2011,28, 111–117. [CrossRef] 49. Schölkopf, B.; Burges, C.J.; Smola, A.J.; others.Advances in Kernel Methods: Support Vector Learning; MIT Press:
Cambridge, MA, USA, 1999.
50. Chen, K.; Sun, X.; Qin, C.; Tang, X. Color grading of beef fat by using computer vision and support vector machine.Comput. Electron. Agric.2010,70, 27–32. [CrossRef]
51. Xiong, Z.; Sun, D.W.; Pu, H.; Zhu, Z.; Luo, M. Combination of spectra and texture data of hyperspectral imaging for differentiating between free-range and broiler chicken meats. LWT-Food Sci. Technol. 2015, 60, 649–655. [CrossRef]
c
2020 by the authors. Licensee MDPI, Basel, Switzerland. This article is an open access article distributed under the terms and conditions of the Creative Commons Attribution (CC BY) license (http://creativecommons.org/licenses/by/4.0/).
![Table 1. Similarity percentage among red meat and Poultry Mb [20].](https://thumb-us.123doks.com/thumbv2/123dok_us/10015176.2493806/2.892.269.619.257.372/table-similarity-percentage-red-meat-poultry-mb.webp)