MAINTENANCE DIVISION
James Sissom, Southern Illinois University, [email protected]
ABSTRACT
The Operations and Maintenance Business Information Link (OMBIL) is a relational data warehouse that provides users with direct access to performance-based management, budget, and financial information in a graphic format for review and analysis. This paper examines the corporate data models constructed to support the successful deployment of the physical system (business application). The business application data entry fields are also examined for comparison to the decision support component built into OMBIL. This analysis paper compares data model complexity to performance measures that are reported to the Office of Management and Budget and for use in determining the overall effectiveness of the Corps’ civilian water resources management mission. The research findings will provide an analysis baseline for further examination of the maintainability and reliability of conceptual data models and assist in refining established data quality frameworks.
Keywords: Data Warehouse, Performance Measures, Conceptual Data Model, US Army Corps of Engineers (Corps), Systems Implementation
INTRODUCTION
Organizations build data warehouses to analyze and detect trends in data [4]. Many government agencies utilize data warehousing to facilitate operational efficiency and informed decision making. The decision to move forward with the OMBIL data warehouse began in 1996 with a plan to unify the disparate and decentralized data and information supporting the operation and maintenance of over
information from the data warehouse is the Office of Management and Budget (OMB).
Background
OMBIL is a relational data warehouse that provides users with direct access to performance-based management, budget, and financial information in a graphic format for review and analysis [7]. Specifically, OMBIL must support multiple missions, including administering the national wetlands permitting program, dam safety systems, lock performance, waterway dredging information, recreation, environmental administration, and tracking. Users include not only analysts and managers but engineers, researchers, and biologists. The OMBIL project consisted of two distinct phases of analysis, 1) the structured systems analysis and design approach using the Air Force standard IDEF notation to complete business subject area models, both process and information, and 2) a fact and dimension modeling phase that resulted in multidimensional logical models. Both model deliverables were used to cross-check against the client’s business requirements prior to moving into the design phase of the project.
REQUIREMENTS ANALYSIS OUTCOMES: CONCEPTUAL DATA AND
MULTIDIMEN-SIONAL MODELING Conceptual Data Modeling
Six conceptual data models were developed to support individual business functional areas within the civil works division of the Corps: Recreation,
business function generated data models that were considered the business conceptual models.
As an outcome of each session, each business function generated process models (in IDEF0
notation) and data models (in IDEF1X notation), which were considered the business conceptual models. The statistics for the conceptual models appear in Table 1.
Table 1. Conceptual (Source) Data Model Statistics
Business Function Entities Attributes Relationships
Navigation 264 527 313
Flood Damage Reduction 227 221 277
Environmental Compliance 87 165 143
Environmental Stewardship 347 996 453
Hydropower 51 134 76
Recreation 108 133 124
Dimensional Modeling
The conceptual data models were crucial in determining the makeup and architecture of both the transaction-based and decision support systems. The development team had an interest in getting the original design complete and correct because future development hinged on the proper organization and capture of the business requirements. The development team performed the following:
• Determined candidate facts, dimensions, and dimension hierarchies that supported performance measures
• Determined granularities
• Built an initial dimensional model
• Established a grouping of elements in the model Figure 1 is an overview of dimensional modeling activities. Figure 1 provides context the initial dimensional modeling performed and the deliverables that were produced.
Each business system was designed using the conceptual (source) data models and ultimately supported the following number of data entry forms and fields shown in Table 2.
Table 2. Business System Data Entry Forms and Fields Statistics Business Function Data Entry Forms Data Entry Fields Common 26 299 Navigation 14 89 Flood Damage Reduction 33 234 Environmental Compliance 14 138 Environmental Stewardship 10 118 Hydropower 9 161 Recreation 28 370
RESEARCH GOALS AND QUESTIONS In this paper, the analysis looks at the most popular conceptual data models; entity relationship diagrams (ERDs) with the purpose of comparing complexity to
software development. Therefore the goal is defined in terms of the following:
• Study Objective: ERD complexity
• Purpose: evaluate software effectiveness
• Viewpoint: IS/database designer
• Environment: software development Conceptual data modeling is the first step in database conceptual design [3]. The quality and complexity of database models will greatly influence the quality and effectiveness of the information system that is finally delivered.
The author acknowledges the importance of conceptual data model quality and the fact there is no generally accepted guidelines for evaluating the quality of conceptual data models [5]. The literature supports several ‘bread and butter’ lists of endorsed properties for quality conceptual models and “only a few comprehensive and structured frameworks have been proposed which attempt to address quality in conceptual modeling in a more systematic way” [6]. My goal is to review electronic performance measurement data capture to formulate a baseline for
Questions
Business system complexity is influenced by the ERD structural complexity, which in turn depends on the ERD elements (entities, attributes, and relationships) and raises the following questions for consideration:
• How is ERD complexity affected by the number of entities?
• How is ERD complexity affected by the number of attributes?
• How is ERD complexity affected by the number of relationships?
• How is the business system complexity affected by the number of entities, attributes, and relationships?
• Does this complexity affect the ability of the program to achieve high levels of performance?
Analysis Measures
The literature defines some basic measures that will be used in a modified format for this analysis [6]:
• NE (Number of Entities). Defined as the number of entities within an ERD.
• NA (Number of Attributes). Defined as the total number of simple, derived, composite, and multivalued attributes with an ERD.
• NR (Number of Relationships). Defined here as the total number of M:N, 1:N, N-ary, Binary, IS-A, Reflexive, and redundant relationships in an ERD.
ERD complexity measures will be compared to the mission-related Federal program performance measures, and to key performance measures regarding data collection.
FEDERAL PROGRAM PERFORMANCE MEASURES
site tells the visitor if the program is performing. If performing, the program is given one of three results:
• Effective. This is the highest rating a program can achieve. Programs rated Effective set ambitious goals, achieve results, are well-managed, and improve efficiency.
• Moderately Effective. In general, a program rated Moderately Effective has set ambitious goals and is well-managed. Moderately Effective programs likely need to improve their efficiency or address other problems in the programs' design or management in order to achieve better results.
• Adequate. This rating describes a program that needs to set more ambitious goals, achieve better results, improve accountability, or strengthen its management practices.
If not performing, a program is categorized as one of two results:
• Ineffective. Programs receiving this rating are not using tax dollars effectively. Ineffective programs have been unable to achieve results due to a lack of clarity regarding the program's purpose or goals, poor management, or some other significant weakness.
• Results Not Demonstrated. A rating of Results Not Demonstrated (RND) indicates that a program has not been able to develop acceptable performance goals or collect data to determine whether it is performing. (Source: ExpectMore.gov, 2008)
Out of the 25 key questions asked in the PART questionnaire, question Program Management
question 3.1, “Does the agency regularly collect timely and credible performance information, including information from key program partners, and use it to manage the program and improve performance?” is reported here because of its
relationship to data collection. Corps Program Results
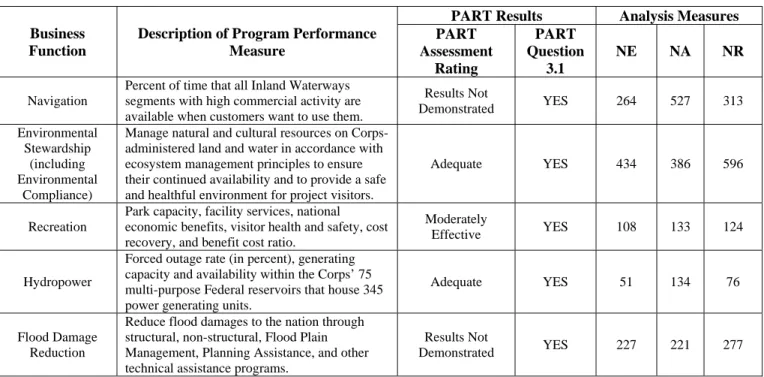
Each OMBIL program was analyzed by the OMB using the PART methodology. Table 3 displays the results that match the Corps Civil Works program currently using the OMBIL system. Note that the OMB PART results combine Environmental Stewardship and Environmental Compliance.
Discussion
Performance measures can be described as common business queries used to report results within an organization. The performance measures in the case of the Corps were well-defined and corresponded to data items that the Corps leadership used to measure the performance of a business function. Based on the information in Table 3, the business function, program performance measure (related to mission), and OMB PART rating, some basic observations can be made related to the research questions.
A review of the OMB’s PART Assessment Rating score, the program’s performance measure, and complexity of its data gathering software conceptual model reveals that two programs reached an “Adequate” rating, one is “Moderately Effective” and two others are not demonstrating results. One of the two programs that reached an adequate level of performance is a combined program, Environmental Stewardship and Environmental Compliance. Each program individually contributes to the overall effectiveness (see Table 1 for a breakdown of NE, NA and NR results).
Flood Damage Reduction and Navigation have the second and third highest number of NE, NA, and NR results among the six programs; this could indicate a correlation between complexity and successful software development. Further research is needed to discover other factors besides complexity (i.e., maintainability) affecting the program performance results.
Table 3. Corps Program Performance Measures by PART Results and Analysis Measures
Business Function
Description of Program Performance Measure
PART Results Analysis Measures PART Assessment Rating PART Question 3.1 NE NA NR Navigation
Percent of time that all Inland Waterways segments with high commercial activity are available when customers want to use them.
Results Not Demonstrated YES 264 527 313 Environmental Stewardship (including Environmental Compliance)
Manage natural and cultural resources on Corps-administered land and water in accordance with ecosystem management principles to ensure their continued availability and to provide a safe and healthful environment for project visitors.
Adequate YES 434 386 596
Recreation
Park capacity, facility services, national economic benefits, visitor health and safety, cost recovery, and benefit cost ratio.
Moderately
Effective YES 108 133 124
Hydropower
Forced outage rate (in percent), generating capacity and availability within the Corps’ 75 multi-purpose Federal reservoirs that house 345 power generating units.
Adequate YES 51 134 76
Flood Damage Reduction
Reduce flood damages to the nation through structural, non-structural, Flood Plain Management, Planning Assistance, and other technical assistance programs.
Results Not
Demonstrated YES 227 221 277
REFERENCES
1. Ballard, C., Herreman, D., Schau, D. et al. (1998) Data modeling techniques for data warehousing. International Technical Support Organization. IBM Corporation.
2. ExpectMore.gov Home Page. (2008) Office of Management and Budget.
http://www.whitehouse.gov/omb/expectmore/
3. Genero M., Piattini, M., Calero, C. (2001) Assurance of conceptual data model quality based on early measures," apaqs, p. 0097, Second Asia-Pacific Conference on Quality Software (APAQS'01).
4. Inmon, W.H. (2002) Building the data warehouse, 3rd Ed. Wiley, New York.
5. Moody, D., et al., (2003) Evaluating the quality of information models: empirical testing of a conceptual model quality framework, in
6. Piattini, M., M. Genero, and L. Jimenez. (2001). A metric-based approach for predicting
conceptual data models maintainability.
International Journal of Software Engineering & Knowledge Engineering. 11(6): p. 703.
7. Sissom, J.D., J.A. Compton, D.E. Lichy. (1999). Operations and maintenance business information link: information technology for performance measurement. Journal of the Transportation Research Board: Transportation Research Record 1729. National Academy Press. Washington, D.C.
![Figure 1. Overview of Dimensional Modeling Activities [1]](https://thumb-us.123doks.com/thumbv2/123dok_us/957054.2624941/2.918.148.738.231.1054/figure-overview-dimensional-modeling-activities.webp)