WEIGHING IN ON THE RELATIONSHIP BETWEEN MACRONUTRIENT INTAKE, WEIGHT STATUS, COGNITIVE FUNCTIONING, AND ACADEMIC PERFORMANCE
IN SCHOOL-AGED CHILDREN
Kylee M. Miller
“A dissertation submitted to the faculty of the University of North Carolina at Chapel Hill in partial fulfillment of the requirements for the degree of Doctor of Philosophy in School
Psychology in the School of Education.”
Chapel Hill 2013
ii ABSTRACT
Kylee M. Miller: Weighing in on the Relationship Between Macronutrient Intake, Weight Status, Cognitive Functioning, and Academic Performance In School-Aged Children
(Under the direction of Rune J. Simeonsson)
Objective:The dramatic increase of pediatric obesity and the controversy regarding its impact on cognition may be due in part to the multifaceted nature of cognition and the role of environmental factors this relationship. The aim of the study was to investigate the
relationship between macronutrient intake, weight status, cognitive functioning, and academic performance in school-aged children using a nationally representative sample.
Methods:Participants were children between ages 6 and 16-years-old who completed cognitive and academic portions of the third National Health and Nutrition Examination Survey (NHANES-III). Data were analyzed with ANOVAs and regression analyses, controlling for confounding variables.
Results: It was found that 6-8 year-old children in the underweight range performed better than children in the overweight and obese ranges on all cognitive and academic tasks. Adolescents BMI’s in the normal weight range performed better than their peers in the underweight and obese weight ranges. Of the children who reported not meeting
iii
performance on both cognitive and academic variables. Higher total caloric intake
contributed to Block Design performance and higher intake of carbohydrates contributed to reading and math performance. Implications of this are discussed.
iv
ACKNOWLEDGEMENTS
Special thanks to my mentor, Dr. Stephen Hooper, for his constant support and guidance throughout my graduate program. His kindness, patience, and continual coaching are greatly appreciated.
Thanks also to my committee chair, Dr. Rune Simeonsson, whose backing throughout my graduate career was invaluable; and other committee members, Drs. Sandra Torres, Julie Daniels, Barbara Wasik, and Sandra Evarrs, for their assistance and direction.
I am grateful to Dr. Chris Wiesen at UNC’s Odum Institute for his statistical expertise and patience; and Dr. Anne Wheeler, at the Carolina Institute for Developmental Disabilities, for her insights, and from whom I learn in working with her.
My parents and grandparents, who have supported me through my schooling, and have served as role models for me in life.
I wish to express my deepest gratitude to my husband, James Joyner, for his
v
TABLE OF CONTENTS
LIST OF TABLES ... viii
LIST OF FIGURES ...x
CHAPTER 1 ...1
CHAPTER 2 ...7
Background ... 7
Cognitive Framework: Executive Functioning ... 7
Executive Functions ... 8
Theories of Executive Functions ... 9
Developmental Perspectives ... 12
Appetitive Reward System ... 15
Weight Status: Underweight, Overweight, and Obese ... 16
Underweight and Obesity Prevalence and Comorbidities ... 16
Measuring Adiposity ... 17
Cognition and Weight Status ... 18
Global Cognitive Deficits ... 21
Executive Function Deficits ... 27
vi
Cognition and Nutrition ... 30
Cognition, Academic Achievement, and Weight Status ... 31
Present Study ... 33
CHAPTER 3 ...36
Methods ... 36
Data Source ... 36
Measures and Materials ... 38
Data Preparation ... 41
Statistical Analysis ... 41
Summary ... 42
CHAPTER 4 ...44
Results ... 44
Description of the Sample ... 44
Question 1a. ... 44
Question 1b. ... 47
Question 2a. ... 49
Question 2b. ... 51
vii
Question 3b. ... 53
CHAPTER 5 ...56
Discussion ... 56
Findings... 56
Limitations ... 63
Future Directions ... 66
Conclusion ... 67
APPENDIX 1 ...94
APPENDIX 2 ...97
APPENDIX 3 ...98
viii
LIST OF TABLES
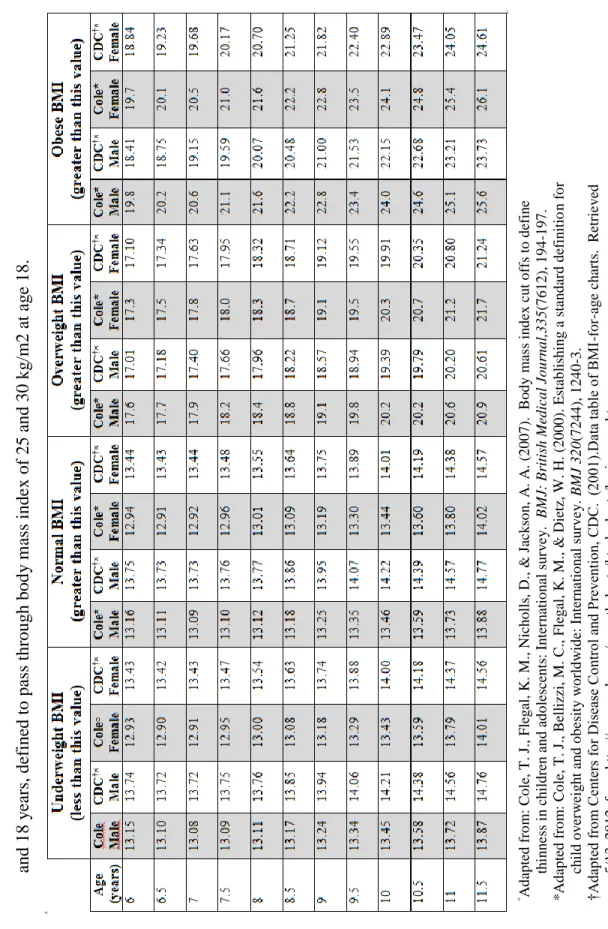
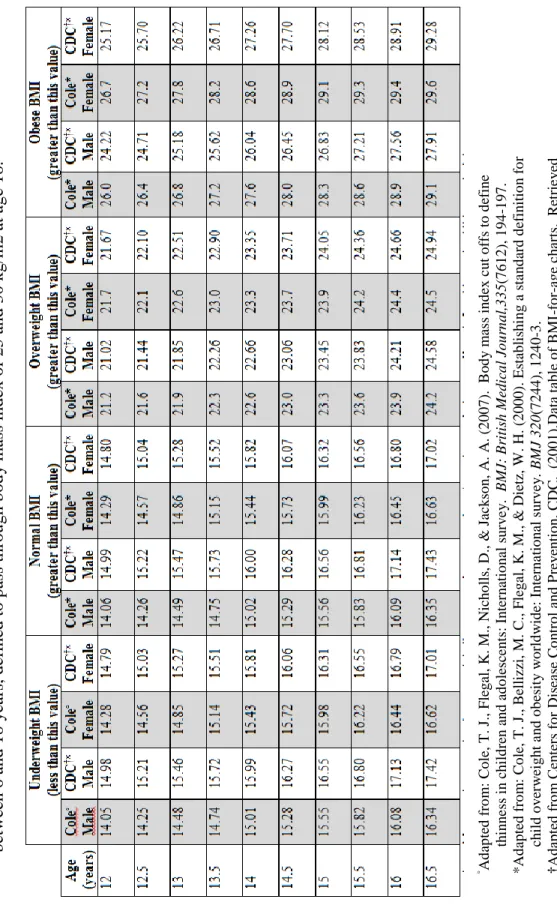
Table 1 ─ Comparison of Cole (2000) and USA
CDC(2001) cut-off points for body weight by sex between 2 and 18 years, defined to pass through
body mass index of 25 and 30 kg/m2 at age 18...68 Table 2 ─ Recommended Daily Allowances (RDAs) or
Acceptable Macronutrient Distribution Ranges (AMDR) of select macronutrients by age and
gender ...70 Table 3 ─ Sample demographics by weight group ...71 Table 4 ─ Question 1a. Block Design: Main effects
contrasts with significance x Weight Class ...72 Table 5 ─ Question 1a. Block Design simple effects; with
significance ...73 Table 6 ─ Question 1a. Digit Span contrasts x Weight
Class ...74 Table 7 ─ Question 1a. Digit Span simple effects; with
significance ...75 Table 8 ─ Question 1b. Reading performance: Main effects
contrasts x Weight Class ...76 Table 9 ─ Question 1b. Reading performance simple
effects; with significance ...77 Table 10 ─ Question 1b. Math performance: Main effects
contrasts x Weight Class ...78 Table 11 ─ Question 1b. Math performance simple effects;
with significance ...79 Table 12 ─ Question 2. Mean intake values ...80 Table 13 ─ Question 2a. Block Design performance in
children not meeting recommended nutritional
intake. ...81 Table 14 ─ Question 2a. Digit Span performance in
children not meeting recommended nutritional
ix
Table 15 ─ Question 2b. Reading performance in children
not meeting recommended nutritional intake. ...83 Table 16 ─ Question 2b. Math performance in children not
meeting recommended nutritional intake...84 Table 17 ─ Question 3a. Multiple regression analysis of
demographic, socioeconomic, nutrient, and BMI
category variables on Block Design performance. ...85 Table 18 ─ Question 3a. Multiple regression analysis of
demographic, socioeconomic, nutrient, and BMI
category variables on Digit Span performance. ...86 Table 19 ─ Question 3b. Multiple regression analysis of
demographic, socioeconomic, nutrient, and BMI
category variables on reading performance. ...87 Table 20 ─ Question 3b. Multiple regression analysis of
demographic, socioeconomic, nutrient, and BMI
x
LIST OF FIGURES
Figure 1 ─ Proposed model of the relationship between demographic,
nutrition, weight status, cognitive, and academic variables.………... 89
Figure 2 ─ Question 1a. Block Design Contrasts and Estimates by Age Group…………...90
Figure 3 ─ Question 1a. Digit Span Contrasts and Estimates by Age Group……….91
Figure 4 ─ Question 1b. Reading Contrasts and Estimates by Age Group……….... 92
CHAPTER 1
Obesity is now considered a national public health crisis, as it is one of the most urgent and serious health threats confronting our nation (Polhamus, 2011). Being
overweight is prevalent worldwide, and an ever-increasing problem that poses a serious risk to the physical and mental wellbeing of youth. It is an early risk factor for morbidity and mortality in adulthood, and has been associated with a myriad of psychosocial and cognitive impairments in adults. There has been some controversy regarding the cognitive impact of underweight and obesity, and malnutrition, in childhood and adolescence. In recent years, several studies have evaluated general effects of under- or overweight at various ages, as well as brain structures. The range of methodologies and outcomes of these investigations makes it difficult to draw straightforward conclusions about childhood weight status and its effect on cognitive performance. There are, however, enough studies illustrating a correlation between obesity and cognition to merit concern and further investigation. In a systematic review of studies on the cognitive impact of obesity, Cosgrove, Arroyo, Warren, and Zhang (2009), concluded that a decrease in cognitive functioning was linked to excess weight in children. They found attention, motor skills, and visual-spatial organization processes to be significantly lower in overweight and obese individuals, compared to their normal-weight peers (Cosgrove et al., 2009).
2
and structural changes in the brain related to increased adipose tissue. As with
neuropsychological tests, these imaging methods are diverse, and provide insight into the neural networks that underlie food intake, chemical functioning, and abnormal brain structures in high-risk and obese individuals. Carnell and colleagues (Carnell, Gibson, Benson, Ochner, & Geliebter, 2012) published a summary of findings regarding
neuroimaging and obesity in the child and adolescent populations –encompassing various regions of the brain, as well as behavioral investigations into the appetitive reward system. More specifically, when comparing lean and obese adults, it has been found that adults in the obese BMI range have dysregulated responses to visual food stimuli, particularly in the areas of the brain that control attention and cognitive control. Similarly, food tastes and smells trigger heightened responses in the memory, reward, and motivation centers of the brain with simultaneous lower activation in the areas controlling attention. The “hot”, or hedonic, response system seeking rewards is activated. The review also suggested that weight gain in individuals with obesity may be attributable to decreased hypothalamic activity and
inhibitory control, and down-regulation of dopamine receptors (Carnell et al., 2012). In turn, the visual, olfactory, and gustatory food cues become hypersensitive to overcome the
insufficient food-reward response.
Structural differences have also been noted in the brain of individuals with obesity across several studies, though most have not been able to assign causality (Carnell et al., 2012). More specifically, researchers have found that there is reduced volume of the
3
For persons who were overweight and successfully dieted, research has shown that they continue to have heightened responses to food cues, and continue to show
over-activation in the hypothalamus and visual cortices (the homeostatic and sensory areas of the brain). They also show increased activation of the attention and self-regulation executive functions (EF) of the brain. Similar findings of dysregulated functioning in the reward system of those at genetic risk for obesity have been reported, and are discussed in the genetics section that follows.
Research on children with BMI’s in the underweight range typically use clinical samples with confirmed diagnoses of Anorexia Nervosa (AN), an eating disorder
characterized by an unhealthy, underweight BMI (Andrés-Perpiña, 2011; Bosanac, Olver, Kurlender, Stojanovska, Hallam, Norman, . . . Manktelow, 2007; Bradley, Taylor, Rovet, Goldberg, Hood, Wachsmuth, . . . Pencharz, 1997). Within these populations, findings are discordant and have small sample sizes, though Andrés-Perpiña (2011) reported decreased attention, memory, and visuospatial scores.
4
Dietz, 2000), cognitive and academic performance measures, as well as macronutrient intake on a nationally representative sample to address these issues.
An important factor in empirical studies on the cognitive, and academic, performance of under- and over-weight young children is the assessment and inclusion of the
environmental milieu. As has been demonstrated in a number of studies, the home and school environments, maternal education, demographic variables (e.g., SES, age,
race/ethnicity), as well as eating and exercise behaviors are important covariates of obesity and cognition (Cosgrove et al., 2009; Datar, Sturm, & Magnabosco, 2004; Gorin, 2008; Gunstad et al., 2008; Li, Dai, Jackson, & Zhang, 2008; Kristine Lee Lokken, Boeka, Austin, Gunstad, & Harmon, 2009; Miller et al., 2009; Ogden, Carroll, Kit, & Flegal, 2012;
Veldwijk, Scholtens, Hornstra, & Bemelmans, 2011). Research has shown that maternal intelligence, household SES, race/ethnicity, and age have the highest correlations with low cognitive and academic performance in children who are overweight (Datar et al., 2004; Li et al., 2008; Veldwijk et al., 2011); as well as those who are underweight and malnourished (UNICEF, 2009), though research on the latter is scarce. Furthermore, the Cosgrove (2009) report proposed different risk profiles for cognitive functioning and academic performance as an explanation for discordant findings in previous studies. This was supported by non-significant effects on academic performance when controlling for socioeconomic status (SES) (Cosgrove et al., 2009).
5
for specific events, semantic memory –long-term recall of concepts, ideas, and meanings, and spatial abilities as measured by a block design test, four times over a period of 22 years (1998-2010) (Nilsson & Nilsson, 2009). After controlling for comorbidities related to obesity, it was found that semantic memory was associated with increased weight status while episodic memory was not. Using data from the Baltimore Longitudinal Study of Aging, Gunstad, Lhotsky, Wendell, Ferrucci, and Zonderman (2010) found that, in adults with a mean age of 55.5 years, BMI’s in the obese range were associated with lower global cognitive and EF skills over time, but no decline in attention capacity was reported. Gunstad (2010) speculated several explanations for this independent effect of obesity on cognition including inflammatory processes, neuroendocrine disorders, and heart problems. These vascular and inflammatory processes would not solely account for lower cognitive functioning in a younger population. While these mechanisms may be important in all children, they may play a more important role in younger children at the extreme ends of the weight spectrum.
6
Outcomes from the current study will allow for replication of previous investigations on the cognitive and academic factors related to obesity in young children, and expand the knowledge base by exploring whether macronutrient intake, cognitive, and academic performance variables are related in the early childhood and adolescent populations. Specifically, the current study addresses whether lower cognitive functioning and academic performance characterize children who are underweight, overweight, or obese, and explores the relationship between cognitive functioning, academic performance, selected
macronutrient intake, and weight status.
Previous investigations’ inconclusive or weak findings on the relationships among weight status, cognitive functioning, and/or academic performance were addressed in the current study through use of a large, nationally representative sample. This was done using BMI cut points based on large, international datasets that are linked to adult cutoffs making them good indicators for negative health outcomes, and examination of the possible
contribution of macronutrients to these associations.
CHAPTER 2
Background
The activities that children and adolescents partake in, such as playing, school, and thinking all depend on energy consumption and what is stored in their bodies. Many of the nutritional problems children have involve energy imbalance: slow weight gain in infancy (a.k.a., failure to thrive) is related to deficient energy intake. AN is a discretionary restriction in energy intake, and can lead to poor growth and failure to gain weight in children. Obesity, on the other end of the spectrum is, broadly, an over-consumption and under-expenditure of energy resulting in weight gain. Food, the main source of energy for the body, is taken in through eating which driven by several factors, including the appetitive reward system, which is discussed below. The relationship between the environment, cognition, nutrition, weight status, and health outcomes across the lifespan has been a highly researched and debated topic over the past two decades. Follows is a review of (1) the cognitive framework most often affected by a weight status in the lower and upper extremes, (2) a model of the neurobiophysiological underpinnings of appetite and reward, (3) the prevalence and
comorbidities of abnormal weight status, and (4) the relationship between weight status and cognition.
Cognitive Framework: Executive Functioning
8
attention, language, memory, perception, and the executive functions —volition, planning/organization, attention, cognitive flexibility, working memory, initiation, self-regulation, and sequencing (Best & Miller, 2010; Luria, 1973). Of the deficits reported in people with an underweight, overweight, or obese weight status; the executive functions are the most discussed (Boeka & Lokken, 2008; Braet, Claus, Verbeken, & Van Vlierberghe, 2007; Kamijo et al., 2012; Lokken, Boeka, Austin, Gunstad, & Harmon, 2009; Pauli-Pott, Albayrak, Hebebrand, & Pott, 2010; Waldstein & Katzel, 2005). While the specific areas of weakness vary by age, the cognitive processes of inhibition, planning, attention, and
cognitive flexibility (shifting attention between different activities) have been associated with weight status and eating behaviors.
Executive Functions
Executive functions are psychological processes that allow conscious control over actions and thoughts: controlling inhibition, directing attention, allowing cognitive flexibility, and allowing manipulation of information in short-term memory. Developmental research on EF processes suggests that executive dysfunction, characterized by poor problem solving, poor planning, perseveration, and cognitive inflexibility (Best & Miller, 2010; Lehto,
Juujarvi, Kooistra, & Pulkkinen, 2003; Pennington, 1997), may (1) not actually be abnormal in children, but rather a function of varying developmental trajectories, sequences, or
9
measurement of EF’s will elucidate the areas in need of further examination in young children, related to obesity.
Theories of Executive Functions
Findings on the development of EF in early childhood will guide translational research, interpretation, as well as validation and creation of new measures. Currently there are two main theories of EF organization in early childhood, the (a) unitary construct and, (b) constituent component construct. To understand the frontal lobes’ functioning it is necessary to identify common operational topographies and neural networks that transcend the
individual EF’s. The unitary construct supports the notion that there is a central attention system that regulates the different sub-processes of EF, particularly in children ages two- through six-years-old (Baddeley, 1996; Carlson, S. M., 2011; Garon, Bryson, & Smith, 2008; Wiebe et al., 2011). This view has been advanced by studies reporting correlations between adult and child measures of EF’s (Carlson, S. M., Mandell, , Williams, 2004; Diamond, Prevor, Callender, & Druin, 1997; Friedman et al., 2008; Hughes, 2002; Kochanska, Murray, Jacques, Koenig, & Vandegeest, 1996; Lehto et al., 2003; Miyake et al., 2000) as well as correlations between the different tasks and central attention processing (Engle, 2002; Visu-Petra, Benga, & Miclea, 2007; Welsh, Nix, Blair, Bierman, & Nelson, 2010).
10
EF in early childhood cluster in three primary domains: (a) set-shifting, (b) working memory, and (c) inhibition (Collette et al., 2005; Hughes, 1998, 2011; Lehto et al., 2003; Miyake et al., 2000; Miyake & Friedman, 2012; Pennington, 1997; Welsh et al., 1991). Review of various EF’s within each of these frameworks is presented below, and influential factors considered.
Hot and Cool Theory of Executive Function. Further dissection of the EF framework
has been considered with the notion of “hot” and “cool” EF’s, with the majority of childhood EF studies focusing on cool functions (Hongwanishkul, Happaney, Lee, & Zelazo, 2005; Metcalfe & Mischel, 1999; Zelazo, Müller, Frye, & Marcovitch, 2003). The former, “hot” system, controls emotional processing and triggers/stimuli, while the “cool” system relates to thought representations and spatiotemporal reflections (Metcalfe & Mischel, 1999). Using the delay of gratification paradigm, research has illustrated the “hot” emotional system as the core of impulse control in light of consequences. One such study by Marcelino and
self-11
control is possible when a “hot” spot is activated that overlaps with a “cool” spot; when they share a node (Metcalfe & Mischel, 1999), and the “cool” system is able to retain some reflective actions and control over the primitive, instantaneous emotional responses. In the “cool” EF system a goal is attained through monitoring, working memory, and perceptual processing —intake of the environment to stimulus perception. Theoretically speaking, if a person has the cognitive resources to stop the predominant, emotionally driven, “hot” responses to a stimulus they will be able to select an appropriate stimulus (i.e., healthy food choice).
Unity/Diversity Theory of Executive Functions. A relatively new perspective in EF
frameworks, the Unity/Diversity schema focuses on the components of EF that are not encompassed by common factors of working memory, shifting, or inhibition (Friedman, Miyake, Robinson, & Hewitt, 2011; Friedman et al., 2008; Miyake et al., 2000; Miyake & Friedman, 2012). Confirmatory factor analysis has demonstrated that inhibition, working memory (WM), and set-shifting are interrelated variables each contributing to the EF construct (Miyake et al., 2000). Current research on this framework focuses on the underlying abilities utilized by each EF component and whether a particular skill taps the common EF (unity) or a specific EF factor (diversity). In determining the commonality between these EF components, Friedman and colleagues (2011; 2008) found that inhibition does not contribute unique variance to individual differences in EF. Though the mechanisms behind shifting skills is unknown at present, it is hypothesized that the components of EF specifically responsible for attention shifting reflect cognitive flexibility (facility
12
are fundamental for all components of EF, as well as response inhibition (Luria, 1973; Munakata et al., 2011).
While the above frameworks are divergent in their conceptualization of EF
components and the correlation between them, they are not necessarily mutually exclusive.
The Hot and Cool systems theory illustrates the regulation of emotional processing of stimuli
and thought, and spatiotemporal representations, respectively; while the Unity/Diversity
framework can be used to explain the individual differences within the various factors of EF, and the mechanisms used, which underlie people’s working memory (WM) and attention shifting abilities.
Developmental Perspectives
The developmental literature supports both the independence and unifying nature of EF; that is to say an “integrative framework” (Garon et al., 2008; Miyake & Friedman, 2012). Statistical approaches, such as structural equation modeling, have been employed to explain latent variables and common factor loadings for various tasks within each of the EF domains. The components of EF’s are difficult to study because they are not pure, but rather interrelated. Using confirmatory factor analysis, Miyake (2000) found that in older
13
exclusionary criteria. These results are similar to other studies conducted on children (Carlson, S. M., Mandell, Williams, 2004; Hughes & Ensor, 2007; Wiebe, Espy, & Charak, 2008), which are in contrast to what we know about the differentiated nature of EF in older children and adults. Mole (2006) found common factors only between working memory and set-shifting, excluding the inhibition factor, deducing dissociation between these EF
components.
As described above, the frontal cortex and EF’s develop throughout childhood, which may be inseparable from other cognitive capacities (Allan & Lonigan, 2011; Fuhs & Day, 2011; Halperin, Healey, Zeitchik, & Ludman, 1989; Luria, 1973; Monette, Bigras, & Guay, 2011) as well as social influences (Lewis & Carpendale, 2009; Luri a, 1980; Vygotsky, 1978).
A meta-analysis conducted by Hughes (2011) defined social effects on EF development into three primary categories: (1) positive parent-child interactions (e.g., providing children with problem-based learning), (2) detrimental family environments (e.g., maltreatment, neglect, traumatic brain injury), and (3) effects of interventions (e.g., training, parent scaffolding). Research on both positive parent-child interaction and researcher-initiated interventions, which teach or model methods to promote healthy social-emotional development in children, suggests that these experiences may bolster EF development. In terms of the home environment, parents modeling organized behaviors for the child and providing direct scaffolding has shown positive effects on EF development in children
14
rated by teachers and parents) have used behaviorally-based curricula supporting social-emotional development by teaching self-regulation (Barnett et al., 2008; Bierman, Nix, Greenberg, Blair, & Domitrovich, 2008; Diamond, Barnett, Thomas, & Munro, 2007).
15
variables were collected, but it was not until later versions of NHANES that data on all mothers and children, as well as relationships between family members living in the household, were recorded.
Appetitive Reward System
Food consumption may be attributed to impulsive emotional responses and tied to biological drives, viewed by some as an addiction (Davis & Carter, 2009;Frascella, Potenza, Brown, & Childress, 2010). While this latter view is slightly controversial, an understanding of the neural underpinnings of information processing systems in the executive and cognitive functions is less disputed. Dagher (2009) outlined the role of these networks as performing the following functions: (1) learning about food and associating it with a reward, (2) giving attention to food rewards, (3) assigning a value to environmental stimuli, and (4)
incorporating environmental and homeostatic information to ascertain amount of food available and the amount energy the body needs. An overview of food reinforcement neural networks is not within the scope of this paper, but may be found in Epstein’s 2007 paper (Epstein et al., 2007).
In addition to contextual and individual factors, such as those discussed in the above sections, cued responses to food are captured by both the “hot” and “cool” modes of
16
emotional response, the “cool” nodes are activated, and in the case of food, a person’s willpower is tested by their ability to resist the temptation for such food —a capacity largely dictated by cognitive resources to control the impulse to eat (Metcalfe & Mischel, 1999). When one is able to process a favorable or unfavorable outcome, it is thought that a “hot spot” is connected to a “cool” node, allowing for the emotional response to be activated with simultaneous exercise of willpower and goal-directed behavior (Heinberg, 2009). The NHANES-III data includes only measures of “cool” functioning, the purely cognitive process, captured by cognitive measures; while the “hot” measures of affect and motivation were not collected, and therefore not included in the current analyses.
Weight Status: Underweight, Overweight, and Obese
Underweight and Obesity Prevalence and Comorbidities
The number of underweight children, defined by the World Health Organization (WHO) as having a low weight-for-age, was estimated at 17% in 2011 for children under age five in developing countries (World Health Organization, 2013). In developed countries the estimates of children with an underweight BMI is between 0.4% and 1% (Wright & Garcia, 2012). These estimates used the International Obesity Task Force (IOTF) definition of thinness and its cutoffs as a low BMI in developed countries (Cole, Flegal, Nicholls, & Jackson, 2007). Few comorbidities have been found in studies of people who are
17
as psychiatric and social-emotional dysfunctions such as anxiety and depression (Bulik & Reichborn-Kjennerud, 2003; Mond, Hay, Rodgers, & Owen, 2009).
On the other end of the weight spectrum is obesity, a chief concern worldwide and in the United States (Ogden, Carroll, Curtin, Lamb, & Flegal, 2010). The prevalence of
overweight and obesity among young people has increased three-fold since 1980 (Eaton et al., 2010), to an estimated 33% of children (Ogden, Carroll, Kit, & Flegal, 2012). The adverse health outcomes associated with childhood obesity are well documented and include Type II diabetes and psychosocial problems (Lawrence & Kopelman, 2004; Ludwig, 2007) as well as an increased risk of cardiovascular disease in adulthood (Baker, Olsen, &
Sorensen, 2007). In addition to physical health problems, neurocognitive impairments have been identified in obese adults without previously documented neurological conditions (Gunstad et al., 2007; Gustafson, Lissner, Bengtsson, Björkelund, & Skoog, 2004; Taki et al., 2007; Waldstein & Katzel, 2005). Obesity has also been shown to have a negative impact on psychosocial functioning and mental health as it has been linked to depression, ED’s, and poor quality of life in children (Hill, 2009; Walker & Hill, 2009). More recently, researchers have begun to investigate the effects of obesity on cognition in children, with disparate results, depending on the ages and assessment tools used (Boeka & Lokken, 2008; Cserjési, Luminet, Poncelet, & Lénárd, 2009; Dempsey & Dyehouse, 2008; Hölcke, Marcus, Gillberg, & Fernell, 2008; Miller et al., 2009); and will be discussed in further detail below.
Measuring Adiposity
18
for comparisons across individuals, as it excludes height. Hence, body mass index (BMI), a measure of adiposity that includes both weight and height, is commonly used in research (WHO, 2000). BMI is calculated as weight in kilograms divided by the square height in meters [i.e., BMI = Weight (kg)/Height (m)2]. In the USA, the parameters set forth by the National Institutes of Health (NIH) are followed with respect to defining obesity: BMI < 18.5 = underweight; BMI 18.5 to 24.9 = normal; BMI 25.0 to 29.9 = at risk for overweight; and BMI ≥ 30.0 = obese (NIH, 2010). Cole and his colleagues (2000) proposed criteria for measuring overweight and obesity in children based on BMI’s collected from the USA, Great Britain, the Netherlands, Hong Kong, Singapore, and Brazil. The BMI’s are averages based on 25th and 30th centiles at age 18, with the purpose of creating the same prevalence of obesity across the ages of 2- to 18-years-old. These standards are referred to as the
International Task Force on Obesity (ITFO) criteria, and are used to define the overweight and obese weight cutoffs in the current study, see Cole (2000) in Table1. Similarly, cut-points for underweight, or thinness, which correspond to adult BMI’s <17 were developed (Cole, 2007).
Cognition and Weight Status
19
obesity have also been widely researched. Specifically, overweight and obese children and adolescents report a lower quality of life and higher rates of depression and body
dissatisfaction than their normal weight peers (Eddy, 2010; Ellen S, 2012; Kim, Oh, Yoon, Choi, & Choe, 2007; Wardle & Cooke, 2005). Children exhibiting these mental health concerns and medical comorbidities associated with increased adiposity, as well as those who are underweight, have also demonstrated various cognitive and academic deficits (Aronen, Vuontela, Steenari, Salmi, & Carlson, 2005; Andrés-Perpiña et al., 2011; Carter, Dubois, & Ramsay, 2010; Cawley & Spiess, 2008; (Andrés-Perpiña et al., 2011; Fagundo et al., 2012). From a neurodevelopmental perspective, research has shown a correlation between obesity and decreased cognitive functioning in adults (Boeka & Lokken, 2008; Corley, Gow, Starr, & Deary, 2010; Pistell et al., 2010; Smith, Hay, Campbell, & Trollor, 2011), in adolescents and children (Bruehl, 2011; Gunstad et al., 2008; Li et al., 2008; Ruiz et al., 2010; Yau et al., 2010); and in underweight children and adolescents (Alaimo, Olson, & Frongillo Jr., 2001; Andrés-Perpiña et al., 2011; Bosanac et al., 2007; Cusick & Georgieff, 2012; Fagundo et al., 2012; Pollitt, Lewis, Garza, & Shulman, 1982).
While the exact mechanisms that underlie the relationship between cognition and weight status are presently unknown in children, evidence suggests impairment in regions of the prefrontal cortex affecting impulse control, planning, and cognitive flexibility in
20
these dissimilarities are highlighted in the review of studies investigating the relationship between weight and cognition.
The present study used The Third National Health and Nutrition Examination Survey (NHANES-III) dataset to investigate the relationship between cognitive functioning,
academic performance, nutritional intake, and BMI status in school-aged children, while adjusting for the relevant confounding factors of age, sex, race/ethnicity, and socioeconomic status. The NHANES-III was designed to provide nationally representative estimates of the health and nutritional status of the United States’ non-institutionalized, civilian population aged 2-months and older. Clinical examinations were conducted along with select cognitive and academic testing and extensive interviews using a standardized survey developed for NHANES-III. More detail is provided about NHANES-III in the Methods section, below.
Being underweight, overweight, or obese is not only related to poor medical
outcomes, but has negative effects on neurocognitive outcomes across the lifespan. As seen in the appetitive reward system, EF, and environmental stimuli play key roles in regulating a person’s eating behaviors. Within this framework, researchers have shown that overweight adults, adolescents, and children exhibit structural abnormalities of the brain and associated behavioral deficits (Dempsey, Dyehouse, & Schafer, 2011; Gunstad et al., 2007; Smith, Hay, Campbell, & Trollor, 2011; Volkow et al., 2009). Despite the emphasis placed on early intervention for healthy lifestyles in hopes of decreasing negative outcomes, the research on whether and how an unhealthy weight and specific macronutrients affect cognitive
21
relationship between BMI and cognitive deficits from a developmental perspective and the cumulative effects of weight gain from biological and imaging perspectives.
Global Cognitive Deficits
Adult Populations
It is well documented that particular medical comorbidities are associated with poor neurocognitive outcomes. Adults with conditions such as diabetes, hypertension, and sleep apnea have demonstrated deficits in a variety of cognitive domains such as processing speed, memory, and EF (Birns & Kalra, 2009; Manschot et al., 2006; Salorio, White, Piccirillo, Duntley, & Uhles, 2002). It has recently been found that these neurocognitive deficits in adults with obesity may exist independent of such medical conditions (Gunstad et al., 2007).
Child Populations
Underweight
22
also in the underweight range. The present study explored this relationship within the
general population. Research investigating populations with diagnosed AN, bulimia nervosa, and normal controls have found cognitive deficits in the areas of visuospatial processing, attention, organization, and memory (Andrés-Perpiña et al., 2011; Bosanac et al., 2007). In participants with ED’s , these cognitive deficits existed both before and after regaining weight (Bosanac et al., 2007; Bradley et al., 1997). Another, smaller, study reported slower processing speed in those with an ED compared to the control group, and no difference between the ED and control groups on general cognitive functioning, memory, visual perception, and short term memory; though the small sample size of 43 people makes comparison difficult (Andrés-Perpiña et al., 2011). Additionally, it was found that nearly 33% of their population demonstrated deficits with visual memory related to higher self-ratings of anxiety, which were independent of ED status. It is unknown whether this discrepancy improves over time or with intervention for anxiety.
A meta-analysis conducted by Lena and colleagues (2004), which reviewed the association between EDs and cognition in large studies, case studies, and imaging studies reported several deficits in the areas of visuospatial processing, organization, motor
coordination, attention, and memory. While some of the cognitive deficits remained when the ED populations gained weight, verbal abilities and memory deficits remained, suggesting that these cognitive detriments may be independent of BMI status and lower cognitive performance may exist prior to the development of an ED. Several reproaches to
23
(e.g., memory, attention) were the topics of investigation. There is a dearth of prospective studies and those including younger populations.
In a small group of female adolescents with AN, Bradley and colleagues (1997) reported slower processing speed which increased marginally with weight gain, but did not reach the higher scores reached by the normal-weight control group. Exploring possible associations between cognitive profiles in people at either extreme of the weight spectrum, recent findings suggest that both people with AN and those with BMI’s in the obese range had more difficulty with decision making skills, and that performance between these groups was similar (Fagundo, Rodríguez, Forcano, Frühbeck, Gómez-Ambrosi, Tinahones,
Fernández-Real, 2012). From a developmental perspective, it has been suggested that children with cognitive impairments such as decision-making and other executive
dysfunctions, may be at an increased risk of developing anED. This has been suggested as they are less able to use metacognitive skills to plan for and adapt to situations that arise and change as they enter adolescence (Lena, Fiocco, & Leyenaar, 2004). Research with AN populations suggests a link between an underweight status and executive dysfunction. Further investigation into the relationship between cognitive functioning and underweight should be conducted, with nonclinical population in the underweight range.
Overweight
24
in obese child and adolescent populations have been noted primarily in the prefrontal cortex (Cosgrove, Arroyo, Warren, & Zhang, 2009; Li, Dai, Jackson, & Zhang, 2008; Maayan, Hoogendoorn, Sweat, & Convit, 2011; Verdejo-Garcia et al., 2010), although general
cognitive dysfunction has also been reported (Miller et al., 2009). To date, such studies have been conducted with adults as well as school–aged children, but not with young children. The results have been varied in these older populations, and current accounts are imprecise about the age at which the possible link between obesity and neurodevelopmental problems can be identified. Analysis of the NHANES-III data allows for inclusion of children as young as six-years-old and include a wide age range allowing age comparisons to explore developmental trajectories of cognitive functions.
A relationship between obesity and attention deficit hyperactivity disorder (ADHD) has been reported (Dempsey & Dyehouse, 2008; Lam & Yang, 2007), as well as visuospatial deficits in overweight children between the ages of 8- and 16-years-old (Li et al., 2008). It is also possible that the decrease in cognitive functioning may lead to an increase in obesity, rather than obesity causing lower cognitive functioning, (Chandola, Deary, Blane, & Batty, 2006), or the relationship may be bidirectional.
25
In previous studies of children between 4- and 7-years-old, using population-based cohorts and controlling for the requite covariates of age, gender, and SES no relationship between cognition and weight status was reported (Gunstad et al., 2008; Guxens et al., 2009; Mond, Stich, Hay, Kraemer, & Baune, 2007; Veldwijk, Scholtens, Hornstra, & Bemelmans, 2011). The measures of cognitive function in these studies varied from a full cognitive battery (Guxens, 2009; Veldjwik, 2011) using the McCarthy Scales of Children’s Abilities and the KABC, respectively, to estimates of intellectual functioning with measures of unknown validity (e.g., Spot-the-Word) (Gunstad, 2008).
26
found between having a high BMI at 10 years of age and lower cognitive functioning than normal-weight peers were. Both of these studies illustrate the negative effect obesity has on cognition in school-age children. Silva and colleagues’ (2008) data suggests that the effects of obesity on cognition are more significant with cumulative effects over time, as the poor cognitive performance was not evident at age five but was present at age ten. The adverse effects of obesity on cognition were apparent in children as young as 56 months, and in those who were overweight at birth and continued to have an elevated BMI through age four-and-a-half. Moreover, the same cognitive effects were found in underweight children (Heinonen, 2008). The inconsistencies across these studies may be due to several factors including (1) different developmental stages making comparison difficult, (2) variance in measures used, (3) that some did not control for known covariates (e.g., maternal education and SES), (4) exclusion of comorbidities, and (5) small numbers of children at the extreme ends of the weight categories. The current study explored the full range of BMI’s from underweight to obese in children between the ages of 6- and 16-years-old, to understand the relationship across all variables better.
27
Using the same data as Li and colleagues’ (2008), the present study hypothesized that children aged 6 to 16 years who are obese would perform worse than their normal weight peers on a measure of visuospatial organization would, but that poor reading and math performance would not be significant when SES and maternal education were controlled. The current study expanded the lower-range of the target population to six years of age, and included macronutrient intake variables. These analyses targeted development through investigation of cognitive performance across a large age-range and used a weight status criterion that adjusted for age (Cole et al., 2000).
Executive Function Deficits
Several studies reporting decreased EF in overweight children (Azurmendi et al., 2005; Guxens et al., 2009; Lokken et al., 2009), encompassing preschool-aged children (Azurmendi et al., 2005; Guxens et al., 2009) and adolescents (Azurmendi et al., 2005), looking at the effects of obesity over several years. These studies did not adjust their
analyses to incorporate confounding variables previously shown to influence the relationship between weight and cognitive functioning.
One such study used highly selective exclusion procedures excluding anyone with underlying medical conditions, with nearly 500 children ages 6 to 19 assessed on the parameters of attention, working memory, set-shifting, and motor speed (Gunstad et al., 2008). The study found no differences in EF between obese and healthy children or
adolescents. The reason these findings are inconsistent with other investigations may be due to the exclusion of ADHD in the Gunstad (2008) sample, reflecting the possibility that
28
Imaging studies using MRI have demonstrated white matter volume reduction in the frontal lobe in adolescents who are obese and have Type II diabetes (Yau et al., 2010), as well as decreased volume in the orbitofrontal cortex (Maayan et al., 2011). These studies suggest that changes in vascular structure and fat metabolism are linked to increased
disinhibition as measured through questionnaires, when controlling for IQ. In the latter case, it is important to note that effects of confounding variables were not analyzed and it is unknown whether results are better explained by such factors as SES and other
environmental influences.
Each of these studies used relatively small sample sizes, illustrating the need for assessment of a large sample and the ability to control for confounding factors and
associations with academic performance and nutritional intake. Specifically, these studies had small sample sizes, did not consider maternal education, and one used cognitive subscale measures with low reliability (Veldwijk et al., 2011). Using the NHANES-III dataset, the current study had adequate power to adjust for several environmental variables such as SES and the macronutrients of total calories, protein, carbohydrates, fat, and fiber consumed.
29
The current study’s large number of participants in each of the weight class categories allowed for ample sample size at the extreme ends of the weight categories —a difference between researchers who reported negative correlation between cognitive function and weight status in children, and those who did not.
Genetic and Other Risk Factors
Supporting the argument that early-onset obesity can negatively affect the developing brain, research comparing Prader-Willi syndrome (PWS), a genetic disorder with associated developmental delay and learning disorders and early-onset childhood obesity (Goldstone, 2004), has found that early intervention for weight control can manifest stability, as opposed to a decline, in IQ (Crnic, Sulzbacher, Snow, & Holm, 1980). The cerebral and cerebellar volume of an age-matched cohort of children with PWS, those with early-onset morbid obesity (EMO), and their respective siblings, ages 4 to 24, were assessed for compromised development as part of a larger study by Miller and colleagues (2009). They reported that the PWS and EMO groups had smaller cerebellar volumes than the group of control siblings. In addition, the children with PWS had lower cognitive functioning scores compared to the control and EMO groups, respectively [general intellectual ability (GIA): PWS=65 ± 25; EMO=81 ± 19; Controls=112 ± 13 (p < .0001 controls vs. PWS and controls vs. EMO]. While both clinical groups had smaller cerebellar volumes relative to their normal weight siblings, a single genetic factor for the underlying cognitive deficits was touted as unlikely by the researchers. These findings support the argument that the negative relationship between cognitive functioning and being at risk for overweight or obese may start as early as
30
Research to date has yielded a variety of results on the relationship between cognitive functioning and weight status. The majority of studies were conducted on small sample sizes, which did not allow for inclusion of many covariates known to affect the relationship (e.g., maternal education and socioeconomic status) (Gunstad et al., 2008; Miller et al., 2009). In addition, the majority of work has been concentrated on adult and adolescent populations with fewer studies investigating the association between cognition and weight in school-aged children. The present study addressed each of these factors using the NHANES-III a large, population-based dataset using children as young as six-years-old through age 16.
Cognition, Academic Achievement, and Nutrition
The role of environment, lifestyle choices, and behaviors in cognitive functioning begins with the fundamental component of nutrient intake, the effects of which begins during gestation and continues across the lifespan (Freeman, Klein, Kagan, & Yarbrough, 1977; Kretchmer, Beard, & Carlson, 1996). Early research in this field was conducted in rural Guatemala and reported a positive correlation between mothers who took a protein
supplement prenatally and while breastfeeding and assessed children’s language and memory at ages three- and four-years-old (Freeman, Klein, Kagan, & Yarbrough, 1977). Using the NHANES-III data, Alaimo and colleagues (2001) reported decreased math performance and increased rates of repeating a grade in elementary school-aged children who reported not getting enough food due to lack of resources, including money. Also using NHANES-III data, Zhang, Herbert, and Muldoon (2005), looked at the relationship between intake of the macronutrient fat, cognitive functioning, academic performance, and psychosocial
31
and high fat and poor reading skills. The current study used the same sample looking at the role of all macronutrients in the relationship between weight status, nutrition, cognition, academics, and socioeconomic factors.
Cognition, Academic Achievement, and Weight Status
The picture of short- and long-term negative outcomes for underweight and
overweight children in terms of physical, cognitive, and academic functioning has begun to take shape. An aspect that is not consistently considered is the ecological context of a child, and their functioning in the place in which they spend much of their day and prepares them for adulthood, the school. As was described in sections above, the cognitive tasks of set-shifting, inhibition, and working memory defining the general EF in young children are influenced by, and themselves influence, many aspects of a child’s environment —from how much they eat to their school performance (Bernier, Carlson, Deschenes, Matte-Gagne, 2012; Dagher, 2009; Lewis & Carpendale, 2009; Lu, 2011). As these functions develop throughout childhood and adolescence, we can examine their relationship to academic performance. Beginning in preschool around age four, environmental assessments of EF using
questionnaires have shown negative associations between set-shifting and inhibition with math performance (Clark, Pritchard, & Woodward, 2010), and have also found that math performance and EF skills are positively correlated (Bull & Scerif, 2001; Bull, Espy, & Wiebe, 2008; Bull, Espy, Wiebe, Sheffield, & Nelson, 2011). Closer examination of cognitive correlates in five- and six-year-olds suggests that working memory has been associated with math performance, while inhibition and cognitive flexibility were
32
factors were controlled for (Monette, Bigras, & Guay, 2011). These studies illustrate the developmental differentiation of the self-regulation components of cognition (Calkins, & Marcovitch, 2010) that emerge in late-childhood and early adolescence, and their role in children’s math and reading abilities. The current study looked at math, reading, working memory, and visuospatial organization/planning inchildren and adolescents. In addition, socioeconomic status a factor known to influence school achievement was controlled for using a nationally representative sample.
Considering the interrelatedness of cognition, social development, physical and mental health, and nutritional needs (Cornette, 2008; Gunstad et al., 2008; Guxens et al., 2009; Veldwijk et al., 2011), it is not surprising that underweight and obesity has also been associated with poor academic performance. In 2005, Taras and Potts-Datema conducted a meta-analysis reviewing investigations on the interaction between academic achievement, cognitive ability, school attendance, and weight status. While they did not report any findings of causation, associations were found between obesity and school absenteeism. In terms of academic performance, children between 6 to 8 years of age who were overweight performed well in math, but those described as being overweight in preschool, and had subsequently lost the weight, had improved performance in math (Datar, Sturm, &
33
used Instrumental Variable Quantile Regression to estimate academic performance given BMI, while controlling for several covariates including parenting practices and
malnourishment (Capogrossi & You, 2012). They found that both underweight and
overweight children had lower math scores than their peers within the normal weight range, supporting the need for children to maintain a body weight within the average range for optimal academic performance.
The nexus of underweight, obesity, cognitive ability, and academic performance appears to be, at least partially, a function of age and the cognitive mechanisms necessary for academic task completion at the various grade levels. The current study looked at the effects of weight status and macronutrients drawn from the same national sample as Li and
colleagues (2008), extending the lower-limits of the age range to six years, and using an alternate, developmentally adjusted BMI centile curve with age- and sex-specific cut points (Cole et al., 2000).
Present Study
34
adolescents was elucidated by including a wide age-range, known mediators (e.g., sex, race/ethnicity, SES), as well as the amount of select macronutrients consumed (e.g., calories, fat, carbohydrates, protein, and fiber) providing further insight into possible mechanisms in this relationship. At present, research findings are inconsistent regarding the relationship between weight status, cognition, and academic performance in school-aged children.
The primary aim of the current study was to investigate the relationship between weight status, nutritional intake, working memory, visuospatial organization/planning, reading, and math performance in school-age children. Due to the cross-sectional nature of the NHANES-III data, directionality was not established. However, investigation of the relationships can provide further insight into the role of weight status on cognitive
functioning of children. Based on the current literature, it was expected that young children with BMI’s in the overweight and obese ranges would exhibit decreased EF’s in the areas of planning and working memory, as well as lower academic performance compared to normal-weight peers. In addition, it was expected that the relationship between cognitive functioning and academic performance would differ for children who were underweight, overweight, and obese, compared to their normal-weight peers. A diagram of the relationship is depicted in Figure 1.
Research Questions.
Questions.
1a. Are there differences in cognitive functioning for children at the extreme ends of the
weight spectrum, and do the effects of BMI on cognitive performance vary as a function of
35
1b. Are there differences in academic performance for children at the extreme ends of the
weight spectrum, and do the effects of BMI on academic performance vary as a function of
age or gender?
2a. What is the nature of the relationship between cognitive functioning and dietary
macronutrient intake; and does this vary as a function of age or gender?
2b. What is the nature of the relationship between academic performance and dietary
macronutrient intake; and does this vary as a function of age or gender?
3a. What is the predictive relationship of weight status, macronutrient intake, and
demographic and socioeconomic variables on cognitive functioning?
3b. What is the predictive relationship of weight status, macronutrient intake, and
CHAPTER 3
Methods
Data Source
NHANES-III
The Third National Health and Nutrition Examination Survey (NHANES-III) is a cross-sectional survey of the US population conducted by the National Center for Health Statistics (NCHS), between 1988 and 1994, on non-institutionalized civilians living in households. The sampling design used stratified, multistage probability sampling with oversampling in low-income individuals and particular age groups and ethnicities, such as African-American and Latino subpopulations.
The NHANES-III contains detailed demographic, socioeconomic, cognitive, dietary, and health-related data that was collected through in-home interviews as well as in-person examinations at a Mobile Examination Center (MEC). Specifically, the Family and
37
The NHANES-III also collected data on height, weight, cognitive functioning, and academic performance during the MEC examination for each child. An automated version of the Cognitive Tests for Children was used in both English and Spanish, requiring the
interviewer to enter responses directly into the computer while administering the four cognitive tasks. Cognitive and academic performance examinations were conducted on children ages 6- through 16-years-old, immediately following administration of the
questionnaire. The cognitive component consisted of the Block Design and the Digit Span subtests from the Wechsler Intelligence Scale for Children (WISC-R); immediately followed by the Reading and Arithmetic subtests from the Wide Range Achievement Test (WRAT-R) for academic assessment. Dietary intake on the NHANES-III was assessed using a 24-hour dietary recall interview administered to the child’s caregiver using the Dietary Data
Collection System. See the Methods and Materials section below for further details.
Study Population
Children between the ages of 6- and 16-years-old who completed the cognitive functioning assessments of the NHANES-III were included in analyses (English and Spanish speaking participants). All of the children who participated in the Household Youth
Questionnaire were included in the analyses. Children who were identified as having difficulty seeing out of one or both eyes with corrective lenses or who had trouble hearing with one or both ears after while using a hearing aid (n=574) were excluded. After
38
Measures and Materials
Cognitive Functions. Cognitive functioning was measured using a standardized
psychological assessment as part of the Mobile Examination Center (MEC) visit. The Block
Design and Digit Span subtests from the Wechsler Intelligence Scale for Children, Revised
(WISC-R; Wechsler, 1974) were selected as nonverbal and verbal components, respectively.
Block Design requires the child to reproduce designs using blocks. It is frequently linked to
EF’s in the frontal lobe, and is used to assess planning skills as they relate to visuospatial construction (Lezak, Howieson, Loring, 2004; Sattler, 1988; Wallesch, Curio, Galazky, Jost, & Synowitz, 2001). The Digit Span task requires the child to repeat a sequence of numbers spoken by an examiner, first forward and then backward. The forward exercise is generally thought to measure phonological storage capacity, while the backward portion assesses working memory (Bull et al., 2008). The automated WISC-R used by the NHANES-III yields a composite Digit Span score of both Digits Forward and Digits Backward. There is controversy over analyzing the digits forward and backward as a composite score, since
Digits Forward is linked to expressive language capabilities while Digits Backward is
associated with working memory (Rosenthal, Riccio, Gsanger, & Jarratt, 2006), as well as overgeneralizing it for a child’s profile analysis (Sattler, 1988). These WISC-R subscales have excellent reliability, internal consistency, criterion, and construct validity based on many studies (Sattler, 1988; Sattler, 1992). The WISC-R scaled scores in the NHANES-III database were standardized on age-based norms with a mean of 10 and standard deviation of three, following WISC-R norms (Sattler, 1988). For the current study, the Block Design and
Digit Span subtests were not combined to derive a proxy Full Scale IQ score; for while the
39
does not (0.43), nor do these two correlate highly with each other (0.37, p<0.05). As such, each subtest was considered individually —Block Design used as a measure of visuospatial organization and planning and Digit Span as a measure of general working memory.
Academic Performance. Scores for subtests from the Wide Range Achievement Test,
Revised (WRAT-R) were used: Arithmetic and Reading (Jastak & Wilkinson, 1984; Prewett & Fowler, 1992). Arithmetic involves oral and written math problems ranging from simple addition and subtraction to calculus, and Reading assesses recognition and word-reading skills. Both of these subtests have good reliability and validity (Jastak & Wilkinson, 1984). The WRAT-R subtests were age-normed to a mean of 100 and standard deviation of 15 (National Center for Health Statistics, 1994).
Administration of the cognitive and academic measures was automated in the NHANES-III. Examiners were required to present the material manually for the WISC-R
Block Design and the WRAT-R Reading subtests, but the recording and scoring was entered
directly by the interviewer into the computer. The test material for the WISC-R Digit Span was read to the child; however, unlike the manual administration, the digit lists appeared on the computer to facilitate scoring. Additionally, the WRAT-R Arithmetic subtest was administered to the child on paper to allow for adequate time to process, and later entered into the computer-scoring program (CDC, 2011).
Anthropometric Measures of Weight. Body Mass Index (BMI) was used to define
40
and sex-based cutoffs were used to determine weight class assignment in the current study (Cole et al., 2000), see Table 1. Height was measured to the nearest millimeter using a fixed stadiometer (Holtain Height Stadiometer), and weight to the nearest hundredths kilogram, wearing standardized gown and slippers, using the Toledo 2181 digital scale (Toledo Scale, Columbus, OH) or SECA Integra 815 sale (SECA, Rumily, France) for MEC and home examinations, respectively (National Center for Health Statistics, 1994). Using
recommendations from CDC standards, children were classified based on their BMI
percentile as obese (>95th percentile), overweight (> 85th to <95th percentiles), and normal (<85th percentile), and underweight (<5th percentile) (CDC, 2001).
Dietary Intake. Assessment of children’s dietary intake was collected during the
MEC exam using a one-day dietary recall of individual food and total nutrient ingestion (National Center for Health Statistics, 1994). For the current study, macronutrient intake was categorized into three groups (below recommended standards, meeting recommended
standards, or exceeding recommended standards), with age-based standards for
Recommended Daily Allowance , or in the case of Fat intake, Adequate Intakes (AIs) were used in lieu of RDAs (American Academy of Pediatrics Committee on Nutrition, 2009). Nutritional variables in the current study included: Total Calories (kcal), Total Protein (gm),
Total Carbohydrates (gm), and Fiber (gm) and Total Fat (gm). Appropriate intake was
based on recommended consumption for children between 6- to 16-years-old (American Academy of Pediatrics Committee on Nutrition, 2009), the cutoffs for which are in Table 2.
41
and SES. As nearly 25% of the data were missing on the level of caregiver education, a known confounder for both cognitive functioning and nutritional intake, and the variable was substantially associated with the reported poverty index, the poverty index was used as a proxy for SES. The poverty index ratio (PIR) was computed within the NHANES-III database using the reported total family income for the previous 12 months and categorized as: low (PIR < 1.30, the federal cutoff point for eligibility for the Food Stamp Program), middle (1.30 < PIR< 3.00) and high income (CDC, 1994). It was then coded as Below Poverty Level (1-0.999) or Above Poverty Level (1.00+) —the variable used in the present study. The amount of TV watched and physical activity were excluded as covariates, as they are in the causal pathway (see Discussion for further detail).
Data Preparation
Statistical Analysis
42
and (d) conducting ANOVAs an entire record was eliminated if any variable was missing. Descriptive statistics are presented in Table 3.
Cognitive and academic variables were analyzed as continuous variables. A detailed description of the database creation and preparation process using the selected variables from NHANES-III is outlined in Appendix II.
Summary
Despite the current emphasis being placed on health and nutrition in children and adolescents, there is a surprising dearth of population-based studies exploring children’s cognitive and academic performance in relation to their weight status, while controlling for the covariates often associated with deficits in these areas.
The present study explored the relationship between a child’s weight status, cognitive functioning, academic performance, and select macronutrient intake. It adds to the current debate on the relationship between these variables, extending the research by Li, Dai,
Jackson, and Zhang (2008), which reported lower visuospatial skills in overweight and obese children, by expanding the lower age range to 6 years, and include children with ADHD, using the NHANES-III data.
43
44 CHAPTER 4
Results
Description of the Sample
The mean age of the overall sample (n=5683) was 10.56 years (+/- 3.12) combining three age groups (n=1690/6-8-year-olds; n=2235/9-12-year-olds; n=1758/13-16-year-olds) (Table 3). The distribution of ethnicity was as follows: Non-Hispanic White (26.13%), Non-Hispanic Black (34.68%), and Mexican-American (35.3%); and a small portion self-identified as Other Ethnicities (3.9%). There was proportional distribution of each race/ethnicity among weight classes. Nearly half of the sample population in each of the weight classes was at or above the Federal poverty line, one-third below the Federal poverty line, and 8-15% did not
disclose income. The distribution of level of caregiver education across child weight groups was (<High School, 30.6%; High School Graduate, 23.3%); Some College Completed, 11.4%; College Graduate, 6.4%).For large proportion of the included sample, level of caregiver education was not disclosed (28.3%). Of the children included in the survey, 8.53% were identified as underweight, 65.16% as normal weight, 16.77% as overweight, and 9.54% as obese.
Question 1a. Are there differences in cognitive functioning for children at the extreme ends
of the weight spectrum, and do the effects of BMI on cognitive performance vary as a
45
This question was addressed using a 4 x 2 x 3 way analysis of variance to assess for differences on each cognitive measure (WISC-R; Block Design and Digit Span) as a function of weight class (underweight, normal weight, overweight, obese) by gender, and the three age groups, ages 6-8, 9-12, and 13-16). . Following significant interactions, post-hoc tests were conducted to evaluate pairwise differences among the means for each weight
class/gender combination. A p value <0.05 was considered a statistically significant difference and effect sizes were derived to indicate the size of differences between groups (Cohen, 1988).
Significant differences in performance were found between all four weight categories at each age group of 6-8 years, 9-12 years, and 13-16 years. Cognitive scores were
significantly lower for both sexes in the underweight category, and for males who had BMI’s in the obese range. Specific results of the contrasts and estimates are presented in Tables 4, 5, and 6, Figures 2 and 3, and described below.
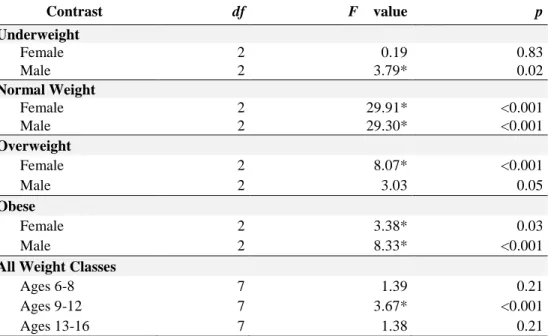
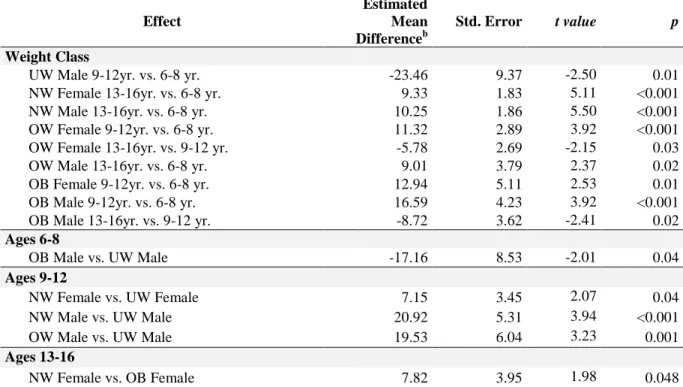
Block Design
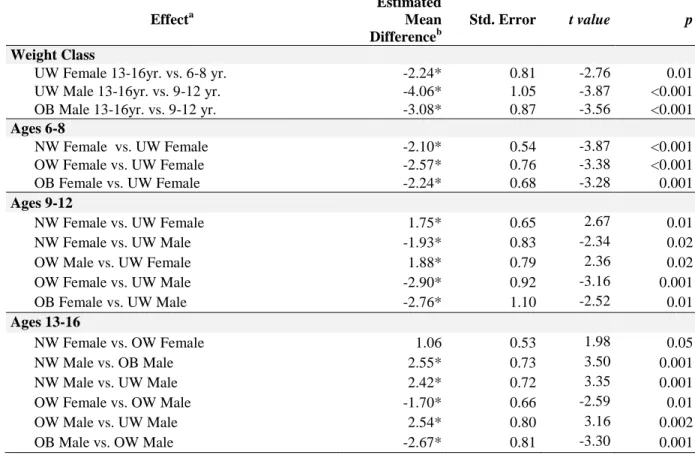
Simple effects contrast analyses (Table 5) revealed that, within the 6-8 year age range, females in the underweight category performed significantly better than females in the overweight range t (3754) = -3.38, p = .0007, and females in the obese range t (3754) = -3.28, p = .0011.
For the 9-12-year-old group, the performance of males in the 9-12-year-old age group did not differ across the underweight, normal weight, overweight and obese weight
46
For the 13- to 16-year –old age group there were two patterns of results. In one pattern, Block Design performance was in the average range for females in the underweight and normal weight categories, and males in the normal weight and overweight categories. In the second pattern, low average Block Design performance was found for females in the overweight and obese categories and males in the underweight and obese ranges. Within gender, males in the normal weight and overweight categories performed significantly better than males in the obese weight range [t (3754) = 3.50, p = .0005; t (3754) = -3.30, p = .001, respectively]. Males in the overweight range had better Block Design scores than their male peers in the underweight BMI range t (3754) = 3.16, p = .002. These results reveal that males in the normal weight and overweight BMI ranges performed better than 13-16-year-old males who were in the underweight and obese categories.
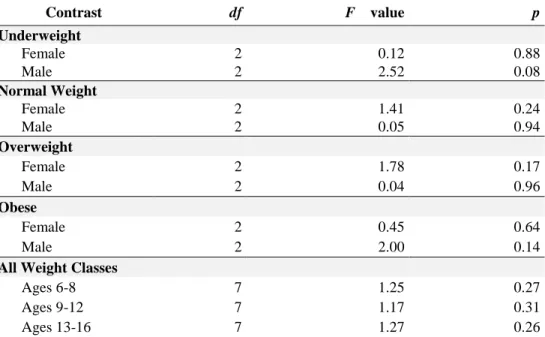
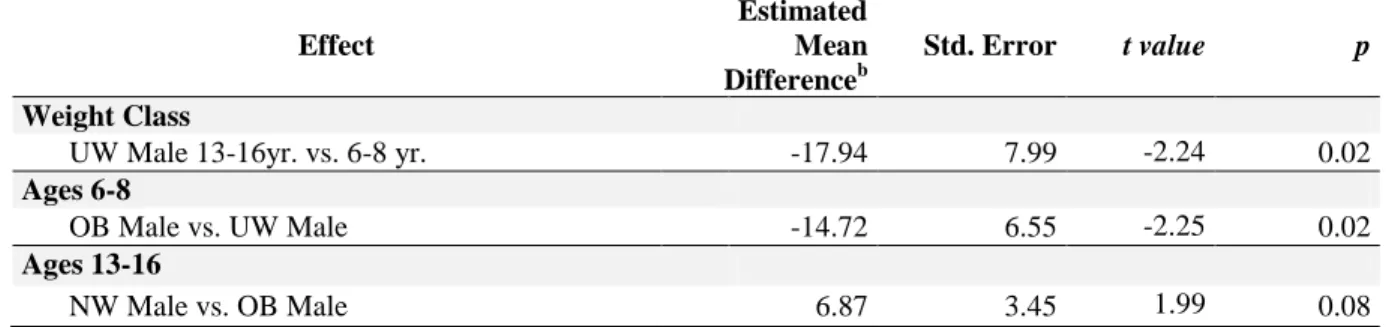
Digit Span
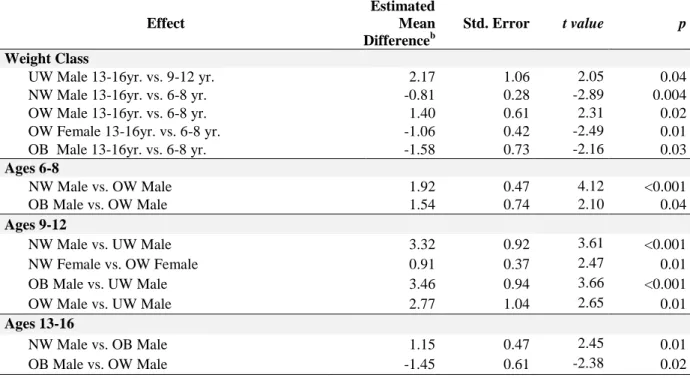
A 3-way analysis of variance was also used to assess whether children in each of the eight weight-gender categories varied in Digit Span performance across age groups. Simple effect contrasts (Table 6, Figure 3) revealed that Digit Span scores for males between the ages of 6 and 8 years in the overweight BMI range had significantly lower Digit Span scores than males with normal weight t (3754) = 4.12, p < 0.0001 and obese weight categories t
(3754) = 2.10, p = .036).