Enfuvirtide, an HIV-1 Fusion Inhibitor, for Drug-Resistant
HIV Infection in North and South America
Jacob P. Lalezari, M.D., Keith Henry, M.D., Mary O’Hearn, M.D., Julio S.G. Montaner, M.D., Peter J. Piliero, M.D., Benôit Trottier, M.D., Sharon Walmsley, M.D., Calvin Cohen, M.D., Daniel R. Kuritzkes, M.D., Joseph J. Eron, Jr., M.D.,
Jain Chung, Ph.D., Ralph DeMasi, Ph.D., Lucille Donatacci, M.S., Claude Drobnes, M.D., John Delehanty, Ph.D., and Miklos Salgo, M.D., Ph.D., for the TORO 1 Study Group*
a b s t r a c t
From Quest Clinical Research, Mount Zion Hospital, and the University of California, San Francisco, San Francisco (J.P.L.); the HIV Program, Hennepin County Medical Center, Minneapolis (K.H.); the Oregon Health and Science University, Portland (M.O.); St. Paul’s Hospital and the Uni-versity of British Columbia, Vancouver, Can-ada (J.S.G.M.); the Clinical Research Initia-tive, Albany Medical College, Albany, N.Y. (P.J.P.); the Clinique Médicale l’Actuel, Mon-treal (B.T.); the University of Toronto, To-ronto (S.W.); the Community Research Ini-tiative of New England, Boston (C.C.); the Division of Infectious Diseases, University of Colorado Health Sciences Center, Denver (D.R.K.); the University of North Carolina at Chapel Hill School of Medicine, Chapel Hill (J.J.E.); Roche, Nutley, N.J. (J.C., L.D., M.S.); and Trimeris, Durham, N.C. (R.D., C.D., J.D.). Address reprint requests to Dr. Lalezari at Quest Clinical Research, 2300 Sutter St., Suite 202, San Francisco, CA 94115, or at [email protected]. *Members of the TORO 1 (T-20 vs.
Opti-mized Regimen Only Study 1) group are listed in the Appendix.
This article was published at www.nejm.org on March 13, 2003.
N Engl J Med 2003;348:2175-85. b a c k g r o u n d
The T-20 vs. Optimized Regimen Only Study 1 (TORO 1) was a randomized, open-label, phase 3 study of enfuvirtide (T-20), a human immunodeficiency virus type 1 (HIV-1) fusion inhibitor.
m e t h o d s
Patients from 48 sites in the United States, Canada, Mexico, and Brazil with at least six months of previous treatment with agents in three classes of antiretroviral drugs, re-sistance to drugs in these classes, or both, and with at least 5000 copies of HIV-1 RNA per milliliter of plasma were randomly assigned in a 2:1 ratio to receive enfuvirtide plus an optimized background regimen of three to five antiretroviral drugs or such a regi-men alone (control group). The primary efficacy end point was the change in the plas-ma HIV-1 RNA level from base line to week 24.
r e s u l t s
A total of 501 patients underwent randomization, and 491 received at least one dose of study drug and had at least one measurement of plasma HIV-1 RNA after treatment began. The two groups were balanced in terms of the median base-line HIV-1 RNA
level (5.2 log10 copies per milliliter in both groups), median CD4+ cell count (75.5
cells per cubic millimeter in the enfuvirtide group, and 87.0 cells per cubic millimeter in the control group), demographic characteristics, and previous antiretroviral ther-apy. At 24 weeks, the least-squares mean change from base line in the viral load
(inten-tion-to-treat, last observation carried forward) was a decrease of 1.696 log10 copies
per milliliter in the enfuvirtide group, and a decrease of 0.764 log10 copies per milli-liter in the control group (P<0.001). The mean increases in CD4+ cell count were 76 cells per cubic millimeter and 32 cells per cubic millimeter, respectively (P<0.001). Reactions at the site of the injections were reported by 98 percent of patients receiving enfuvirtide. There were more cases of pneumonia in the enfuvirtide group than in the control group.
c o n c l u s i o n s
he durability of suppression of human immunodeficiency virus (HIV) in-fection with antiretroviral therapy is often limited, for reasons that include poor penetration into protected sites containing a reservoir of HIV,1,2 drug toxicity,3,4 alterations in the bioavailability and metabolism of antiretroviral drugs (e.g.,
inter-actions between drugs),5 and lack of adherence to
complex treatment regimens.6,7 These factors
con-tribute to persistent viral replication in patients receiving therapy, increasing the risk of viral
resist-ance, which can limit future treatment options.8,9
Salvage therapy after viral rebound is more success-ful if an agent from a class of antiretroviral drugs to which the patient has not previously been exposed is included in the regimen.
Enfuvirtide (also known as T-20) is a novel, syn-thetic, 36-amino-acid peptide that binds to a re-gion of the envelope glycoprotein 41 of HIV type 1 (HIV-1) that is involved in the fusion of the virus
with the membrane of the CD4+ host cell.10 This
agent exhibits potent and selective inhibition of HIV-1 in vitro without cytotoxicity10 and is the first inhibitor of HIV entry to show consistent potent ac-tivity in persons infected with HIV-1.11-14
In the T-20 vs. Optimized Regimen Only Study 1 (TORO 1), we compared the effect of enfuvirtide in combination with an antiretroviral regimen that was optimized with the aid of phenotypic and geno-typic resistance testing with the effect of an opti-mized regimen alone on plasma HIV-1 RNA levels and CD4+ cell counts in patients who had previous-ly received multiple antiretroviral drugs and carried virus that was resistant to all three currently available classes of antiretroviral drugs. A similar study (T-20 vs. Optimized Regimen Only Study 2 [TORO 2]) was conducted in Europe and Australia.15 In this article, we present the results of the week-24 primary effi-cacy and safety analyses of TORO 1.
s t u d y d e s i g n
We conducted a randomized, open-label, multi-center, phase 3 study comprising a 6-week screen-ing phase followed by 48 weeks of treatment, with an optional 48-week extension of treatment, and 4 weeks of follow-up for safety analyses. An initial screening visit, occurring three to six weeks before randomization, included a complete medical his-tory taking, measurement of plasma HIV-1 RNA (Amplicor HIV-1 Monitor, version 1.5, Roche), and genotypic and phenotypic resistance testing
(per-formed by ViroLogic, San Francisco). A second measurement of plasma HIV-1 RNA and safety as-sessments were performed at a second screening visit one to two weeks before randomization. An op-timized regimen of three to five antiretroviral drugs was selected by the investigator and the patient be-fore randomization on the basis of the patient’s pre-vious antiretroviral treatment and tolerance history and the results of previous and screening genotypic and phenotypic resistance testing.
Qualifying patients underwent randomization according to a centralized, adaptive randomization scheme and were assigned in a 2:1 ratio to one of two groups: enfuvirtide plus the optimized back-ground regimen (enfuvirtide group) or the opti-mized regimen alone (control group). Randomiza-tion was stratified according to the second plasma HIV-1 RNA measurement (<40,000 or ≥40,000 cop-ies per milliliter) and according to the use or nonuse of newly approved or investigational antiretroviral drugs (lopinavir–ritonavir, tenofovir, or both) in the optimized background regimen.
Virologic failure was defined by either a decrease from base line of less than 0.5 log10 copies per mil-liliter in plasma HIV-1 RNA on two or three consec-utive measurements after week 6, with at least 14 days between the first and last measurements, a de-crease from base line of less than 1.0 log10 copies per milliliter in plasma HIV-1 RNA on consecutive measurements (as above) after week 14, or a de-crease from base line of at least 2.0 log10 copies per milliliter in plasma HIV-1 RNA on consecutive measurements (as above) followed by a rebound of more than 1.0 log10 copies per milliliter in plasma HIV-1 RNA from the average of the two lowest val-ues (not necessarily consecutive) after week 6. All patients in whom the criteria for virologic failure were met after week 8 underwent repeated genotyp-ic and phenotypgenotyp-ic resistance testing and were en-couraged to change their background regimen. In these cases, a background regimen of more than five drugs was permitted. Patients in the enfuvirtide group could continue to receive enfuvirtide, and pa-tients in the control group were permitted to add enfuvirtide to their revised regimen. Patients with virologic failure who did not want to switch to or to continue to receive enfuvirtide were allowed to re-main in the study for a maximum of one month.
The results on the screening resistance tests were used to define phenotypic and genotypic sensitivity scores. The genotypic sensitivity score was the total number of drugs in the optimized background reg-imen to which a patient’s viral isolate showed
geno-t
typic sensitivity according to a modification of a
previously published interpretation algorithm.16
For tenofovir, genotypic resistance was defined as the presence of K65R, or three or more of the thymidine analogue–associated resistance muta-tions (M41L, D67N, K70R, L210W, T215Y, T215F, K219Q, K219E, or K219N), including either M41L or L210W. The phenotypic sensitivity score was the total number of drugs in the optimized background regimen to which a patient’s viral isolate showed phenotypic sensitivity. For tenofovir, the phenotypic sensitivity was set equal to the genotypic sensitivity.
s t u d y p o p u l a t i o n
Patients were older than 16 years of age and had at least six months of previous treatment with at least one nucleoside reverse-transcriptase inhibitor, at least one nonnucleoside reverse-transcriptase in-hibitor, and at least two protease inhibitors, docu-mented resistance to these drugs, or both. Patients were eligible for the study if they had been receiving stable combination therapy or no antiretroviral ther-apy for four or more weeks before inclusion and had a plasma HIV-1 RNA level of at least 5000 cop-ies per milliliter at both screening visits. Patients were ineligible for inclusion if they had already re-ceived treatment with enfuvirtide, the experimental fusion inhibitor T-1249, or both. Female patients were excluded if they were pregnant, breast-feeding, or planning to become pregnant during the study.
c o n s e n t , a p p r o v a l s , a n d c o n d u c t o f t h e s t u d y
Written informed consent was obtained from all patients. Before the study began, the protocol and the informed-consent provisions were reviewed and approved by the independent ethics committee or institutional review board at each of the centers in-volved in the study.
Design of the trial protocol was the responsi-bility of the study sponsors in collaboration with various health authorities and advisory boards, which included some coauthors of the article. All statistical analyses were executed by employees of the study sponsors. Data were collected by the study sponsors. Interpretation of the data was performed by the study sponsors in collaboration with the ad-visory boards and the clinical investigators.
s t u d y m e d i c a t i o n
Enfuvirtide (90 mg) was administered twice daily by subcutaneous injection into the abdomen, the upper arm, or the anterior aspect of the thigh. The
first injection was administered by study personnel at the study site, and patients were trained in sterile technique and instructed in reconstituting and in-jecting enfuvirtide.
The optimized background regimen could in-clude tenofovir, lopinavir–ritonavir, or both. Both of these agents were investigational at the start of the study but were approved in most countries during the course of the study. Ritonavir at doses of 266 mg per day or less (i.e., booster doses) was not counted as an active component in either a prestudy regi-men or the background regiregi-men. Changes in the background regimen were permitted only in the event of protocol-defined virologic failure or man-agement of toxic effects. Adherence in both treat-ment groups was calculated with the use of a patient questionnaire that assessed the number of missed doses of enfuvirtide or oral antiretroviral drugs dur-ing the four days preceddur-ing each study visit.
e f f i c a c y a n a l y s i s
The primary efficacy end point was the change from base line to 24 weeks in the plasma HIV-1 RNA level (measured on a logarithmic [base 10] scale). Sec-ondary efficacy end points included the category of virologic response, the time to virologic failure, and the changes from base line to week 24 in the CD4+ cell count. Virologic response at week 24 was classi-fied into three categories: an HIV-1 RNA level of less than 50 copies per milliliter, an HIV-1 RNA level of less than 400 copies per milliliter, or a decrease from base line in the HIV-1 RNA level of at least 1.0 log10 copies per milliliter; two consecutive measurements were required for categorization.
s a f e t y a n a l y s i s
Safety end points included adverse events, serious adverse events (including death), adverse events leading to premature withdrawal from the study, local reactions at the site of the injections, and ab-normal results on clinical laboratory tests (hema-tology, serum chemistry, and urinalysis). The sever-ity of adverse events was graded according to the modified grading scale of the AIDS Clinical Trials Group.17 Causality was assessed in all cases; if the study treatment was deemed to have caused the event, investigators attributed it to the entire regi-men, except in the case of serious adverse events, which were attributed to individual agents.
sig-nificant or life-threatening or resulted in a new or prolonged hospitalization or persistent or substan-tial incapacity or death) or recurrent grade 3 injec-tion-site reactions (severe pain requiring nontopical analgesic agents or limiting the patient’s ability to engage in usual activities), enfuvirtide therapy was discontinued. All grade 4 injection-site reactions and laboratory abnormalities except grade 4 triglyc-eride values were also defined as serious adverse events.
An additional updated safety analysis combined data from the two phase 3 studies (TORO 1 and TORO 2). This combination offered a larger pop-ulation on which to base a characterization of the safety profile of enfuvirtide and was appropriate because the studies have similar designs, criteria for patient selection, and protocol-specified analyses. For this update, a separate analysis investigated the incidence of combinations of adverse events that might be considered clinically equivalent in order to identify whether small increases in the incidence of several adverse events would, when combined, show a relevant difference between treatment groups.
s t a t i s t i c a l a n a l y s i s
Data on efficacy were analyzed for an intention-to-treat population, defined as all patients who un-derwent randomization, received at least one dose of study medication, and had at least one plasma HIV-1 RNA measurement after treatment began. HIV-1 RNA values obtained after confirmed viro-logic failure were excluded from the analysis. Miss-ing values were imputed for the analysis with the use of a last-observation-carried-forward method.
The log10 HIV-1 RNA value at week 24 was defined
as the mean of the last two log10 HIV-1 RNA values on completion of 24 weeks in the study, the mean of the two HIV-1 RNA values that confirmed viro-logic failure, or for patients who withdrew from the study, the mean of the last two log10 HIV-1 RNA val-ues before withdrawal. Changes from base line to
week 24 in log10 HIV-1 RNA levels and CD4+ cell
counts were evaluated by analysis of covariance in-cluding terms for the randomization stratum (of plasma HIV-1 RNA level and use or nonuse of new-ly approved or investigational agents), the treatment group, and the interaction between stratum and treatment group, with the base-line phenotypic sen-sitivity score (for the evaluation of the change in the HIV-1 RNA level) or the base-line CD4+ cell count (for the evaluation of the change in the CD4+ cell count) as covariates.
To test the robustness of the results of the pri-mary efficacy analysis based on the last-observa-tion-carried-forward method of imputation, three sensitivity analyses were performed as follows: the change from base line in viral load was set at zero for patients who withdrew before week 24; the change from base line in viral load was set at zero for patients who withdrew or who had virologic fail-ure before week 24; and in a cohort analysis, sepa-rate analyses were performed without the use of the last-observation-carried-forward method for pa-tients who completed 4, 8, 12, 16, 20, and 24 weeks of treatment.
For analysis of categories of virologic response (with patients who had missing data or virologic failure treated as having had no response), a strati-fied Mantel–Haenszel test was used. Time to viro-logic failure was estimated by the Kaplan–Meier method. A stratified log-rank test was used to com-pare the time-to-event curves of the two treatment groups.
s t u d y p o p u l a t i o n
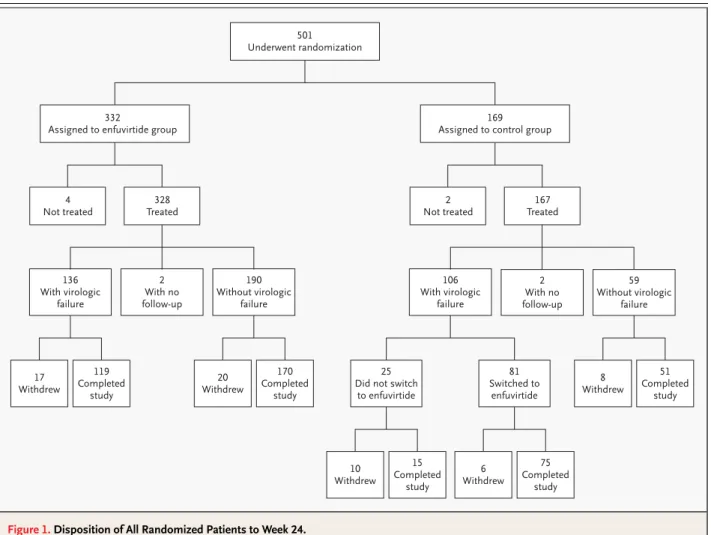
A total of 501 patients underwent randomization at 48 centers in the United States, Canada, Mexico, and Brazil between December 2000 and June 2001. Of these patients, 491 (326 in the enfuvirtide group and 165 in the control group) used the study medication at least once, had a follow-up visit to record safety-related data, and had an assessment of the HIV-1 RNA level after treatment began (Fig. 1).
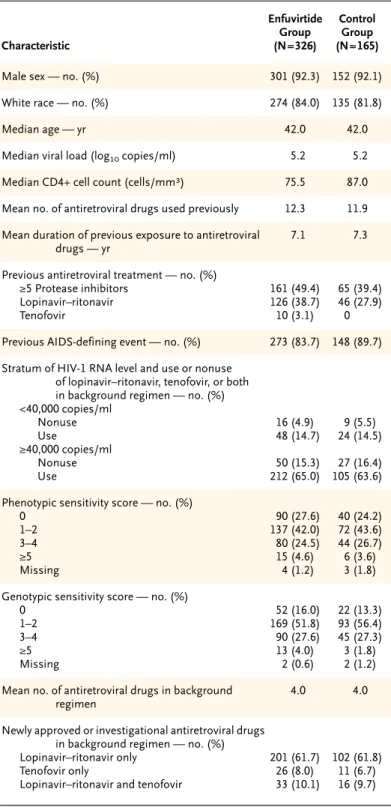
d e m o g r a p h i c a n d b a s e - l i n e c h a r a c t e r i s t i c s o f t h e p a t i e n t s
Demographic and base-line characteristics were similar in the two groups (Table 1). The genotypic sensitivity scores at base line (mean, 1.9 in each group) and the phenotypic sensitivity scores at base line (mean, 1.7 in the enfuvirtide group and 1.8 in the control group) indicated that HIV-1 from the ma-jority of patients in each group was sensitive to less than two of the drugs used in the background reg-imen. Previous treatment with at least five protease inhibitors was reported for a slightly higher per-centage of patients in the enfuvirtide group (49.4 percent) than in the control group (39.4 percent, P=0.04). The percentage of patients who had pre-viously received lopinavir–ritonavir, classified as a newly approved or investigational antiretroviral drug in this study, was also higher in the enfuvirtide
group (38.7 percent) than in the control group (27.9 percent, P=0.02). In both groups, there was a mean of four drugs in the background regimen (Table 1).
c h a n g e s i n t r e a t m e n t a n d p r e m a t u r e w i t h d r a w a l
In the control group, 106 patients (64.2 percent) had protocol-defined virologic failure by week 24, and 81 of these patients switched to enfuvirtide (Fig. 1). By week 24, 37 patients in the enfuvirtide group (11.3 percent), 18 patients remaining in the control group (21.4 percent), and 6 of the patients who had switched to enfuvirtide (7.4 percent) had withdrawn from the study.
a d h e r e n c e
The mean level of adherence to the enfuvirtide com-ponent of the regimen over the 24-week period was
at least 85 percent in 92.9 percent of patients. The overall adherence to the entire regimen in the enfu-virtide group was at least 85 percent in 88.0 percent of patients. The mean level of adherence to the back-ground regimen in the control group was at least 85 percent in 90.3 percent of patients.
e f f i c a c y
Changes in the Plasma HIV-1 RNA Level
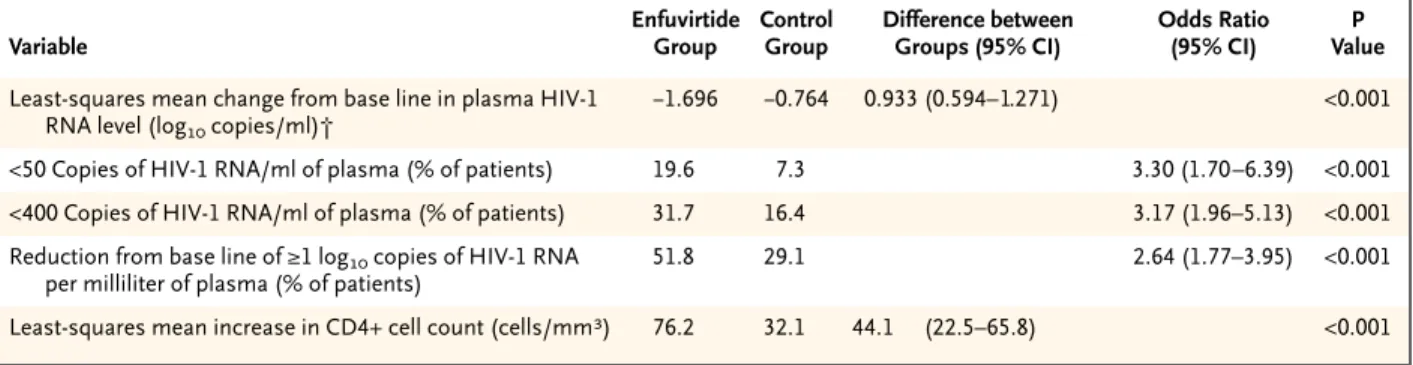
The least-squares mean change from base line in the plasma HIV-1 RNA level was a decrease of 0.764 log10 copies per milliliter in the control group and a decrease of 1.696 log10 copies per milliliter in the enfuvirtide group, representing a difference be-tween groups of 0.933 log10 copies per milliliter (P< 0.001) (Table 2). The least-squares mean differences significantly favored the enfuvirtide group in all four randomization strata (P<0.05 for all comparisons). Figure 1. Disposition of All Randomized Patients to Week 24.
Virologic failure was defined as outlined in the Methods section.
501 Underwent randomization
332
Assigned to enfuvirtide group
4 Not treated
328 Treated
2 Not treated
167 Treated
17 Withdrew
119 Completed
study
20 Withdrew
170 Completed
study
8 Withdrew
51 Completed
study 2
With no follow-up 136
With virologic failure
190 Without virologic
failure
2 With no follow-up 106
With virologic failure
59 Without virologic
failure 169
Assigned to control group
10 Withdrew
15 Completed
study 25 Did not switch
to enfuvirtide
6 Withdrew
75 Completed
study 81 Switched to
The sensitivity analyses yielded least-squares mean differences of 0.888 log10 copies per milliliter (P< 0.001) when the change from base line in viral load was set at zero for patients who withdrew from the study and 0.802 log10 copies per milliliter (P<0.001) when the change from base line in viral load was set at zero for both patients who withdrew and those who had virologic failure. The least-squares mean difference also remained significant (P<0.05) in each of the cohort analyses performed at time points up to week 24. At week 24, the proportion of pa-tients in each category of response was significantly greater in the enfuvirtide group than in the control group (Table 2).
The percentage of patients with virologic failure by week 8 was greater in the control group (33.3 per-cent) than in the enfuvirtide group (16.0 perper-cent), and this difference persisted to week 24 (control group, 64.2 percent; enfuvirtide group, 41.7 per-cent). The distribution of the time to virologic failure was significantly different between the two groups (P<0.001 by the log-rank test) (Fig. 2). The median time to virologic failure was 99 days in the control group but could not be estimated in the enfuvirtide group.
Changes in CD4+ Cell Counts
At week 24, the increase from base line in the CD4+ cell count was significantly greater in the enfuvirtide group than in the control group (Table 2).
s a f e t y
Injection-Site Reactions
At week 24, nearly all patients in the enfuvirtide group (98.2 percent) had had at least one injection-site reaction, with most having their first reaction during week 1. Among patients who had pain or discomfort from injection-site reactions, most had either mild tenderness (49.7 percent) or moderate pain without limitation of usual activities (41.7 per-cent); 8.7 percent had pain or discomfort requir-ing nontopical analgesic agents or limitrequir-ing usual activities, and none required hospitalization. Fre-quent symptoms of injection-site reactions includ-ed erythema (in 87.1 percent of patients), induration (in 84.0 percent), and nodules and cysts (in 81.6 per-cent). There was no evidence of an increase in the severity of injection-site reactions over time. Only small percentages of patients (2.8 percent in the en-fuvirtide group and 1.2 percent in the group that switched to enfuvirtide) discontinued treatment with enfuvirtide because of injection-site reactions.
* There were 401 patients in the intention-to-treat population in the United States, 66 in Canada, 15 in Mexico, and 9 in Brazil. The genotypic and pheno-typic sensitivity scores were calculated as described in the Methods section. AIDS denotes the acquired immunodeficiency syndrome.
Table 1. Demographic and Base-Line Characteristics of the Patients in the Intention-to-Treat Population.*
Characteristic Enfuvirtide Group (N=326) Control Group (N=165)
Male sex — no. (%) 301 (92.3) 152 (92.1)
White race — no. (%) 274 (84.0) 135 (81.8)
Median age — yr 42.0 42.0
Median viral load (log10 copies/ml) 5.2 5.2
Median CD4+ cell count (cells/mm3) 75.5 87.0
Mean no. of antiretroviral drugs used previously 12.3 11.9
Mean duration of previous exposure to antiretroviral drugs — yr
7.1 7.3
Previous antiretroviral treatment — no. (%) ≥5 Protease inhibitors
Lopinavir–ritonavir Tenofovir 161 (49.4) 126 (38.7) 10 (3.1) 65 (39.4) 46 (27.9) 0
Previous AIDS-defining event — no. (%) 273 (83.7) 148 (89.7)
Stratum of HIV-1 RNA level and use or nonuse of lopinavir–ritonavir, tenofovir, or both in background regimen — no. (%) <40,000 copies/ml Nonuse Use ≥40,000 copies/ml Nonuse Use 16 (4.9) 48 (14.7) 50 (15.3) 212 (65.0) 9 (5.5) 24 (14.5) 27 (16.4) 105 (63.6)
Phenotypic sensitivity score — no. (%) 0 1–2 3–4 ≥5 Missing 90 (27.6) 137 (42.0) 80 (24.5) 15 (4.6) 4 (1.2) 40 (24.2) 72 (43.6) 44 (26.7) 6 (3.6) 3 (1.8)
Genotypic sensitivity score — no. (%) 0 1–2 3–4 ≥5 Missing 52 (16.0) 169 (51.8) 90 (27.6) 13 (4.0) 2 (0.6) 22 (13.3) 93 (56.4) 45 (27.3) 3 (1.8) 2 (1.2)
Mean no. of antiretroviral drugs in background regimen
4.0 4.0
Newly approved or investigational antiretroviral drugs in background regimen — no. (%) Lopinavir–ritonavir only
Tenofovir only
Lopinavir–ritonavir and tenofovir
Adverse Events at Week 24
Because of the 2:1 ratio for randomization, the de-sign of the study allowing patients in the control group to switch to enfuvirtide, and the lower rate of virologic failure in the enfuvirtide group after 24 weeks of treatment, the total number of patient-years of exposure to the randomly assigned treat-ment regimen was approximately 2.5 times as high in the enfuvirtide group (162.8 patient-years) as in the control group (64.9 patient-years). After 24 weeks, 77.6 percent of patients in the enfuvirtide group and 74.5 percent in the control group had had an adverse event (excluding injection-site re-actions) that was related to the treatment regimen. Diarrhea, nausea, and fatigue were the most fre-quently reported treatment-related adverse events in both groups (Table 3). Peripheral neuropathy and decreased appetite were the only treatment-related adverse events that occurred with a frequency at least 5 percent higher in the enfuvirtide group than in the control group.
Overall, 22 patients in the enfuvirtide group (6.7 percent) and 8 patients in the control group (4.8 per-cent) had adverse events with onset before week 24 that led to withdrawal from the study. The most fre-quent adverse events leading to withdrawal were vomiting in both groups (in 1.2 percent of patients in the enfuvirtide group and 1.2 percent of those in the control group), nausea in both groups (in 0.9 percent of patients in the enfuvirtide group and 1.2 percent of those in the control group), and diarrhea in the control group (1.2 percent). All other adverse
events leading to withdrawal occurred in 0.6 per-cent of patients or less. Two patients who switched to enfuvirtide (2.5 percent) had adverse events that began after the switch and subsequently led to with-drawal from the study; these events were diarrhea in one patient and progression of the acquired immu-nodeficiency syndrome in the other patient. Similar percentages of patients in the two groups died (1.2 percent [four patients] in the enfuvirtide group and 2.4 percent [four patients] in the control group) or
* Plasma samples were obtained at every visit, and quantitative analysis of HIV-1 RNA levels was performed by a central laboratory (Covance Central Laboratory Services, Indianapolis) with the Amplicor HIV-1 Monitor, version 1.5 (Roche). Samples found by this test to contain fewer than 400 copies of HIV-1 RNA per milliliter were retested with ultrasensitive preparation of the sample in order to detect as few as 50 copies per milliliter. CD4+ cell counts were assessed with the use of standard techniques for flow cytometry. The last-observation-carried-forward method was used for the analysis of least-squares mean changes. CI denotes confidence interval.
† A negative number represents a decrease.
Table 2. Efficacy at Week 24 in the Intention-to-Treat Population.*
Variable
Enfuvirtide Group
Control Group
Difference between Groups (95% CI)
Odds Ratio (95% CI)
P Value
Least-squares mean change from base line in plasma HIV-1 RNA level (log10 copies/ml)†
¡1.696 ¡0.764 0.933 (0.594– 1.271) <0.001
<50 Copies of HIV-1 RNA/ml of plasma (% of patients) 19.6 7.3 3.30 (1.70–6.39) <0.001
<400 Copies of HIV-1 RNA/ml of plasma (% of patients) 31.7 16.4 3.17 (1.96–5.13) <0.001
Reduction from base line of ≥1 log10 copies of HIV-1 RNA per milliliter of plasma (% of patients)
51.8 29.1 2.64 (1.77–3.95) <0.001
Least-squares mean increase in CD4+ cell count (cells/mm3) 76.2 32.1 44.1 (22.5–65.8) <0.001
Figure 2. Time to Protocol-Defined Virologic Failure, as of Week 24.
Data were censored at the time of discontinuation of treatment. The analysis was conducted using the intention-to-treat population.
No. at Risk Enfuvirtide Control
311 161
183 58 241
91
Proportion without Virologic Failure
Time to Virologic Failure (wk) 1.00
0.75
0.50
0.25
0.00
0 2 4 6 8 10 12 14 16 18 20 22 24 26 28 Enfuvirtide group
had a serious adverse event while receiving the treat-ment to which they were originally assigned (25.8 percent in the enfuvirtide group and 21.2 percent in the control group).
Updated Safety Analysis
The updated safety analysis included 663 patients in the enfuvirtide groups and 334 patients in the control groups from TORO 1 and TORO 2. At the time of the updated analysis, 229 patients originally assigned to the control group had switched, adding enfuvirtide to their regimen. Because of the 2:1 ratio of randomization and the study design that allowed switching to enfuvirtide, patients in the original en-fuvirtide group had 813 patient-years of exposure (median, 1.48 years per patient; range, <0.01 to 1.92) and patients in the control group had 163 patient-years of exposure (median, 0.35 year per patient; range, 0.04 to 1.60; ratio, 5:1). Patients exposed to enfuvirtide after switching had 214 tient-years of exposure (median, 1.08 years per pa-tient; range, <0.01 to 1.71). Results were adjusted for exposure (presented in terms of the number of patients with an event per 100 patient-years of expo-sure), with all the patients exposed to enfuvirtide
combined into one group (with a total of 1027 pa-tient-years of exposure) and compared with the con-trol group.
This update generally confirmed the safety pro-file seen at 24 weeks, with the following observa-tions. Although the overall incidence of bacterial infections was similar in the two treatment groups after adjustment for exposure (183 patients in the combined enfuvirtide groups [20.5 percent], or 17.8 per 100 patient-years of exposure, and 30 patients in the control group [9.0 percent], or 18.4 per 100 patient-years of exposure; P=0.56), pneumonia, pri-marily bacterial, occurred more frequently in the combined enfuvirtide group (50 patients [5.6 per-cent], or 4.9 per 100 patient-years) than in the con-trol group (1 patient [0.3 percent], or 0.6 per 100 patient-years; P=0.02). Sepsis occurred more fre-quently in the combined enfuvirtide group (16 pa-tients [1.8 percent], or 1.6 per 100 patient-years, vs. 2 patients [0.6 percent], or 1.2 per 100 patient-years, in the control group), but the exposure-adjust-ed rates were not significantly different (P=0.37).
Two patients had cases of systemic hypersensi-tivity reaction (both in TORO 1) that were consid-ered to be related to enfuvirtide therapy, and both recurred on rechallenge. In the first patient, who was taking enfuvirtide in combination with didan-osine, stavudine, amprenavir, and ritonavir, rash, fever, and vomiting developed after eight days of treatment. On rechallenge on days 17 and 22 of the study, rash, fever, and vomiting recurred with-in hours after the admwith-inistration of enfuvirtide. The eosinophil count increased progressively from 280 per cubic millimeter at base line (upper limit of normal, 570 per cubic millimeter) to 350 per cubic millimeter on day 12 of the study and 690 per cu-bic millimeter on day 15. Membranoproliferative glomerulonephritis developed in the second pa-tient after 57 days of therapy with enfuvirtide in combination with tenofovir, lamivudine, lopinavir– ritonavir, amprenavir, and efavirenz. This patient had a history of diabetes, seasonal allergies, pro-teinuria, and hematuria. On rechallenge with all an-tiretroviral drugs on day 223, severe respiratory dis-tress developed. No eosinophilia or increase from base line in the eosinophil count was noted.
Treatment-related eosinophilia (>700 cells per cubic millimeter) occurred in a greater proportion of patients in the enfuvirtide group (74 of 662 pa-tients who could be evaluated [11.2 percent], or 11.5 patients per 100 patient-years) than in the control group (8 of 332 patients who could be
eval-* Data are for events that are not otherwise specified or not elsewhere classified.
Table 3. Treatment-Related Adverse Events Occurring in at Least 5 Percent of the Patients in Either Group.
Variable
Enfuvirtide Group (N=326)
Control Group (N=165)
number (percent)
Patients with ≥1 event 253 (77.6) 123 (74.5)
Adverse event
Diarrhea* 79 (24.2) 63 (38.2)
Nausea 72 (22.1) 48 (29.1)
Fatigue 64 (19.6) 28 (17.0)
Peripheral neuropathy* 36 (11.0) 9 (5.5)
Insomnia 32 (9.8) 10 (6.1)
Headache 29 (8.9) 15 (9.1)
Decreased appetite* 26 (8.0) 5 (3.0)
Vomiting* 25 (7.7) 21 (12.7)
Dizziness (except vertigo) 24 (7.4) 7 (4.2)
Weight loss 18 (5.5) 6 (3.6)
uated [2.4 percent], or 4.9 patients per 100 patient-years). Eosinophilia was not associated with clini-cal events suggestive of systemic hypersensitivity.
Aside from eosinophilia, differences between the groups in the incidence of treatment-related grade 3 or grade 4 laboratory abnormalities were small, and no consistent pattern was evident to sug-gest a definitive association of enfuvirtide with any particular laboratory abnormality.
Our trial was designed specifically to evaluate a new class of anti–HIV-1 compounds in patients who have received treatment with multiple drugs. Resist-ance testing was used to construct an optimized background regimen for all patients in the trial. Along with the criteria for switching to enfuvirtide and the use of lopinavir–ritonavir and tenofovir, this approach allowed patients access to the best possi-ble treatment options. This fact is reflected by the relatively high proportion of patients in the control group with responses to treatment despite the ex-tensive resistance to antiretroviral drugs in this pop-ulation of patients. This positive outcome was also due in part to the high level of adherence to treat-ment among patients in the control group (≥85 per-cent adherence in 90.3 perper-cent of patients). The benefit of enfuvirtide was demonstrated by signifi-cant differences between the two treatment groups at week 24 in the magnitude of the reduction in the plasma HIV-1 RNA level, the proportion of patients in each category of virologic response, the distribu-tion of time to virologic failure, and the increase in the CD4+ cell count.
Although the last-observation-carried-forward method can overestimate the individual drug effect if the HIV-1 RNA level rebounds quickly after viro-logic failure, it was chosen to provide a consistent rule for handling patients in either group who dis-continued treatment or had virologic failure, as well as for those who switched to enfuvirtide.18,19 The robustness of the primary result was confirmed by three stringent sensitivity analyses that clearly showed that the magnitude of the estimate of the effect of enfuvirtide treatment was not determined primarily by the method of imputation.
Overall, except for local injection-site reactions, the safety and tolerability of enfuvirtide in combina-tion with an optimized background regimen were similar to those of the background regimen alone over the course of 24 weeks of therapy. The safety
results obtained from the combined TORO 1 and TORO 2 studies after longer exposure to enfuvirtide showed a higher rate of pneumonia among patients receiving enfuvirtide than among patients in the control group, but the overall incidence of bacterial infection was similar in the two groups.
Two patients had a hypersensitivity reaction that was considered to be related to enfuvirtide thera-py and that recurred with rechallenge. There was a higher incidence of eosinophilia among patients receiving enfuvirtide, even after adjustment for the duration of exposure. Review of the cases of indi-vidual patients with eosinophilia did not reveal any clinical adverse events suggestive of hypersensitiv-ity to enfuvirtide.
Injection-site reactions were the most common events associated with enfuvirtide treatment, occur-ring in most patients who received the drug, but pain or discomfort requiring analgesics or limit-ing usual activities occurred in only 8.7 percent. Only a small number of patients discontinued enfuvirtide therapy because of an injection-site reaction (2.8 percent of patients assigned to the enfuvirtide group and 1.2 percent of patients who switched to enfu-virtide). There was a high rate of adherence to en-fuvirtide treatment, suggesting that injection-site reactions were not treatment-limiting.
In our study, enfuvirtide resulted in significant improvement in virologic and immunologic re-sponses as compared with individualized, opti-mized, combination antiretroviral therapy alone. These findings are supported by the similar results
obtained in the TORO 2 trial.15 These two studies
provide firm proof of principle that HIV-1 glyco-protein 41 is a viable target for effective treatment of HIV-1 infection. A week-48 analysis will be per-formed in both trials to assess the durability of the response to enfuvirtide. The introduction of enfu-virtide as the first of this new class of antiretroviral agent could make an important contribution to the successful, individualized treatment of growing numbers of patients who have limited remaining treatment options.
Supported by Roche and Trimeris.
Dr. Lalezari reports having received consulting and lecture fees from Roche and Trimeris. Dr. Henry reports having received con-sulting or lecture fees from Abbott, Agouron, Bristol-Myers Squibb, Gilead, GlaxoSmithKline, and Merck and grant support from Bris-tol-Myers Squibb, GlaxoSmithKline, and Roche. Dr. Montaner re-ports having received consulting or lecture fees or grant support from Abbott, Agouron, Shire BioChem, Boehringer Ingelheim, Bristol-Myers Squibb, Dupont Pharma, Gilead Sciences, Glaxo Wellcome, Roche, Kucera Pharmaceutical, Merck Frosst, and Pharmacia & Upjohn. Dr. Piliero reports having received consulting and lecture fees from Roche Laboratories and grant support from Roche and
Trimeris. Dr. Trottier reports having received consulting or lecture fees from Roche, Bristol-Myers Squibb, Agouron, and Abbott. Dr. Walmsley reports having received consulting or lecture fees from Abbott, Aguoron, Boehringer Ingelheim, Bristol-Myers Squibb, Dupont, GlaxoSmithKline, and Merck and grant support from Abbott, GlaxoSmithKline, and Boehringer Ingelheim. Dr. Cohen reports having received consulting fees, lecture fees, or grant support from Roche, Bristol-Myers Squibb, Abbott, Gilead, Boehringer Ingelheim, GlaxoSmithKline, and Trimeris. Dr.
Ku-ritzkes reports having received consulting or lecture fees from Abbott, Bayer–Visible Genetics, Bristol-Myers Squibb, Gilead– Triangle, GlaxoSmithKline, Merck, Roche, Shire BioChem, Se-rono, Trimeris, Ortho Biotech, and ViroLogic and grant support from Roche, Trimeris, GlaxoSmithKline, Bristol-Myers Squibb, and Tanox. Dr. Eron reports having received consulting and lec-ture fees from Roche and grant support from Abbott, Merck, Roche, and Trimeris.
We are indebted to the patient volunteers who took part in the trial.
a p p e n d i x
In addition to the authors, the TORO 1 Study Group included the following institutions and persons: C. Farthing and E. Graham (AHF Re-search, Los Angeles); M. Packard and L. Ngo (AIDS Clinical Research Unit, University of North Carolina at Chapel Hill, Chapel Hill); M. Le-derman and J. Baum (AIDS Clinical Trials Unit, Case Western Reserve University, University Hospitals of Cleveland, Cleveland); R. Pollard, S. Rauf, and W. Silkowski (AIDS Clinical Trials Unit, University of Texas Medical Branch, Galveston); M. Thompson and A. Rucker (AIDS Research Consortium of Atlanta, Atlanta); M. Harris and G. Larsen (AIDS Research Program, St. Paul’s Hospital, Vancouver, B.C., Canada); S. Preston and D. Cunningham (Albany Medical College, Albany, N.Y.); D. Guimaraes, A. Bertasso, and T. Kinchelow (Roche, Nutley, N.J.); R. Myers and B. Casimir (Body Positive, Phoenix, Ariz.); P.R. Skolnik and B. Adams (Boston University Medical Center, Boston); O.H.M. Leite and M. Oliveira (Casa da AIDS, Hospital das Clínicas da Faculdade de Medicina da Universidade de São Paulo, São Paulo, Brazil); E. Lefebvre and B. Gomez (Clinique Médicale l’Actuel, Montreal); K.B. Foy (Community Research Initiative of New England, Boston); H. Lam-piris and S. Charles (Department of Veterans Affairs Medical Center, San Francisco, and University of California, San Francisco); J. Dobkin and M. Crawford (Division of Infectious Diseases, Columbia University, New York); T. Slom, R. Murphy, and T. Mikaitis (Division of Infec-tious Diseases, Northwestern University, Chicago); J. Witek and R. Anthony (Drexel University College of Medicine, Philadelphia); G. Rich-mond and V.F. Appleby (Fort Lauderdale, Fla.); F. Smaill and L. Kelleher (Hamilton Health Sciences, McMaster University Hospital, Hamil-ton, Ont., Canada); L. Nieto and S. Trevino (Hospital Gabriel Mancera, Mexico City, Mexico); M. Schechter and B. Fonseca (Hospital Universitario Clementino Fraga Filho, Universidade Federal do Rio de Janeiro, Rio de Janeiro, Brazil); E. DeJesus and R. Ortiz (Infectious Diseases Consultants Research Initiative, Altamonte Springs, Fla.); J. Wheat, M. Goldman, and D.K. O’Connor (Division of Infectious Dis-eases, Indiana University, Indianapolis); J.G. Sierra-Madero and S. Niño-Oberto (Instituto Nacional de Ciencias Médicas y Nutrición Salva-dor Zubirán, Mexico City, Mexico); J.E. Gallant and L. Apuzzo (Johns Hopkins University School of Medicine, Baltimore); N. Basgoz and K. Habeeb (Massachusetts General Hospital AIDS Clinical Trials Unit, Boston); P. Alpert and S. Thomas (Montefiore Medical Center, New York); T. Miller and T. Kempner (Oregon Health and Science University, Portland); P.R. Wolfe and J. Bautista (Pacific Oaks Research, Beverly Hills, Calif.); H.L. Martin and M.E. Morton (Park Nicollet Medical Center, St. Louis Park, Minn.); D. Henry and S. Kilcoyne (Pennsylvania Oncology Hematology Associates, Philadelphia); E. Glutzer (Quest Clinical Research, San Francisco); C. Rivera-Vazquez and Z. Pomales (Veterans Affairs Medical Center, San Juan, Puerto Rico); N. Bellos and L.A. Hoffman (Southwest Infectious Disease Associates, Dallas); B. Olmscheid, O. Klein, and M. Miller (St. Vincent’s Medical Center, New York); C.R. Steinhart and A. Liebmann (Steinhart Medical Associ-ates, Miami); S. Williams and L. Springate (The Vancouver Clinic, Vancouver, Wash.); K. Logue (Toronto Hospital, University of Toronto, Toronto); L. Smiley and G.D. Miralles (Trimeris, Durham, N.C.); R. Haubrich and K. Nuffer (University of California, San Diego, San Di-ego); G. Beatty and S. O’Leary (University of California, San Francisco, HIV Clinical Trials Group at San Francisco General Hospital, San Francisco); D. Rouleau and S. Dufresne (Unité Hospitalière de Recherche, d’Enseignement et de Soins sur le SIDA du Centre Hospitalier de l’Université de Montréal, Hôpital Notre-Dame, Montreal); J.M. Kilby, M. Saag, and K. Upton (University of Alabama at Birmingham, Bir-mingham); J. Feinberg and P. Kohler (University of Cincinnati, Cincinnati); T.B. Campbell and B.A. Putnam (University of Colorado Health Science Center, Denver); S.A. Riddler and R.R. Rosener (University of Pittsburgh, Pittsburgh); B.J. Barnett and I. Hansen (University of Tex-as Houston Medical School, Houston); A.C. Collier and B.A. Royer (University of WTex-ashington AIDS Clinical Trials, Seattle); D.W. HaTex-as and M. Morgan (Vanderbilt AIDS Clinical Trials Center, Nashville); K. Sathasivam and J. Hersch (Whitman–Walker Clinic, Washington, D.C.).
r e f e r e n c e s
1. Hoetelmans RM. Sanctuary sites in HIV-1 infection. Antivir Ther 1998;3:Suppl 4:13-7.
2. Lafeuillade A, Solas C, Halfon P, Chada-paud S, Hittinger G, Lacarelle B. Differenc-es in the detection of three HIV-1 protease inhibitors in non-blood compartments: clin-ical correlations. HIV Clin Trials 2002;3: 27-35.
3. Dieleman JP, Jambroes M, Gyssens IC, et al. Determinants of recurrent toxicity-driven switches of highly active antiretroviral therapy: the ATHENA cohort. AIDS 2002;16: 737-45.
4. Moyle G, Carr A. HIV-associated lipo-dystrophy, metabolic complications, and an-tiretroviral toxicities. HIV Clin Trials 2002; 3:89-98.
5. Dresser GK, Spence JD, Bailey DG. Pharmacokinetic-pharmacodynamic conse-quences and clinical relevance of cytochrome
P450 3A4 inhibition. Clin Pharmacokinet 2000;38:41-57.
6. Casado JL, Sabido R, Perez-Elias MJ, et al. Percentage of adherence correlates with the risk of protease inhibitor treatment fail-ure in HIV-infected patients. Antivir Ther 1999;4:157-61.
7. Raboud JM, Harris M, Rae S, Montaner JS. Impact of adherence on duration of viro-logical suppression among patients receiv-ing combination antiretroviral therapy. HIV Med 2002;3:118-24.
8. Race E, Dam E, Obry V, Paulous S, Clavel F. Analysis of HIV cross-resistance to pro-tease inhibitors using a rapid single-cycle recombinant virus assay for patients failing on combination therapies. AIDS 1999;13: 2061-8.
9. Van Vaerenbergh K, Van Laethem K, Albert J, et al. Prevalence and characteristics of multinucleoside-resistant human
immu-nodeficiency virus type 1 among European patients receiving combinations of nucleoside analogues. Antimicrob Agents Chemother 2000;44:2109-17.
10.Wild C, Greenwell T, Matthews T. A syn-thetic peptide from HIV-1 gp41 is a potent inhibitor of virus-mediated cell-cell fusion. AIDS Res Hum Retroviruses 1993;9:1051-3.
11.Kilby JM, Hopkins S, Venetta TM, et al. Potent suppression of HIV-1 replication in humans by T-20, a peptide inhibitor of gp41-mediated virus entry. Nat Med 1998;4:1302-7.
12.Kilby JM, Lalezari JP, Eron JJ, et al. The safety, plasma pharmacokinetics, and anti-viral activity of subcutaneous enfuvirtide (T-20), a peptide inhibitor of gp41-medi-ated virus fusion, in HIV-infected adults. AIDS Res Hum Retroviruses 2002;18:685-93. [Erratum, AIDS Res Hum Retroviruses 2003;19:83.]
al. A controlled phase II trial assessing three doses of enfuvirtide (T-20) in combination with abacavir, amprenavir, ritonavir, and efavirenz in non-nucleoside reverse trans-criptase inhibitor-naive HIV-infected adults. Antiviral Ther (in press).
14.Lalezari JP, Eron JJ, Carlson M, et al. A phase II clinical study of the long-term safety and antiviral activity of enfuvirtide-based antiretroviral therapy. AIDS 2003;17: 691-8.
15.Lazzarin A, Clotet B, Cooper D, et al.
Efficacy of enfuvirtide in patients infected with drug-resistant HIV-1 in Europe and Australia. N Engl J Med 2003;348:2186-95.
16.DeGruttola V, Dix L, D’Aquila R, et al. The relation between baseline HIV drug resistance and response to antiretroviral ther-apy: re-analysis of retrospective and prospec-tive studies using a standardized data analy-sis plan. Antivir Ther 2000;5:41-8.
17.AIDS Clinical Trials Group. Table of grading severity of adult adverse experiences. Rockville, Md.: Division of AIDS, National
Institute of Allergy and Infectious Diseases, 1996.
18.Little R, Yau L. Intent-to-treat analysis for longitudinal studies with drop-outs. Bio-metrics 1996;52:1324-33.
19.Le Corfec E, Chevret S, Costagliola D. Visit-driven endpoints in randomized HIV/ AIDS clinical trials: impact of missing data on treatment difference measured on sum-mary statistics. Stat Med 1999;18:1803-17.