MUSCLE CHARACTERISTICS AND BODY COMPOSITION OF NCAA DIVISION I FOOTBALL PLAYERS
Malia Nikole Melvin
A thesis submitted to the faculty of the University of North Carolina at Chapel Hill in partial fulfillment of the requirements for the degree of Masters of Arts in the Department
of Exercise and Sports Science (Exercise Physiology).
Chapel Hill 2014
Approved by: Abbie Smith-Ryan
Eric Ryan
ABSTRACT
Malia Nikole Melvin: Muscle Characteristics and body composition of NCAA Division I football players.
(Under the direction of Abbie E. Smith-Ryan)
The purpose of this study was to investigate muscle cross sectional area (mCSA)
and echo intensity (EI) of the vastus lateralis (VL) and body composition of Division I
football players. Sixty-nine players were stratified by position, race, year, and starter
status. Muscle CSA and EI were determined from a B-mode ultrasound panoramic scan
of the VL using Image-J software. Fat mass (FM), lean mass (LM), and body fat (%fat)
were determined using dual-energy x-ray absorptiometry. Measures of mCSA (38.7±6.6
cm2, %fat (17.9±4.6 %), LM (81.3±11.8 kg), and FM (19.5±8.7 kg) were found to be
significantly different across position (p<0.05), likely due to the differences in
position-specific tasks. Offensive and defensive linemen were not significantly different (p>0.05),
and had the greatest mCSA (44.4 cm2), %fat (23.4%), LM (96.4 kg) and FM (30.9 kg)
values in comparison to all other positions. No differences (p=0.161) were observed
AKNOWLEDGEMENTS
I would genuinely like to thank everyone who has helped to make this thesis
project a success. I would like to thank my advisor, Dr. Abbie Smith-Ryan, for your
continued guidance, patience and support throughout my thesis process. I would also like
to thank my committee members, Dr. Eric Ryan and Mr. Eric Sobolewski for taking the
time to review my document and offering advice, which has improved the quality of my
TABLE OF CONTENTS
LIST OF TABLES ... vii
LIST OF FIGURES ... viii
CHAPTER 1: INTRODUCTION ... 1
Purpose ... 5
Research Questions ... 5
Research Hypotheses ... 6
Assumptions ... 6
Theoretical ... 6
Statistical ... 6
Delimitations ... 6
Limitations ... 7
Significance of Study ... 7
Definitions ... 7
CHAPTER 2: LITERATURE REVIEW ... 9
Introduction ... 9
Muscle Quality ... 11
Dual-Energy X-Ray Absorptiometry ... 14
Body Composition of American Football Players ... 17
CHAPTER 3: METHODS ... 21
Subjects ... 21
Research Design ... 21
Procedures ... 22
Dual-Energy X-ray Absorptiometry ... 22
Ultrasound ... 23
Statistical Analysis ... 23
CHAPTER 4: MANUSCRIPT... 25
Introduction ... 25
Methods ... 28
Statistical Analysis ... 31
Results... 31
Discussion... 32
CHAPTER 5: CONCLUSION... 39
LIST OF TABLES
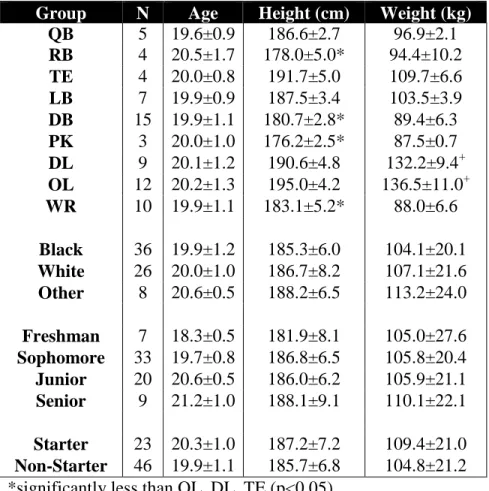
Table 1. Mean ± SD of sample characteristics for position, race, year classification, and starter status subgroups...………...……41
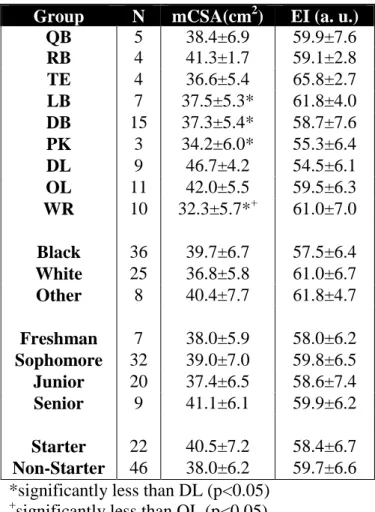
Table 2. Mean ± SD of ultrasound characteristics for position, race, year classification, and starter status subgroups...42
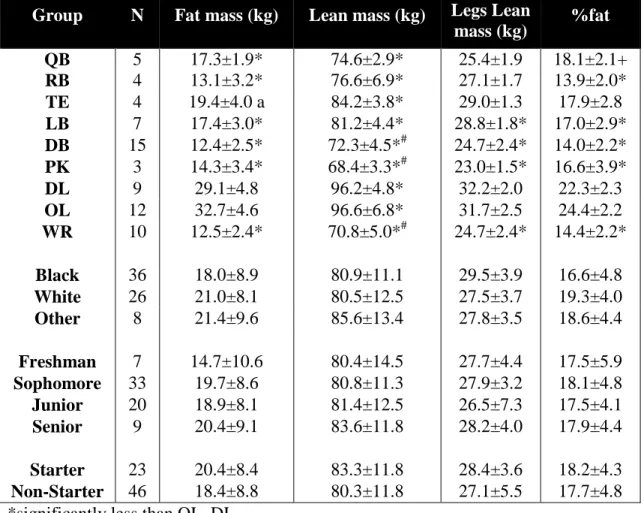
Table 3. Mean ± SD of DXA body composition characteristics for position, race, year classification, and starter status subgroups...………...……43
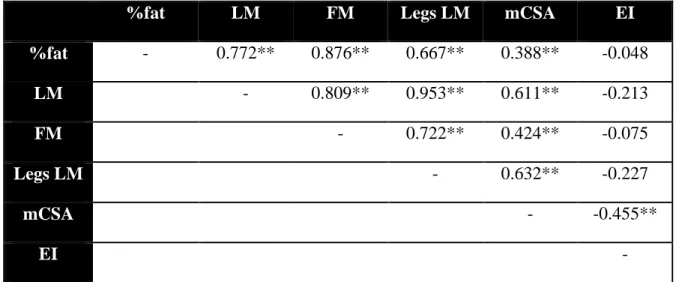
Table 4. Correlations between US and DXA measures percent body fat (%fat), lean mass (LM), fat mass (FM), muscle cross sectional area (mCSA),
LIST OF FIGURES
Figure 1. Individual comparisons of height (cm) and weight (kg) stratified
by player position.…...………...…………45
Figure 2. Individual echo intensity (a.u.) values stratified by race...…………46
Figure 3. Individual comparisons of lean mass (kg) and fat mass (kg) stratified
by player position...………...…………47
CHAPTER 1 INTRODUCTION
The progression of American football, since the 1970s, has been accompanied by
a significant increase in player physical size (Kraemer et al., 2005; Noel et al., 2003;
Secora et al., 2004; Snow, Miller-Stafford, & Rosskopf, 1998). Recent data suggests that
players are increasing in weight and speed with a subsequent increase in strength
(Robbins et al., 2012). In a study of 37 universities with Division I football teams, Secora
et al. (2004) determined that five of the eight player positions increased body weight
from 1987 to 2000 (Secora et al., 2004). The study also found that the offensive linemen
increased percent body fat (%fat) significantly, which concurs with most previous studies
(Kraemer et al., 2005; Noel et al., 2003; Secora et al., 2004; Snow et al., 1998). Each
player position is unique in physical expectations and performance duties; therefore, the
body composition of each player on a team may be drastically different depending on
position (Kraemer et al., 2005; Mathews & Wagner, 2008).
An increase in size and body fat of college football players raises concern for
future health or performance complications (Albuquerque et al., 2010; Miller et al., 2008;
Miller et al., 2002). The World Health Organization reports that overweight and obese
individuals are at greater risk of cardiovascular disease, diabetes, and musculoskeletal
disorders (World Health Organization, 2013). A study of 261 National Collegiate
%fat, maximal power clean weight, and vertical jump. Specifically in the offensive and
defensive linemen, the 40-yard and 20-yard sprint times were significantly decreased, as
%fat increased (Miller et al., 2002). Therefore, assessing a football athletes’ body
composition may be beneficial for understanding future health or performance
implications.
In addition to the traditional body composition measurements, evaluating %fat,
fat mass (FM) and lean mass (LM), muscle quality measurements may also be
advantageous. Muscle quality measurements allow for an enhanced analysis of the
muscle tissue by assessing the amount of contractile versus non-contractile tissue within
the muscle (Fukumoto et al., 2011). An increase in adipose and connective tissue within
the muscle will decrease muscle quality (Cadore et al., 2012; Fukumoto et al., 2011).
Goodpaster et al. (2000) determined that intramuscular fat increases with corresponding
increases in body fat. Increases in intramuscular adipose and connective tissue may also
be related to the development of insulin insensitivity (Goodpaster, 2001). Therefore, as
the trend of increasing physical size continues in American football players, it may be
important to have a more comprehensive understanding of body composition and muscle
quality.
Previous studies have measured football players’ % fat using numerous
two-compartment model techniques (Kraemer et al., 2005; Noel et al., 2003; Secora et al.,
2004; Snow et al., 1998). A study investigating percent body fat of 36 NFL players using
hydrostatic weighing (HW), and 7-site skinfold measures determined that over the course
of 20 years, offensive linemen and tight ends had the greatest increase in weight and
composition of 53 NFL players using air displacement plethysmography (ADP) via the
BodPod, and found that offensive and defensive linemen have increased body mass most
significantly since the 1970s, and that all players were classified as overweight or obese
according to body mass index kg/m2 (BMI) (Kraemer et al., 2005). In 2003, an additional
study measured 69 Division I football players using HW and skinfolds, and determined a
significant increase in body mass, most notably in offensive and defensive linemen. The
increase in body mass was not accompanied by an increase in FFM, which indicates the
increased body mass was due to an increase in %fat (Noel et al., 2003). Mathews et al.
(2008) also determined BMI misclassified 55% of NCAA Division I football players as
overweight or obese, in comparison to % fat from bioelectrical impedance analysis.
Although the various two-compartment methods have been validated by criterion
methods, such as hydrostatic weighing, methods for the accurate determination of body
composition in an athletic population can be improved upon (Prior et al., 1997). In a
racially heterogeneous sample, like a Division I football team, a two-compartment model
may not be appropriate. Studies have shown that ADP underestimates %fat in White
males, and overestimates %fat in a Black population (Sardinha et al., 1998; Wagner et al.
2000). Two-compartment models account for two components of the body, fat mass and
fat free mass; density, composition and hydration of fat free mass are assumed constant.
Deviations from the assumed values will result in increased systematic error (Prior et al.,
1997). Therefore, due to the various body types in an athletic population, measurements
of additional compartments have shown to improve the accuracy of body composition
measurements (Prior et al., 1997). Multi-compartment methods reduce the standard error
mineral content and soft mineral content (Z. M. Wang et al., 1998). Dual-energy x-ray
absorptiometry is considered a three-compartment model for assessing body composition
by quantifying bone mineral content, fat mass, and lean mass. Dual-energy x-ray
absorptiometry (DXA) uses low dose radiation and two energy photon beams to assess
bone mineral content and soft tissue composition (Nieman, 2010). This
multi-compartment model is highly correlated to a six-multi-compartment model criterion (Z. M.
Wang et al., 1998), and has been shown to be reliable and valid for assessing lean mass
for both men and women (Van Loan & Mayclin, 1992). Therefore, a multi-compartment
model should be used to evaluate NCAA Division I football players in order to obtain a
more accurate representation of the athletes’ current body composition and health status.
As previously mentioned, measures of muscle characteristics may also provide
additional information regarding an athlete’s health and performance. Muscle
characteristics such as muscle cross sectional area (mCSA) and echo intensity (EI) aid in
quantifying muscle quality, which estimates the amount of contractile versus
non-contractile tissue within the muscle. Echo intensity represents the amount of adipose and
connective tissue infiltration within the muscle as measured by a non-invasive grayscale
analysis of an ultrasound image. Echo intensity has previously been shown to be related
to strength, power, and cardiovascular function (Cadore et al., 2012; Fukumoto et al.,
2011). High ultrasound EI measures have been suggested to be related to sarcopenia and
sarcopenic obesity (Fukumoto et al., 2011), while increases in intramuscular adipose and
connective tissue have also been shown to be influenced by race (Miljkovic et al., 2009).
provide insight into whether player position or racial group with higher percent body fat
are more at risk for health or performance consequences.
Purpose
1. The purpose of this study was to examine the relationship between muscle
characteristics, as measured by muscle cross sectional area and echo intensity of the
vastus lateralis, and body composition of NCAA Division I football players.
2. The secondary purpose of this study was to determine if significant differences exist in
muscle characteristics of the vastus lateralis and body composition between the following
player positions: quarterbacks, running backs, wide receivers, offensive linemen, tight
ends, defensive linemen, linebackers, defensive backs, and kickers/punters.
3. Exploratory analyses were performed to determine if significant differences exist in
muscle characteristics of the vastus lateralis and body composition between athletes of
different races, year classification, and starter status.
Research Questions
RQ1: Do muscle cross sectional area and echo intensity of the vastus lateralis relate to
body composition measurements: percent body fat, fat mass, and lean mass in NCAA
Division I football players?
RQ2: Will vastus lateralis muscle characteristics as measured by mCSA and EI differ
between player positions in a NCAA Division I football team?
RQ3: Will vastus lateralis muscle characteristics as measured by mCSA and EI differ
Research Hypotheses
H1: Muscle cross sectional area of the vastus lateralis will be negatively correlated to
percent body fat and fat mass and positively correlated to lean mass; echo intensity of the
vastus lateralis will be positively correlated to percent fat and fat mass and negatively
correlated to lean mass.
H2: Vastus lateralis muscle characteristics as measured by mCSA and EI will
significantly differ between player positions in a NCAA Division I football team.
H3: Vastus lateralis muscle characteristics as measured by mCSA and EI will significantly
differ between races, year classification and starter status.
Assumptions
Theoretical
• All subjects will be two-hours fasted.
• Muscle quality was accurately measured using echo intensity determined from an
ultrasound scan.
Statistical
• Population from which sample was drawn is normally distributed.
• There was a linear relationship between the independent and dependent variables.
Delimitations
• This study only included NCAA Division I football players.
• Athletes arrived 2-hours fasted.
• Subjects were excluded if they had suffered an injury, which prevented team
Limitations
• Results may not be generalizable to all athletes as only NCAA Division I football
players were measured.
• This study had a small sample size, specifically within each player position.
Significance of Study
This study aimed to determine a relationship between body composition and
muscle quality in NCAA Division I football players. This relationship may allow for the
determination of whether muscle quality can be used predict %fat, FM or LM in a group
of athletes. Also, an analysis of each player position may help evaluate if any position has
decreased muscle quality and an increased risk of health. Exploratory analyses of the
athletes’ race may also provide beneficial information to determine whether any
particular racial group has a decreased muscle quality, which may pre-dispose those
individuals to various health risks including metabolic syndrome and obesity-related
diseases. This study may prompt the education of Division I athletes about the potential
risk of high percent body fat and decreased muscle quality on future health and
performance.
Definitions
Muscle quality: a measure of the amount of contractile versus non-contractile tissue within the muscle (Fukumoto et al., 2012).
Echo intensity: a non-invasive grayscale analysis of ultrasound measures as expressed in values between 0 and 255 a.u. to estimate the amount of intramuscular adipose and
Ultrasound (US): a technique used to measure body composition by using a transducer probe to emit, through the skin, an ultrasonic wave, which part is reflected at the fat
muscle interface (Pineau, Guihard-Costa, & Bocquet, 2007).
Dual-Energy X-Ray Absorptiometry (DEXA): a three-component model for estimating body composition that uses low dose radiation to measure bone mineral content, fat mass
and lean mass (Nieman, 2010).
Fat mass: all extractable lipids from adipose and other tissues in the body (Heyward, 2001).
Lean mass: non-bone fat free mass, which includes fat free tissues such as water, muscle, connective tissue, and internal organs (Nieman, 2010).
Percent body fat: fat mass expressed as a percentage of total body weight (Heyward, 2001).
Race: an individual’s self-identified racial and national origin or sociocultural groups (“About Race,” 2012).
White: a person having origins in any of the original peoples of Europe, the Middle East, or North Africa (“About Race,” 2012).
CHAPTER 2 LITERATURE REVIEW
Introduction
Body composition has been shown to significantly influence both exercise
performance and health in an array of athletes (Albuquerque et al., 2010; T. a Miller et
al., 2002; World Health Organization, 2013). Measurement of body composition attempts
to quantify compartments of body mass. Two-compartment models, dividing the body
into fat mass (FM) and fat free mass (FFM), are the most common form of measurement
used in athletes (Kraemer et al., 2005; Noel et al., 2003; Secora et al., 2004; Snow et al.
1998). However, as body composition analyses have evolved, multi-compartment models
have become increasingly popular to obtain a more accurate estimation of body
composition (Prior et al., 1997; Wang et al., 2010; Wang et al., 1998).
Measurement of muscle density, as determined by the comparison of the amount
of contractile and non-contractile tissue within the muscle, termed muscle quality, has
gained interest as a further analysis of muscle tissue. Muscle quality can be assessed by a
variety of methods including muscle biopsies (Goodpaster et al, 2001), magnetic
resonance imaging (Tracy et al., 1999), computed tomography scan (CT) (Frontera et al.,
2000), and ultrasound (Cadore et al., 2012; Fukumoto et al., 2011). In recent literature,
the ultrasound has become a common method for analyzing muscle quality by
determining the muscles’ echo intensity (EI) and muscle cross sectional area (mCSA)
estimation of intramuscular adipose and connective tissue, which is measured using a
brightness scale of the ultrasound image. Echo intensity measures indicate overall muscle
quality by representing the loss in contractile tissue within the muscle as adipose and
connective tissue infiltrate the muscle due to aging (Fukumoto et al., 2011) or obesity
(Nijboer-Oosterveld et al., 2011).
Current literature has primarily focused on the relationship of muscle quality and
aging, sedentary, and recreationally active adults (Cadore et al., 2012; Fukumoto et al.,
2011; Sipila & Suominen, 1991). Studies have also evaluated differences in muscle
quality between young and old (Arts et al., 2010), obese and normal weight adults
(Nijboer-Oosterveld et. al, 2011), and between races (Miljkovic et al., 2009). However, research investigating muscle quality measures in highly trained individuals is limited,
which promotes future research in this population. In obese individuals, an increase in
subcutaneous fat mass has been found to be accompanied by a decrease in muscle quality
(Goodpaster et al., 2000; Nijboer-Oosterveld et al., 2011) Therefore, athletes with a high
percent body fat may demonstrate decreased performance, as a result of a lower muscle
quality, although this has not yet been evaluated.
The relationship between muscle quality and body composition has not been
given much attention in current literature, but may warrant further investigation due to
the potential impact on health and exercise performance. American football players in
particular may benefit from a better understanding of muscle quality. Football athletes
have a wide variety of body compositions across skill position (Kraemer et al., 2005;
Noel et al., 2003). The skill positions are generally stratified by the following:
defensive back, linebacker, and defensive linemen. Five of the eight of the skill positions
have seen an increase in body mass and size as football has evolved from the 1980s to the
present (Secora et al., 2004). However, the offensive and defensive linemen in particular
are the most at risk for increases in percent body fat (Kraemer et al., 2005, Secora et al.,
24). This increase in percent body fat, compared to the other football player positions,
have been associated with health complications such as obesity, hypertension, sleep
disordered breathing, and metabolic syndrome (Albuquerque et al., 2010). Understanding
the relationship between muscle quality and body composition in each football player
position may provide a better representation of their health risk level due to excess
subcutaneous fat and intramuscular non-contractile tissue. This may help these athletes
transition from playing into retirement. This literature review will discuss the current
relevant research regarding muscle quality, dual-energy x-ray absorptiometry a
three-compartment model of body composition, and body composition of American football
athletes.
Muscle Quality
Muscle quality encompasses physiological factors such as the amount of
contractile and non-contractile tissue within the muscle and muscle thickness, which
influence muscle strength, power and functional capacity (Cadore et al., 2012). Muscle
quality can be determined by ultrasound measures of mCSA and EI. Echo intensity has
been reported to be a valid non-invasive measure of muscle quality, and has previously
been shown to be related to strength, power, and cardiovascular function (Cadore et al.,
2012; Fukumoto et al., 2011). Previous data has demonstrated increased intramuscular
measurement (Arts et al., 2010). Therefore, as skeletal muscle fat infiltration increases in
elderly and obese individuals, an increased intramuscular fat and EI is anticipated
(Miljkovic & Zmuda, 2010). Increased fat accumulation in the muscle may represent
metabolic changes in lipid metabolism including reduced fat oxidation and low basal
ATP concentration (Miljkovic & Zmuda, 2010). Reduced fat utilization will increase
excess availability of fat or increase the uptake of lipid into the muscle (Roden, 2005).
The increase in intramuscular fat has been shown to be related to insulin insensitivity and
the development of metabolic syndrome (Goodpaster et al., 2001). The increase in
intramuscular adipose tissue may also represent a decrease in exercise performance
(Achten & Jeukendrup, 2004). It is commonly reported that regular aerobic exercise in
healthy (Friedlander et al., 1998 & 1999) and obese (Van Aggel-Leijssen et al., 2002)
individuals increases fat oxidation and is related to endurance capacity and exercise
performance (Hawley, Brouns, & Jeukendrup, 1998).
Acute and chronic training has been shown to improve muscle quality and
function in elderly individuals (Sipila & Suominen, 1991 & 1993; Tracy et al., 1999).
Elderly individuals who are chronically trained, yield higher muscle quality values as a
result of reduced connective tissue and less intramuscular fat tissue (Sipila & Suominen,
1991). Trained individuals also have been shown to have denser quadriceps muscle
tissue, less total area of fat, and a decreased relative proportion of fat in the quadriceps
muscle (Sipilä & Suominen, 1993).
Resistance training is particularly important as studies have shown muscle
strength to be negatively correlated to EI and positive correlated to muscle thickness
determined that there is a larger loss of muscle contractile tissue with age, compared to
muscle size in the quadriceps. In addition, the study observed that high percent body fat
measured in aging adults resulted in sarcopenic obesity, which may be associated with
increase intramuscular adipose tissue (Fukumoto et al., 2011). In addition to muscle
strength, Cadore et al. (2012) evaluated the relationship between EI and cardiorespiratory
fitness. The study determined that there are negative associations between rectus femoris
EI and workloads at ventilatory threshold, which suggests connective and adipose tissue
infiltration into the muscle may decrease cardiorespiratory capacity. The study
hypothesized that as intramuscular adipose and connective tissue increases, it decreases
the number of capillaries, which will disrupt the blood supply of the muscle fibers.
Therefore, a lower muscle quality may influence aerobic capacity and could be of
importance to an athlete of any age.
Trained, younger populations should have a high muscle quality compared to
elderly (Arts et al., 2010). However, obesity may have the potential to alter the
relationship between age and EI. Studies have suggested that increased percent body fat
may be related to a decline in muscle quality (Goodpaster et. al, 2001l; Nijboer-Oosterveld et al., 2011). Nijboer-Oosterveld et al. (2011) observed the relationship of muscle quality and obesity in 54 healthy subjects (Sex: 27 males, 27 female; Age range:
21-86), and found that in the rectus abdominis, rectus femoris, and gastrocnemius, EI
increased as subcutaneous fat thickness increased. The subjects of greater weight showed
increased intramuscular fat. A study in aging adults observed that high percent body fat
can result in sarcopenic obesity, which is may be associated with increase intramuscular
The relationship of muscle quality and body composition may be of importance to
overweight and obese populations, who are more at risk for development of metabolic
syndrome. A study by Goodpaster et al. (2001) performed muscle biopsies in the vastus
lateralis of sedentary obese subjects with Type II diabetes, and determined excess
accumulation of intramuscular fat was negatively correlated to insulin sensitivity
potentially leading to development of Type II diabetes. Another study evaluated the
relationship of muscle quality and Type II diabetes using ultrasonography in older
Caucasian (mean %fat = 27.2) and Afro-Caribbean (mean %fat = 22.2) men (Miljkovic et
al., 2009). The study concluded that men of African ancestry had significantly greater
intramuscular fat than men of Caucasian ancestry, and were at greater risk for
development of Type II diabetes. However, body composition measured by DXA found
that men of African ancestry had a significantly lower percent body fat than the
Caucasian men. This suggests that racial differences may have a greater influence on
muscle quality than body composition. The previous studies indicate that future research
should investigate the use of ultrasonography in addition to body composition measures
as a quick estimation of intramuscular fat as a pre-diagnosis of insulin resistance and type
II diabetes (Goodpaster et al., 2001, Nijboer-Oosterveld et al., 2011).
In the current study, as all individuals will be men and highly trained, it will help
determined the influence that body composition by player position and race have on an
individual’s muscle quality.
Dual-Energy X-Ray Absorptiometry
Body composition and body mass index (BMI) analyses are commonly used to
Hecht, 2005; Lenz, Richter, & Mühlhauser, 2009). Body composition has also been
shown to be a significant predictor of power athletic performance, including vertical
jump, maximal power clean weight, and 20 yd. and 40 yd. sprints (Miller et al., 2002).
Due to the limitations of BMI, which does not account for differences in tissue type
within the body, and the increased lean body mass of strength-trained athletes, it is not an
effective method to assess risk factors for obesity-related health concerns (Hyman, Dang,
& Liu, 2012; Kraemer et al., 2005). Multi-compartment models are considered the
criterion method for analysis of body composition, and are used to assess the validity of
two-compartment reference body composition methods (Bosy-Westphal et al., 2008;
Pateyjohns et al., 2006; Sardinha et al., 1998; Wagner et al., 2000). Multi-compartment
models divide the body into its multiple constituents such as fat mass, fat free mass, total
body water, bone mineral content, and soft tissue mineral content. Models such as the Siri
three-compartment model (Siri, 1961) or the Selinger four-compartment model (Selinger,
1977) require a combination of reference methods including air displacement
plethysmography, bioelectrical impedance, and dual–energy x-ray absorptiometry
(DXA). However, the DXA divides the body into three-compartments, fat mass, lean
mass, and bone mineral content, while assuming constant hydration in the fat free soft
tissue (Wang et al., 1998). Therefore, the DXA requires only one, simple reference
method to obtain a more accurate multi-compartment body composition analysis.
Dual-energy x-ray absorptiometry uses a stable x-ray generator and two energy
photon beams to assess bone mineral content and soft tissue composition by differences
of attenuation of the two energy beams (Neiman, 2011). This model divides the body into
compared various multi-compartment models to a six-compartment (6-C) criterion in 23
healthy individuals (Sex: 17 males, 6 females; Race: 12 White, 3 African American, 9
Puerto Rican). The study determined that the DXA model was highly correlated
(r2=0.972) to the 6-C model for measuring percent body fat, and is therefore, an
acceptable and valid method for percent body fat estimations. Additional body
composition studies have determined the DXA provides valid measures of percent body
fat, as measurements were highly correlated to three-compartment (Norcross & Van
Loan, 2004), four-compartment (Prior et al., 1997), and five-compartment (Wang et al.,
2010) models.
Specifically, Prior et al. (1997) investigated body composition assessed by DXA
in 172 healthy men and women. The sample included 111 collegiate athletes (Sex: 67
males, 44 females; Race: 39 African American, 72 White) and 61 non-athletes (Sex: 24
males, 37 females; Race: 23 African American, 83 White). Collegiate sports represented
included football, basketball, volleyball, gymnastics, swimming and track and field. The
results determined that there was no significant difference between DXA percent body fat
and the four-compartment model percent body fat estimation, and standard error of the
estimate for DXA was < 3% indicating it is an accurate and valid method for measuring
percent body fat in a heterogeneous sample.
The determined validity of the DXA for assessing body composition has led
multiple studies to use DXA as the criterion method for cross validation studies
(Bosy-Westphal et al., 2008; Pateyjohns et al., 2006; Sardinha et al., 1998; Wagner et al., 2000).
A study by Sardinha et al. (1998) determined percent fat in 62 white men, was
compared to DXA. However, Wagner et al (2000), found that in a sample of black
individuals, percent fat measured by ADP was significantly overestimated in comparison
to DXA. Therefore, the lack of ability of ADP to detect racial differences is a limitation
in assessing percent body fat measures in a racially heterogeneous sample, such as a
college football team.
Further studies investigating the validity of bioelectrical impedance body
composition measurements in overweight and obese populations found that BIS has
acceptable agreement with a DXA criterion (Bosy-Westphal et al., 2008; Pateyjohns et
al., 2006). However, a study determined that in 43 overweight and obese men (BMI
range: 28-43 kg/m2), bioelectrical impedance was only moderately correlated to percent
body fat measures in comparison to DXA (r2 = 0.69) (Pateyjohns et al., 2006). In order to
evaluate football athletes body composition, a more comprehensive approach to body
composition is recommended as prediction errors for skinfolds, bioelectrical impedance
and near-infrared spectrophotometry are much greater when compared to DXA (Collins
et al., 1999).
Body Composition of American Football Players
Body composition of American football players is diverse, as a primary result of
position specific performance demands (Kraemer et al., 2005). The body composition
characteristics of football players have gained increasing attention due to growing
increase in player size and concomitant increase in associated health risks. A study of 36
NFL players, which compared results to a previous study using similar body composition
techniques, demonstrated that there was a significant 9% increase in percent body fat
al., 1998). A study of 37 universities with Division I football programs found that players
have continued to increase size from 1990 into the 2000s (Secora et al., 2004). Noel et al.
(2003) performed hydrostatic weighing and 7-site skinfold analyses on 69 Division I
football players. Percent body fat ranged from 15.2 – 27.4 % with defensive backs, wide
receivers and running backs reporting the lowest percent body fat and offensive and
defensive linemen and tight ends reporting the highest. Kraemer et al. (2005) performed
air displacement plethysmography analyses on 53 NFL players and saw a similar trend of
percent body fat and player position. The team percent body fat ranged from 6.3 – 25.1%,
and again the defensive backs, wide receivers, and running backs had the lowest percent
body fat and the offensive linemen had the highest followed by the defensive linemen.
Noel et al. (2003) found that when considering fat mass, fat free mass and total body
mass, the offensive and defensive linemen have significantly increased in body mass, but
not in fat free mass.
Offensive and defensive lineman commonly have the highest percent body fat of
the player positions (Kraemer et al., 2005; Noel et al., 2003), and therefore are at the
highest risk for development of obesity-related health complications. Retired NFL
players, especially offensive and defensive linemen are at greater risk for becoming obese
and developing metabolic syndrome, cardiovascular disease, arthritis, and sleep
disordered breathing (Albuquerque et al., 2010; Miller et al., 2008). The previous studies
demonstrate there is a reason for concern in the player positions with high percent body
Significance of Study
The current study aimed to evaluate the relationship between muscle quality and
body composition in Division I football players. The study also investigated whether
player position or race influence muscle quality and body composition. Muscle quality
measures performed using ultrasonography have primarily focused on elderly
populations, and body composition values were not evaluated. Therefore, the study
results may establish whether the trend in increasing size of football players, especially
the offensive and defensive linemen is accompanied by an increase in decreased muscle
quality. The comparisons may help to investigate whether a measure of muscle quality in
this population can predict skill position or racial subgroups that are at a heightened risk
for developing obesity-related health complications such as metabolic syndrome,
hypertension and cardiovascular disease. The knowledge acquired may help individuals
that are at risk to have a better understanding of their muscle quality due to their percent
body fat levels, which may hinder performance, or lead to a more difficult transition into
retirement. The ultrasound and echo intensity measurements could therefore be used as a
quick and easy measurement to perform in addition to composition measurements to help
predict health outcomes in an athletic population.
The results of this study may be of particular importance to future research of
retired athletes. Athletes transitioning into retirement may see greater problems
depending on player position. Miller et al. (2008) observed in retired NFL players that
offensive and defensive linemen have a much higher prevalence of obesity and metabolic
syndrome than the other playing positions. However, all of the football players had an
general population as determined by the National Health and Nutrition Examination
Survey. Increased percent body fat and decreased muscle quality have both been seen to
be related to the development of metabolic syndrome, and therefore, it is important to
have a clear understanding of body composition and muscle quality in this specific
CHAPTER 3 METHODS
Subjects
One Hundred and eleven college aged males who were currently participating in
NCAA Division I football at the University of North Carolina at Chapel Hill were asked
to participate in this study. Of the 111, 73 volunteered to participate in the study, and 69
players were used for analysis; n=4 were not included due to injury preventing training.
Players were stratified by position, which include: quarterbacks (QB), running backs
(RB), wide receivers (WR), offensive linemen (OL), tight ends (TE), defensive linemen
(DL), linebackers (LB), defensive backs (DB), and kickers/punters (KP). A subsequent
stratification by race: black (B), white (W) and other (O; Biracial, Latino, Asian,
American Indian); year classification: freshman (Fr), sophomore (So), junior (Jr), and
senior (Sr); and by starting status: starter (S) and nonstarter (NS) was performed. Subjects
were recruited by verbal recruitment by the investigators during their routine body
composition testing. Upon arrival to the Laboratory, all subjects signed the informed
consent form approved by the University’s Institutional Review Board.
Research Design
Subjects were asked to report to the laboratory for a 30-minute body composition
testing session. Each subject arrived to the laboratory 2-hours fasted. Height was
measured using a portable stadiometer (Perspective Enterprises, Portage, MI, USA) and
composition was assessed using dual-energy x-ray absorptiometry. Image-J software was
used to quantify echo intensity (EI) and muscle cross sectional area (mCSA) of the vastus
lateralis (VL) which were determined from a panoramic scan of the vastus lateralis (VL)
using a GE Logiq-e B-mode ultrasound (US).
Procedures
Dual-Energy X-ray Absorptiometry
Whole body composition was assessed using a Hologic Dual-Energy X-ray
Absorptiometer (DXA, Hologic Discovery W, Bedford, MA) using the device’s default
software (Apex Software Version 3.3). The DXA uses two, beam energies which
produce varying degrees of attenuation as they pass through different masses and types of
tissue, and therefore, can determine fat mass, lean mass, bone mineral content, and
percent body fat. The device was calibrated according to manufacturer’s instructions
before testing to ensure valid results. A trained technician performed all scans. The
subject were asked to remove all metal, thick clothing, and heavy plastic, which could
interfere with the DXA scan. Each subject’s identification number, age, ethnicity, height
and weight were entered into the DXA software prior to scanning. Subjects were then
asked to lay supine in the middle of the scanning platform with hands pronated and arms
and legs to the side not touching any other part of their body. However, when necessary a
subject’s thumbs were placed under the buttocks in order to stay within the platform’s
width restriction. Subjects were instructed to remain still and breathe normally for the
duration of the scan. The scans were automatically analyzed by the software, but specific
Ultrasound
Muscle cross sectional area of the vastus lateralis (VL) was determined using a
GE Logiq-e B-mode ultrasound (GE Healthcare, Wisconsin, USA) from a panoramic
scan of the thigh. The wide-band linear array ultrasound transducer probe (GE: 12L-RS)
was held perpendicular to the tissue and swept across the skin at equal pressure from the
lateral VL border to medial fascia separation. The same technician performed each scan
while the subjects laid supine with the right leg extended and relaxed on the examination
table. Echo intensity was also determined from the panoramic scan of the VL by
grayscale analysis using Image-J software (National Institute of Health, USA, Version
1.37). As previously described by Cadore et al. (2012), the same technician traced the
outline of the VL for each subjects’ scan along the fascia border as close as possible to
capture only the muscle.
Statistical Analysis
All statistical analysis were performed using SPSS Version 20 Statistical Analysis
Software (IBM, Somers, NY, USA). Descriptive statistics (mean± standard deviation)
including, height, weight, percent body fat (%fat), echo intensity (EI), muscle cross
sectional area (mCSA), fat mass (FM), and lean mass (LM) were performed for all
subjects. In addition, a one-way analysis of variance was performed to evaluate position
and racial comparisons of %fat, EI, mCSA, FM, LM. For position comparisons the
sample included quarterbacks, running backs, wide receivers, offensive linemen, tight
ends, defensive linemen, linebackers, defensive backs, and kickers/punters. For racial
comparisons the sample included white, black and other; for year classification the
included starter and non-starter. If differences were observed a Bonferroni post-hoc was
performed. Pearson’s correlation coefficients were calculated between EI, mCSA, %fat,
CHAPTER 4 MANUSCRIPT
Introduction
An American football team is composed of athletes with various physiological
characteristics, largely due to different position specific demands. Recent data evaluating
differences in football players across position, level (i.e. collegiate v. professional), and
ability (i.e. drafted v. undrafted) has expanded in an effort to better understand the
characteristics of a successful elite athlete, as well as identify potential risk for disease.
Body size and composition have been shown to be primary contributors to performance
(Miller et al., 2002). Additionally, while most football athletes have shown a trend
toward increasing body mass, there has been a concomitant increase in fat free mass
(Kraemer et al., 2005). Evaluating baseline differences across position may be useful to
reference if a player suffers an injury, gains or loses weight, or declines in performance.
Measurement of body composition and the quality of the muscle may allow for a better
identification of current and future health risks in these athletes. A focus on the collegiate
football athlete is important, as many of these players will not go on to play
professionally, and the athletes who do, have an average career length of 3.5 years
according to the National Football League Communications (“What is average NFL
Previous studies have measured percent body fat (%fat) of football athletes using
numerous two-compartment model techniques including hydrostatic weighing, 7-site
skinfolds, bioelectrical impedance and air displacement plethysmography (Kraemer et al.,
2005; Mathews & Wagner, 2008; Noel et al., 2003; Secora et al., 2004; Snow et al.
1998). While two-compartment methods are widely utilized, and validated, due to the
various body types in an athletic population, measurements of additional compartments
have shown to improve accuracy of body composition (Prior et al., 1997). Dual-energy
x-ray absorptiometry is a three-compartment model that assesses body composition by
quantifying bone mineral content, fat mass, and lean mass, and is highly correlated to a
six-compartment model criterion (Wang et al., 1998). In previous literature, offensive and
defensive linemen have commonly reported the highest %fat (Kraemer et al., 2005; Noel
et al., 2003; Snow et al., 1998), and therefore may be at a greater risk for development of
obesity-related health complications (Kopelman, 2007). Retired NFL players, especially
offensive and defensive linemen, have an increased risk for becoming obese and
developing metabolic syndrome, cardiovascular disease, arthritis, and sleep disordered
breathing (Albuquerque et al., 2010; Miller et al., 2008). A recent study of 68 NFL
retirees found metabolic syndrome was present in 50% of the individuals, highlighting
the increased risk for health complications in this population (Kelly et al., 2014). In
addition, a study of 261 NCAA football athletes reported an inverse relationship between
%fat, maximal power clean weight, and vertical jump, emphasizing the negative impact
higher body fat may have on reduced performance (Miller et al., 2002). Therefore, an
coaches, and sports nutritionists in order to prescribe successful training and nutrition
interventions to allow individuals to reach their maximal athletic potential.
In addition to the traditional body composition measurements, determining
muscle characteristics may also be advantageous. In recent literature, ultrasonography has
become a common method for analyzing muscle quality by determining muscle echo
intensity (EI) and muscle cross sectional area (mCSA) (Arts et al., 2010; Cadore et al.,
2012, Fukumoto et al., 2011). Echo intensity, which is measured using a brightness scale
of an ultrasound image, may indicate muscle quality by estimating greater intramuscular
fat and/or connective tissue due to factors such as aging (Fukumoto et al., 2011) and
obesity (Nijboer-Oosterveld et. al, 2011). Muscle quality and size have been shown to be related to muscle strength, power, and functional capacity (Cadore et al., 2012; Fukumoto
et al., 2011).
As the trend of increasing physical size continues in American football players, it
may be important to have a more comprehensive understanding of body composition and
muscle quality in these athletes. Previous research has determined differences in body
composition and muscle characteristics across football position (Kraemer et al., 2005),
year (Jacobson et al., 2013), athletic success (Miller et al., 2002), and race (Goodpaster et
al., 2001). Further investigations of an American football team will help evaluate if any
subgroup has an increased risk of performance or health complications. This may help to
develop various training and nutrition strategies during competition, as well during the
transition to retirement. Evaluating the relationship between muscle characteristics and
body composition in highly trained individuals is limited in existing current literature.
and exercise performance. Therefore, the primary purpose of the current study was to
examine the relationship between muscle characteristics of the vastus lateralis and body
composition of NCAA Division I football players. Differences in muscle characteristics
and body composition between player position, race, year, and starter status were also
evaluated.
Methods
Subjects
Seventy-three NCAA Division I football players volunteered to participate in this
study; of those, 4 were removed due to prior injury, which may have influenced muscle
quality and body composition measurements. Therefore, 69 NCAA Division I football
players (Mean ± SD; Age: 20.0 ± 1.1 yrs; Height: 186.2 ± 7.0 cm; Body mass: 106.3 ±
21.1 kg; %fat: 17.9± 4.6) were evaluated in this study. Prior to testing all subjects signed
an informed consent approved by the University’s Institutional Review Board for the
protection of human subjects. Subjects were stratified by player position: quarterbacks
(QB), running backs (RB), wide receivers (WR), offensive linemen (OL), tight ends
(TE), defensive linemen (DL), linebackers (LB), defensive backs (DB), and
kickers/punters (KP). Subjects were also stratified by race: black (B), white (W) and
other (O; Biracial, Latino, Asian, American Indian); classification: freshman (Fr),
sophomore (So), junior (Jr), and senior (Sr); and by starter status: starter (S) and
nonstarter (NS). Group descriptive characteristics are presented in Table 1 and Figure 1.
Experimental Design
The present study was completed in one 30-minute visit. Subjects arrived to the
Upon arrival, height (Perspective Enterprises, Portage, MI) and weight (Detecto, Webb
City, MO, USA) were measured, and an exercise and diet status questionnaire was given
to ensure pre-assessment guidelines were met, as well as to account for any existing
injury that might influence measurement outcomes. Muscle cross sectional area (mCSA)
of the vastus lateralis (VL) was determined from a panoramic scan of the VL using a
B-mode ultrasound. Echo intensity was determined offline using Image-J software.
Dual-energy x-ray absorptiometry (DXA) was used to determine percent body fat (%fat), fat
mass (FM), and lean mass (LM).
Ultrasound Measurements
Muscle cross sectional area and EI of the VL was determined from a panoramic
scan of the thigh using a GE Logiq-e B-mode ultrasound device (GE Healthcare,
Wisconsin, USA). The ultrasound settings (Frequency: 26 Hz, Gain: 68, Depth: 4.5 cm)
were kept constant to standardize mCSA and EI measures. In the instance that the depth
was not sufficient to show the entire fascia border, the amount of visible muscle was
analyzed to determine EI, and an additional scan was performed at a greater depth to
determine mCSA. Prior to the ultrasound measures, subjects were asked to lay supine for
3-5 minutes. During the measure, the subjects laid supine with the right leg extended and
relaxed on the examination table with a high-density foam pad strapped to the midpoint
of the thigh. To obtain the panoramic scan, a wide-band linear array ultrasound
transducer probe (GE: 12L-RS) was held perpendicular to the tissue and swept across the
skin at equal pressure from the lateral VL border to medial fascia separation. The same
technician (MNM) performed each scan. Echo intensity and mCSA were determined
Health, USA, Version 1.37). EI was determined in the standard histogram function,
which uses grayscale analysis of pixels ranging from 0 to 255. Prior to measuring mCSA
and EI, each image was calibrated by measuring the number pixels within a known
distance of 1 cm. To measure mCSA and EI, as previously described by Cadore et al.
(2012), the same technician (MNM) traced the outline of the VL for each subjects’ scan
along the fascia border as close as possible to capture only the muscle. Test-retest
reliability for EI and mCSA measurements taken from a previous study in this lab for
individuals of similar stature demonstrated an ICC of 0.74 and 0.87 and SEM of 4.58 a.u
and 2.12 cm2, respectively.
Dual-energy X-ray Absorptiometry (DXA)
Each subject completed a full body scan using the DXA (Hologic Inc., Bedford,
MA, USA; Apex Software Version 3.3) to determine lean mass (LM), fat mass (FM), and
percent body fat (%fat). Each scan was performed by a trained DXA technician (ASR).
Prior to testing, subjects were asked to remove all metal, thick clothing, and heavy plastic
to reduce interference from the scan. Birthdate, height, weight and ethnicity were entered
into the computer. Subjects were placed supine in the center of the scanning table; if the
participants’ shoulders were too wide to fit in the area of the scan, thumbs were tucked
under their buttocks to capture the full scan. Additionally, if participants’ height did not
allow their entire body to be scanned (n=8), the tips of toes were not included in the scan.
Test-retest reliability from a previous study in individuals of similar stature for %fat, has
Statistical Analysis
Separate one-way analyses of variance (ANOVAs) were used to evaluate
differences between position, race, year classification, and starter status comparisons for
muscle characteristics (EI, mCSA) and body composition (%fat, FM, and LM).
Pearson’s correlation coefficients were calculated between EI, mCSA, %fat, FM, LM and
Legs LM. All analyses were run using SPSS (Version 20, IBM, Somers, NY, USA).
Results
Ultrasound measures of mCSA and EI for each subgroup of position, race, year
classification, and starter status are presented in Table. 2. For mCSA, DL (46.7 ± 4.2
cm2) had significantly greater (p=0.000-0.037) area than WR, LB, DB, PK, and RB (32.3
± 5.7-41.3 ± 1.7 cm2) (Table 2). Muscle CSA for OL (42.0 ± 5.5 cm2) was significantly
greater (p=0.003) than WR (32.3 ± 5.7 cm2). Echo intensity values revealed no
significant differences (p=0.161) between positions (Table 2). Furthermore, there were no
significant differences (p=0.063-0.864) between race, year classification, or starter status
for CSA, and EI measures (Table 2). However, EI between black (57.5±6.4 a. u.) and
white (61.0±6.7 a. u.) approached significance (p=0.063) (Figure 2).
DXA Body Composition Characteristics
Body composition variables including %fat, LM, and FM for each subgroup are
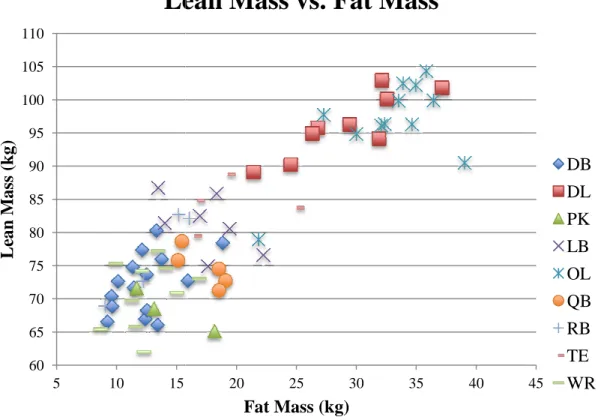
included in Table 3. For %fat, there was no significant difference (p>0.05) between OL
(22.3 ± 2.3%) and DL (24.4 ± 2.2%), but both positions were significantly greater
(p<0.001-0.021) than WR, LB, DB, PK, and RB (13.9 – 17.0%). Quarterbacks (18.1 ±
2.1%) were found to have significantly less %fat (p<0.001) than OL, but significantly
(p>0.05) between OL (96.6±6.8 kg) and DL (96.2±4.8 kg), but both positions were
significantly greater (p<0.008) than all other player positions. In addition, LB and TE
were not significantly different (p>0.05) from each other, but were significantly greater
(p<0.020) than WR, DB, and PK. For FM, similarly to %fat and LM, there was no
significant difference (p>0.05) between OL and DL, but both positions were significantly
greater (p<0.003) than QB, WR, LB, DB, PK, and RB. However, only OL were found to
be significantly greater (29.9 ± 9.4 kg; p=0.018) than TE (19.4 ± 4.0 kg). Individual
comparisons between LM and FM within each position are presented in Figure 3. It was
also determined that for combined leg lean mass (LLM), and trunk fat (TF), there were
no significant differences (p<0.05) between OL and DL, however, for LLM both
positions were significantly greater (p<0.046) than WR, LB, DB, and PK; additionally
TF, OL and DL had significantly greater LLM (p<0.003) than all other positions.
Similarly, to ultrasound measures, there were no significant differences (p=0.074-0.983)
between race, year classification, or starter status for DXA body composition variables.
However, %fat between black and white individuals approached significance (p=0.074)
(Figure 4).
Correlations Analysis
Significant positive correlations were observed between mCSA and %fat, LM,
FM, and LLM (r=0.388-0.632, p<0.01) (Table 4). Muscle CSA was significantly
negatively correlated to EI (r=-0.455, p<0.01). However, there were no significant
correlations between EI and DXA values.
Discussion
Olson et al., 2011). Health concerns have been reported to be acute and chronic
depending on the nature of the position or physical preparedness of the individual player.
A chronic health concern, particularly with lineman, is related to metabolic syndrome
(Miller et al., 2008); however there is not sufficient research to support a direct link for all football players. Body composition analyses have been determined to be an
appropriate predictor of future metabolic concerns including insulin insensitivity, Type II
diabetes, and sleep disordered breathing (Albuquerque et al., 2010). In addition to body
composition, muscle quality measures may also be possible indicators of metabolic
function and performance (Achten & Jeukendrup, 2004, Goodpaster et al., 2001, Nijboer-Oosterveld et al., 2011). There is limited research on muscle quality norms within this population, and therefore, it is not known how mCSA and EI may influence a collegiate
athlete’s performance or future health. Similarly, there is little data known about the body
composition of Division I football players due to the inconsistency of devices used within
each study. Previous research analyzing body composition of football players has
theorized that OL and DL have high %fat due to large structure and the demands of the
position. However, the device used for analysis may significantly influence the “at-risk”
categorization of lineman. The results of the current study demonstrate that OL and DL
were similar in body composition, and both were significantly greater than almost all
other positions in %fat (Mean Difference: 8.7±0.25 %), FM (MD: 17.5±1.6 kg), and LM
(MD: 21.8± 0.48 kg). According to the data in this study, which determined %fat of OL
and DL to be 24.4±2.2% and 22.3±2.3%, respectively, placing them between the 20th-25th
percentile for other men their age (Body Composition Data, 2010). In comparison, a
players to be 28.8±3.7% and 25.5±7.6%, respectively placing them between the 50th-75th
percentile. This may suggest that players in this position are susceptible to increased
health risks. However, the use of DXA as a method of analysis should be taken into
consideration, as DXA may over predict %fat measures in individuals with a large
stature, consisting primarily of LM. Furthermore, the players in the present study
demonstrated lower %BF in comparison to Dengel et al. (2013), likely as a result of
varied DXA models (Hologic vs. Lunar, respectively).
To the best of our knowledge, there has been no previous research investigating
muscle quality and mCSA of competitive football athletes. Previous studies in young and
old populations have demonstrated a wide range of mCSA and EI values. However,
direct comparison of values between studies may not be beneficial due to the variation in
US model, technique, settings, and muscles used for analyses. However, values for EI
from the current study were much lower (59.3±6.6 a.u.) than previous studies (71.6-129.9
a.u.). Due to the training demands of DI football, a lower EI value is not surprising,
thereby representing a better muscle quality. Previous studies have demonstrated an
increase in muscle size (Tracy et al., 1999), and improvement in muscle quality, as a
result of strength training (Sipila and Suominen, 1991). Sipila and Suominen (1993)
determined that 18 weeks of strength training significantly decreased EI in older women,
indicating an improvement in muscle quality. Additional studies by Fukumoto et al.
(2011) and Cadore et al. (2012) reported EI ranges of 75.3-129.9 a.u. from the quadriceps
muscle in elderly men and women using B-mode GE ultrasound devices, without
consistent depth and gain settings. A recent study by Rosenberg et al. (2013) reported EI
gain and depth settings to the current study. Measures of muscle quality may be of
importance when evaluating overweight football players, especially OL and DL.
Although these individuals had significantly greater %fat in the current study, their
muscle quality was not significantly different in comparison to other positions. This may
suggest that athletes with higher %fat may have a better muscle integrity and less
intramuscular fat and connective tissue in comparison to untrained overweight
individuals (Nijboer-Oosterveld et al., 2011).
A study investigating mCSA of the VL in untrained men reported mean values of
26.7 ± 4.5 cm2 (Ahtiainen et al., 2010). After 21 weeks of resistance training, mCSA
significantly increased to 30.5 ± 5.7 cm2. Sipila and Suominen (1993) also determined
there was a trend of increased mCSA of the quadriceps in older female athletes in
comparison to untrained older women (∆4.8 cm2). Previous mCSA values reported in
healthy untrained adults (mCSA: 19.8±1.9 cm2) (Scott et al., 2012) were considerably
lower than compared to older female resistance trained athletes (mCSA: 31.5±6.2 cm2),
(Sipila and Suominen, 1996) and the competitive football players in the current study
(38.7±6.6 cm2). Resistance and anaerobic training promotes the synthesis and growth of
contractile proteins which results in whole muscle hypertrophy, as well as hypertrophy
within the myofibers (Deschenes & Kraemer, 2002). Chronic resistance training increases
the percentage of type IIA fibers, which have been shown to experience the greatest
amount of hypertrophy in comparison to type IIB and type I fibers (Deschenes and
Kraemer, 2002). Therefore, greater mCSA is anticipated due to the high volume of
resistance training DI football players undergo. Players in the current study with
mCSA values (DL: 46.7±4.2 cm2; OL: 42.0±5.5 cm2). Interestingly, QB, RB, and TE
had comparable mCSA values (38.7±5.2 cm2), however, this was likely due to small
position specific sample size, which was a limitation of the study. Ultrasound measures
of muscle quality (MQ) and mCSA may provide beneficial information for tracking
changes that occur during season, as well as during off-season training. US measures may
have the ability to depict muscle integrity imbalances, and potentially be a useful tool for
injury prevention. The limb lean and fat mass measures provided by the DXA, in
addition to mCSA, and EI US measures, may represent a more clear analysis of how
season, training, or an injury has impacted the athlete’s muscle composition. These
non-invasive measures of MQ and size may also provide a better interpretation of health
classification for athletes with greater amounts of body fat. For example, in the current
study, although the OL and DL had BMI and %fat values that classified them ‘at risk’,
their MQ values were similar, if not better, than most other positions. Future research
expanding normative values to athletes regarding MQ comparisons may provide greater
utility for the US as a tool for health classification of athletes.
While it is apparent that size and body composition vary dramatically within and
between football players due to position specific demands, limited data exists regarding
their stature (Kraemer et al., 2005). Noel et al. (2003) determined collegiate football
players’ percent body fat values using hydrostatic weighing (HW) and skinfolds ranged
from 15.2-27.4 %. Collins et al. (1999) reported percent body fat of collegiate football
players from HW to be 10.7-23.5%. Bioelectrical impedance analysis has also been used
to determine percent fat values in this population with values ranging from 13.2-27.6%
RB tend to have the lowest percent body fat, regardless of testing method, while OL and
DL have the highest (Kraemer et al., 2005; Noel et al., 2003; Snow et al., 1988). The
percent fat values found in this study (13.9-24.4 %) were within the expected ranges in
comparison to previous research. However, each of the previously mentioned studies
used varying techniques for body composition analysis, and therefore makes individual
comparisons more difficult. Although DXA, as used in the current study, has been shown
to be highly correlated to criterion multi-compartment models (Norcross & Van Loan,
2004; Prior et al., 1997; Wang et al., 1998, 2010), depending on the manufacturer
(Hologic vs. Lunar), the DXA may slightly over predict percent body fat in an athletic
population (Moon et al., 2007; Prior et al., 1997; Wang et al., 1998). However, the ability
of the DXA to provide regional lean and fat mass may be beneficial for athletes to assess
the specific areas of the body that may be of concern. When returning to play from an
injury, the DXA and US measures may be beneficial for quantifying muscle imbalances,
particularly between each arm and leg. In addition, when prescribing weight loss or gain
interventions, quantifying regional distributions of fat, as well determining muscle
imbalances, may improve resistance exercise prescriptions. Future research investigating
the influence of a football season on regional lean mass may be valuable especially for
resistance training and conditioning prescriptions.
In addition to investigating differences between athletes by position, the current
study also stratified athletes by year, starter status, and race. Theoretically,
upperclassmen who have regularly participated in a collegiate strength training program,
and starters, should have greater lean mass than underclassmen and non-starters
(2013) determined that in 4 years, OL, DL, DB, and WR increased body mass and
strength, while OL and DL decreased %fat, and DB and WR maintained %fat values.
However, there were no significant differences found between athletes’ classified year, or
starter status, in the current study. Therefore, it may be valuable to assess longitudinal
changes that occur within each individual as they progress through their collegiate career.
Previous studies have also found significant differences in intramuscular fat and muscle
composition between black and white individuals (Ama et al., 1986; Miljkovic et al.,
2009); in contrast no significant racial differences were observed in the current study.
Similar results were reported by Abe et al. (1999) who found no muscle architectural
differences in muscle thickness, pennation angle, and fascicle length of the VL between
black and white collegiate football players. This may suggest that chronic resistance
training and conditioning may overcome racial differences of MQ in athletes, or it could
be related to the homogeneity of our population (i.e. all football). Although not
statistically significant, there may be a clinical significance of %fat measures stratified by
race (W: 19.3±4.0 %; B: 16.6±4.8 %).
The current study demonstrated a significant relationship between DXA body
composition values and mCSA, suggesting a strong link between muscle size and DXA
derived composition values. However, while a significant negative correlation between
mCSA and EI was determined, EI was not correlated to any DXA body composition
variables. This suggests that mCSA measures may be related to body composition in
CHAPTER 5 CONCLUSION
In conclusion, ultrasound measures of mCSA and DXA values of %fat, LM, FM,
LLM were significantly different across position, and therefore may provide beneficial
reference information when adapting training or nutrition regiments as a result of season,
weight goals, or injury. No significant differences across position were found for EI. This
may indicate that athletes of higher %fat, such as the DL and OL are able to maintain
muscle integrity, reducing the concern for immediate performance or health
complications that is predicted by body composition measures alone. Recognizing muscle
imbalances with US or DXA measures may also improve the quality of resistance
exercise prescription, and help determine whether an injured athlete is ready to return to
play. As US devices are readily available in most athletic facilities as a clinical tool, it
may provide other practical measures for athletes, athletic trainers, and strength coaches.
The addition of mCSA and EI, combined with body composition values may be
important for athletes considered “at risk” due to % fat values or injury status. In
addition, no significant differences were found between races, years or starter status.
Future research investigating the relationship of US and DXA measures stratified by race,
year and starter status within each position, using a larger sample of collegiate football
players, may produce significant data. Quantifying differences across race, year and
starter status may provide insight into the effectiveness of strength and conditioning
each position.
The small sample size, specifically within each player position, is a limitation of
the current study. Additional limitations of the current study included the limited fasting
time before the DXA scan (≥2 hours) and, due to time restraints, subjects only rested 3-5
minutes before the US scan to account for fluid shifts. However this data expands the
small existing body of literature that quantifies the physiological profile of NCAA
Division I football athletes. Future research, in both collegiate and professional football
athletes, is needed in order to better quantify their health, prevent injury, and