MAPPING FINANCIAL INVESTORS: AN AGGREGATED LOOK AT GLOBAL PRIVATE EQUITY
Alexander Piasecki
An honors thesis submitted to the faculty of the Kenan-Flagler Business School at the University of North Carolina at Chapel Hill
Chapel Hill 2015
Approved by .
2
ABSTRACT Alexander Piasecki
Mapping Financial Investors: An Aggregated Look at Global Private Equity (Under the direction of Dr. Ted Zoller)
The importance of my research can be summarized in a single phrase—the mapping and aggregating of global mergers and acquisitions (M&A) and private equity data to provide a comprehensive model for global business building. Amit Dixit (2001) clearly explains the need for a tool to identify and analyze global markets, “Fundamental differences in legal and education systems, and differing paces of evolution of the financial services industry, have created vastly different private equity environments worldwide. Even the most developed industrialized countries offer surprisingly variant environments for private equity firms” (p.3).
For years, literature focused on global private equity has relied heavily on macro-economic metrics. In the following pages, I examine research and studies done on the four regions I am focusing on (Asia, Europe, North America, and South America) and the variables that the literature has examined. I will then explore what other variables could be used to evaluate private equity. Finally, I provide my conclusion based on the
3
TABLE OF CONTENTS
ABSTRACT………ii
LIST OF TABLES………...viii
LIST OF FIGURES………....x
I. Introduction ... 11
Background ... 12
Hypotheses ... 13
Regional Hypothesis ... 13
Variable Hypothesis ... 14
II. Literature Review ... 15
4
Geographic Regions ... 17
Asia ... 17
Europe ... 18
North America ... 19
South America ... 20
Metrics ... 22
Calculating Return ... 22
Transaction Capitalization ... 23
Importance of my research ... 24
III. Research Methodology ... 25
Research Design ... 25
Sources of Data and Information ... 26
World Economic Forum Survey Results ... 26
Databases ... 27
5
Analysis ... 28
Graphing ... 28
Limitations ... 29
IV. Findings: Regional Case Studies ... 31
Asia ... 32
Total Tax Rate ... 32
Inflation Rate ... 33
Government Regulation on FDI ... 34
Efficiency of legal framework in settling disputes ... 35
Investor Protection ... 36
Summary ... 37
Europe ... 38
Total Tax Rate ... 38
Inflation Rate ... 40
6
Efficiency of legal framework in settling disputes ... 41
Investor Protection ... 42
Summary ... 43
North America ... 44
Total Tax Rate ... 44
Inflation Rate ... 45
Government Regulation on FDI ... 46
Efficiency of legal framework in settling disputes ... 47
Investor Protection ... 47
Summary ... 48
South America ... 49
Total Tax Rate ... 49
Inflation Rate ... 50
Government Regulation on FDI ... 51
7
Investor Protection ... 53
Summary ... 54
V. Analysis ... 55
VI. Conclusion ... 58
Implications ... 61
8 LIST OF TABLES
Table 4.1. Asia government regulation impact on FDI vs. IRR and transaction
capitalization. ………... 35 Table 4.2. Asia efficiency of legal framework in settling disputes vs. IRR and transaction capitalization.……….………35 Table 4.3. Asia investor protection vs. IRR and transaction capitalization. ……….37 Table 4.4. Variable hypotheses effect on return and transaction volume. ………38 Table 4.5. Europe government regulation impact on FDI vs. IRR and transaction
capitalization. ………42 Table 4.6. Europe efficiency of legal framework in settling disputes vs. IRR and
10
LIST OF FIGURES
Figure 2.1. Calculation of Internal Rate of Return (IRR). ………22 Figure 4.1. Asia Total Tax Rate vs. IRR and transaction Capitalization ($M). ………....33 Figure 4.2. Asia Average Inflation Rate vs. IRR and transaction capitalization ($M). ....34 Figure 4.3. Europe Total Tax Rate vs. IRR and transaction capitalization ($M). ……....40 Figure 4.4. Europe Average Inflation Rate vs. IRR and transaction capitalization ($M). ………... 41 Figure 4.5. North America Total Tax Rate vs. IRR and transaction capitalization ($M). ………...45 Figure 4.6. North America Average Inflation Rate vs. IRR and transaction capitalization ($M). ……….46 Figure 4.7. South America Total Tax Rate vs. IRR and transaction capitalization ($M). ………50 Figure 4.8. South America Average Inflation Rate vs. IRR and transaction capitalization ($M).
11
I. Introduction
In the past six years after the financial crisis, the global private equity market has blossomed into one of the most dynamic and active sectors for financial investment. According to the Preqin 2014 Global Private Equity Report (2014), a report that surveys general partners (GPs) and limited partners (LPs) on the condition of financial markets, 2013 was the strongest year for global private equity fundraising since the financial crisis. Over 873 funds raised an aggregate $454bn to be invested in the coming decade across the globe. Despite a strong fundraising year on the global aggregate, there is regional variation of private equity across various geographic areas.
12 determining where to invest. Most investors and researchers that I met with only
focused on interest rates and macro-economic indicators.
When I began my internship at Bank of America Merrill Lynch in the Financial Sponsors Group, I saw a similar focus on interest rates and macro-economic indicators as the private equity firms we worked for evaluated investment opportunities. Based on my international experience, I was motivated to see whether there was regional variation when introducing a new set of variables—qualitative market characteristics that I thought made each regional private equity market unique.
Background
Mature markets, such as North America and Europe, have significantly different market characteristics than emerging capital markets such as South America and Asia. Preqin (2014) reports that these differences have led to an increase in risk-adverse investors, who have shied away from emerging markets such as Asia, which saw a 37% drop in fundraising for the region in 2013. In fact, any geographic market outside of North America and Europe saw their private equity fundraising drop by 50%. But what factors are driving these geographic decisions by investors?
13 world’s capital markets. My research will fill this gap by expanding on what impact market factors such as total tax rates, government regulation on foreign direct investment, investor protection, inflation, and legal framework have on the transaction volume and returns that private equity funds achieve in four key geographic regions. The four regions analyzed are Asia, Europe, North America, and South America.
Understanding the relationship between different social, legal, and regulatory factors and private equity returns will allow future researchers and professional investors to better predict geographic trends in investment activity based on qualitative factors engrained in each particular region’s culture and business environment.
Hypotheses
Before examining the relationship between private equity returns and activity and the variety of regional factors, I will make hypotheses based on my current knowledge and thoughts on how private equity returns are generated and what regions will be the most active in the three year period from 2012 to 2015.
Regional Hypothesis
With the variety of different factors affecting each regional market, I believe that each regional market will have very different outcomes relating to transaction
14 South American returns and transaction capitalization, due to high inflation and strong investor protection laws. Despite a stable legal framework and investor protection, I believe macro-economic factors will keep Europe from generating positive returns and additionally cause deterioration in transaction capitalization. Many of these hypotheses will hinge on which variables will prove to correlate the most with transaction
capitalization and return.
Variable Hypothesis
In addition to comparing the regions, I also will be comparing what variables tend to most significantly affect private equity transaction capitalization and returns. The obvious main drivers of private equity investment, which much current research and reports cite, are economic growth rates (GDP) and interest rates. With my research, I am taking a step beyond these basic two variables and expanding into five new variables— total tax rate, government regulation on foreign direct investment, investor protection, inflation, and legal framework. This set of new variables will be utilized to determine their effect on the transaction volume and returns that private equity funds achieve in four main geographic regions.
I believe that tax rate and inflation will have the greatest impact on my measured private equity metrics due to the direct relationship between taxes and internal rate of return and how both are attributable to macro-economic conditions, which other literature has examined. My hypothesis is that of the new variables I am observing, investor
15 framework in settling business disputes. Overall, my work will focus on determining regional variation with these new variables that have been previously under-utilized by the literature.
II. Literature Review
16 (Sheahan, 2014). Though Sheahan provides the raw data behind his global market
analysis, he fails to address the specific cultural and economic circumstances that drive growth trends. I will fill the gap by providing better quantitative and qualitative context to each market’s situation and trend. This will structure a data-driven hypothesis, predicting what an optimal market for private equity business building would be.
In the following literature review, I examine research and studies done on thefour regions I am focusing on (Asia, Europe, North America, and South America) to provide information-based conclusions on each region’s private equity environment. After providing qualitative context, I will explore the metrics that have been used by previous researchers to measure private equity success qualitatively. Finally, I provide my conclusion based on the literature along with defining the contribution my research will make in furthering knowledge on optimizing private equity markets.
Variables
Most research done in the field of global private equity has focused on only a few regional market variables—interest rates and macro-economic indicators. Professional reports produced by Bain & Company (2014), Ernst & Young (2014) and Prequin (2014) all focus on measuring returns and transaction volume by observing regional macro-economic changes, such as GDP growth and movement of capital markets, including interest rates on debt. Other literature by Dixit (2001), Chuhan (1998), Goddard (2013) and Megginson (2004) goes more in depth into the international strategy of private equity firms, even exploring the relationships between GPs and LPs, but still fall short of
macro-17 economic factors as the determinants for investment allocation. Rafael La Porta (2000) and Mike Wright (2009) study the effects of investor protection, legal frameworks, and corporate governance on investors, but do not provide conclusions on how it affects investors’ metrics of success, nor apply their theories to a global model. I will build on their research, by examining how their hypotheses have fared over the past decade and provide a global model to examine how these qualitative characteristics shape the success and allocation of global investment.
Geographic Regions
The geographic regions—Asia, Europe, North America, and South America will be covered in this literature review because the majority of current literature and private equity metrics exist for these four continents.
Asia
18 8%; these rates have driven much of the increased investor awareness in the region. Incentives such as tax loopholes and relaxed regulations on foreign investment have spurred business opportunities and therefore, have increased the competition for
investment in Asia (Ippolito, 2007). Despite evidence of success, Prequin (2013) warns that Asia could succumb to the same challenges of mature markets as top-line fundraising becomes more difficult due to changes in the legal and regulatory structures that built Asia into a high growth investment region.
Europe
The private equity environment in Europe has been uneven in its growth and has
seen great regional disparity. In Europe, segmentation and lack of EU integration on
corporate governance and taxation infrastructure has caused European private equity to be segmented into national markets (Megginson, 2004). Alexander Groh (2008) created indices that ranked the attractiveness of 25 European countries for investors. The most important indicator for European private equity is the macroeconomic environment and
activity of each country (Groh, 2010). Countries with strong economies and solid GDP
growth rates (UK, Denmark, Sweden) generally ranked well, while many of the countries
that ranked poorly (Greece, Spain, Italy) have experienced financial contraction since the
global financial crisis. Significant government intervention, in the form of austerity
measures, has slowed investment and deal making in many of the low ranking nations
(Bain, 2013). Macroeconomic growth and government intervention has driven some of
the private equity inconsistencies among European nations.
19 the type of legal system in place. Despite a volatile economy, Ireland ranked well
because of its low corporate tax rate (12.5%) and the open nature of its economy (Tobin,
2013). In a separate report, Groh and Liechtenstein (2011) explain that in Central and
Eastern Europe, investors focus on the potential of institutional and cultural characteristics to turn the economic growth into entrepreneurial activism. Investor protection and corporate governance also play a role in European private equity. Lerner and Schoar (2005) found that relative to the French, Spanish, and German civil law system, investors in common law systems such as the UK use significantly less equity or debt and have significantly higher valuations of their investments. They also state that legal systems with quicker times (common law) to resolve disputes also have higher investment valuations. As a whole, European private equity and venture capital has seen a recovery since the financial crisis, but to learn more about the environments that have driven this change, research must focus on the economic and legal setting in each sovereign market (Megginson, 2004).
North America
20 conducted in North America (Bain, 2013). North America continues to be the strongest area for alternative investment due to strong growth, effective capital markets, and growing deal volume.
Despite significant deal volume and value, other factors in North America’s private equity environment invite some cause for concern. The civil legal system in place in North America (USA, Mexico, Canada) is less adaptable and more restrictive than the common law systems found in parts of Europe, Asia, and South America (Adongo, 2012). The restrictiveness of North America’s civil legal system limits the creativity that investors use and slows down the process of deal making, hampering deal volume (Allen, 2002). Despite the limits of North America’s legal system, private equity has been
successful because of government protection of investor rights. Rafael La Porta (2000) explains that in the USA, “when investor rights such as the voting rights of the
shareholders and the reorganization and liquidation rights of the creditors are extensive
and well enforced by regulators or courts, investors are willing to finance firms” (p.5).
Government sponsored investor protection, along with strong financial and economic
markets make North America a stable private equity environment in spite of a prohibitory
legal system.
South America
A decade of stable government control, conservative fiscal policy, and growth-focused economic policy has led to the growth of a large middle-class and private equity investment opportunities in South America. Ernst & Young (2013), in their Latin
21 enabled governments to promote measures to boost GDP growth, leading to increased interest in emerging South American private equity markets. Private equity funds are increasingly focused on South America’s largest economy, Brazil, where two-thirds of the private equity deals in South America were closed (Debevoise & Plimpton LLP, 2013). Major world events, such as the World Cup and Olympics, along with recent Brazilian energy discoveries, have spurred further investment in the region (Bain, 2013). The 2013 Bain report further explains why the volume of deals has increased, “A still difficult IPO market is prompting companies in need of growth capital to tap alternative sources, and the presence of a big population of family-owned businesses in search of liquidity and succession planning solutions has also led to many deals” (p.18). Increasing government stability in South America is also drawing further investment interest. There
has been increased private equity interest in South America due to recent GDP growth,
the emergence of Brazil, and increased government stability.
Despite increased interest in the alternative investment market in South America,
there are still regional issues within this fast expanding market. Even with the recent success, the region is expected to have flat GDP growth in 2014-2015 at 2.7% (Ernst & Young, 2013). Much of this stagnating growth is due to South America’s reliance on Asian demand for South American exports (Bain, 2013). Despite government stability, a lack of investor protection laws and regulations are a threat to future private equity
22 will continue to monitor South America’s close economic relationship with Asia, as well as changes in investor protection laws and regulations in their planning for additional investment.
Metrics
In addition to the qualitative literature that has been done, different qualitative metrics are also being used to measure private equity markets. The three metrics that have been utilized by researchers and that I will be using in my research are calculation of return, deal volume, and leverage ratio.
Calculating Return
23
IRR is preferred to the simpler return on investment (ROI) calculation because IRR integrates discount rates, providing a more precise measure of return (ACCA, 2014). Disadvantages of using IRR as a calculation of a successful market include small self selected sample sizes and the IRR hyperbole, where private equity firms may embellish certain financial results and metrics (“USC libraries: Limitations of the study,” 2012). Despite these shortcomings, IRR continues to be the most readily available and accurate method to evaluate the financial success of particular regional markets.
Transaction Capitalization
Transaction capitalization is the most common method of measuring overall private equity activity in a particular region. In many global private equity reports,
including Bain (2013), Ernst & Young (2013), Goddard (2013), and Sheahan (2014), deal volume is used to evaluate the regional viability for investment. When explaining
transaction capitalization, these reports segment deal volume into two specific metrics:
a) Average transaction value in each region ($MM) b) Actual number of transactions completed
Figure 2.1: Calculation of Internal Rate of Return (IRR)
24 By multiplying these two metrics together, researchers obtain an estimate for the private equity investment activity for any particular year. Though deal volume provides a good proxy for regional investment activity, it fails to account for the cyclicality of private equity funds (Lerner, 2011). Funds are not always investing, and often times go through multiple years of fundraising (Lerner, 2011). Therefore,
researchers must pair deal volume with a performance-based metric such as IRR to get a complete qualitative view of a region.
Importance of my research
In addition to providing context for existing research to find an optimal market, the importance of my research will be in its diving deeper into what market
25 this question will lead to further study on the application of an optimal private equity environment in areas of the world that currently have very little alternative investment, such as Africa and the Middle East.
III. Research Methodology
My study will gather data in order to understand what characteristics create an optimal private equity and business building environment. I will gather data regarding the unique investing characteristics of different geographic areas where private equity is currently invested. This section describes the (a) research design, (b) sources of data and information, (c) data analysis, and (d) limitations of the study.
Research Design
26 a) Salehi and Golafshani (2010) find that the researcher can minimize
the limitations and capitalize on the strengths of each approach by combining both quantitative and qualitative methods.
b) Tashakkori and Teddlier (2003) argue that researchers are enabled to use a more comprehensive approach when they use mixed method research.
This study aims to collect valuable qualitative and quantitative data. I will collect data from two sources: financial data and geographic data. I will generate qualitative data by leveraging academic research and professional industry reports.
Sources of Data and Information
I will find data for my research from three sources: World Economic Forum survey results, database statistics, and academic/professional reports. I will aggregate these three sources in order to map trends in private equity in different geographic areas and evaluate what factors make each market environment successful.
World Economic Forum Survey Results
I will be using survey data and statistics from the World Economic Forum’s Global Competitiveness Report from the years 2012-2015. The variables I will be examining from these rankings will be:
27 c) Government regulations on Foreign Direct Investment (FDI)
d) Investor Protection
e) Efficiency of legal framework in settling disputes
The WEF report ranks over 144 countries in six continents by these variables. For each region, I took the five most active countries in private equity and averaged their yearly rankings, tax rates and inflation rates in order to have a regional average for which to compare to the regional transaction capitalization and returns.
Databases
I plan to gather financial data via databases to provide my research with a quantitative structure. I will use CapitalIQ, Dealbreaker, and Burgis Private IQ as my main databases. Academic institutions use these three databases for research purposes, while financial professionals use them to evaluate the potential viability and valuation of future investment opportunities. I will collect three specific sets of data regarding global private equity deals using CapitalIQ, Dealbreaker, and Burgis Private IQ, including:
a) Average transaction capitalization (volume) in each region and how volume has changed over the last three years
b) The internal rate of return (IRR) achieved by reporting private equity firms in each region
28 quantitative benchmarks to test the affects of the variables shown in the World
Economic Forum report. Return on investment will be used as a measure of success, with regions showing 10+% returns constituting a high level of success.
Academic Research and Professional Analysis
I plan on using academic research and professional private equity analysis to provide context for my WEF survey data and my database financial data. I will focus on finding reports published within the last 10 years to ensure I have research from both before and after the financial crisis. I will choose research articles with a focus on the unique characteristics of each region’s private equity market. The characteristics found from these reports will help determine which specific characteristics compose an optimal private equity-investing environment.
Analysis
The procedure for my data analysis has two key steps. First, I will create a series of graphs to compare and contrast the key variables of the private equity environments of four geographic regions. Each graph will examine how a particular variable (i.e.
inflation) affects return on investment in the area. In the second step, I will examine the most successful areas on the graphs to identify market features that have contributed to positive returns.
Graphing
29 from my data will create visualization of the how the following variables affect return on investment:
a) Government regulation: At what level does government regulate and restrict private investment?
b) Legal framework: At what level do regional laws and intellectual property rights restrict investing success?
c) Transaction capitalization: How does transaction size and deal volume vary across the globe? What drives the global variation?
d) Tax & inflation rates: How does amount to regional tax rates and inflation rates affect global investment returns and transaction capitalization?
The various graphs produced will allow me to identify which market features allow geographic regions to generate the greatest return on investment.
Limitations
The research produced in this study will rely on a number of imperfect sources. For example, WEF survey results are self-reported and therefore subject to the following biases:
30 b) Hyperbole: firms may embellish certain results, metrics, and
experiences (“USC libraries: Limitations of the study,” 2012) c) False Attribution: respondents may accredit positive results and
successes to the respondent’s own work but ascribe negative results and failures to external factors (“USC libraries: Limitations of the study,” 2012)
31
IV. Findings: Regional Case Studies
32
Asia
Bain & Company (2014), in their Asia-Pacific Private Equity Report, label the Asian market as “working through a multi-year transition” leaving significant unspent capital and few lucrative opportunities for exiting existing investments. Currency and governance issues in Asia have hampered the returns and investor sentiment from record capital in-flow into the region (Bain & Company, 2014). I analyzed the tax rates,
inflation rates, and qualitative factor ranking for the five largest private equity markets (based on Burgiss Private IQ data) on the continent—China, South Korea, Japan, Hong Kong SAR, and Singapore, in order to find what factors may be driving these results.
Total Tax Rate
Total tax rate as defined by Klaus Schwab (2014) of the World Economic Forum is “a combination of profit tax (% of profits), labor tax and contribution (% of profits), and other taxes (% of profits).” Figure 4.1 illustrates the relationship between the average
33
IRR also seems to rise with the decrease in the total tax rate in 2013 but then leveled off growth when taxes returned to 38.3% in 2014. Bain & Company (2014) warns that further tax hikes in Japan could cause investors to reallocate investments to other Asian countries such as Korea and even the South Pacific such as Indonesia.
Inflation Rate
Klaus Schwab (2014) compiled the inflation rates of 144 countries by measuring the annual percent change in the consumer price index. In line with my hypothesis that the inflation rate variable would be the one of the most impactful of the control metrics, the decreasing average Asian inflation rate, from 3.4% in 2012 to 2.2% in 2014, mirrored an increase in IRR—8.3% to 11.8% in the same period. At the same time, transaction
0 5,000 10,000 15,000 20,000 25,000 30,000 0.0% 5.0% 10.0% 15.0% 20.0% 25.0% 30.0% 35.0% 40.0% 45.0%
2012 2013 2014
34 capitalization seemed to have no particular correlation to the decrease in inflation, as the transaction capitalization seems to move independently from inflation rates.
Government Regulation on FDI
Since many of the countries in Asia are still developing at a high growth rate, additional foreign capital is desirable. The World Economic Forum’s rankings on the strictness of regulation on foreign direct capital (FDI) reflect these economic trends, as two of the selected countries (Hong Kong, Singapore) ranked in the second and third place every year from 2012 to 2015, with low ranks indicating encouraging FDI regulation, and higher ranks indicating adversarial government regulation for foreign investors such as private equity investors. As displayed in the table below, we see an odd
0 5,000 10,000 15,000 20,000 25,000 30,000 0.0% 2.0% 4.0% 6.0% 8.0% 10.0% 12.0% 14.0%
2012 2013 2014
35 trend of increased adversarial government regulation affecting foreign investment,
though it does not seem to negatively affect returns, as IRR increases from 8.31% in 2012 to 11.80% in 2014.
2012 2013 2014
Regulations Effect on FDI (Average Rank) 35 37 42
Internal Rate of Return (IRR) 8.31% 10.78% 11.80%
Transaction Capitalization ($M) 17,056 27,212 19,440 Countries such as the Republic of Korea and Japan offset the encouraging FDI regulation of Hong Kong, Singapore and partially China (ranked in the mid-20s) due to significant protectionist regulation. Despite these regulations, according to Bain & Company survey data, many GPs continue to express interest in Korea and Japan due to impending laws set to break up large conglomerates that constrict the ownership structure of much of each respective country’s business environment (2014). New anti-trust laws would help continue Korea’s strong recent deal flow, and make it a huge target for new investment.
Efficiency of legal framework in settling disputes
The efficiency of legal frameworks revealed similar correlations and rankings to the FDI regulation. With low ranks indicating extremely efficient legal framework in settling disputes between private businesses and higher ranks indicating inefficient legal
36 low ranks, even having Singapore rank the most efficient legal framework (rank #1) of all the WEF surveyed countries.
Countries such as Korea and China raised the regional average ranking of Asia, while Japan, Hong Kong and Singapore brought the average down to a respectable low 30s ranking from 2012 to 2014. The ranking of efficiency of legal framework did not seem to greatly affect IRR or transaction capitalization of private equity firms, nor did secondary research and survey data bring up legal framework as a factor for LPs.
monitor.
Investor Protection
For private equity investors, especially when investing in global markets, strong investor protection laws are essential in making investment decisions. For Asia, investor protection displayed a similar trend to governmental FDI regulation and legal framework efficiency. With low rankings indicating a high level of investor protection and higher rankings indicating less legal protections for investors, Hong Kong and Singapore once
Year 2012 2013 2014
Efficiency of legal framework in settling disputes 33 32 31
Internal Rate of Return (IRR) 8.31% 10.78% 11.80%
Transaction Capitalization ($M) 17,056 27,212 19,440 Table 4.2: Asia efficiency of legal framework in settling disputes vs. IRR and Transaction
37 again were leaders of stability, ranking globally third and second respectively in
investor protection.
Year 2012 2013 2014
Investor Protection 33 42 44
Internal Rate of Return (IRR) 8.31% 10.78% 11.80% Transaction Capitalization ($M) 17,056 27,212 19,440
Interestingly, Asia’s largest market, China, ranked very poorly at 83 in 2014, explaining why many private equity investors are choosing to reallocate from the Greater China area into other areas, such as Korea and Southeast Asia. Japan’s rankings fall from 17 in 2012 to 85 in 2014 also skewed the rising regional ranking average. Japan’s
decrease in investor protection has been due to increasing currency struggles and nationalist regulatory policies. Lynn Hew explains that investor protection in Asia, specifically Japan, could struggle due to a wavering commitment to disclosure of conflicts of interest by board members, fewer remedies available in case of prejudicial related-party transactions and a lack of safeguards for shareholders of privately held companies (2003). As whole, rising investor protection ranking seem to couple with a slowing growth in IRR, but does not seem to affect transaction capitalization.
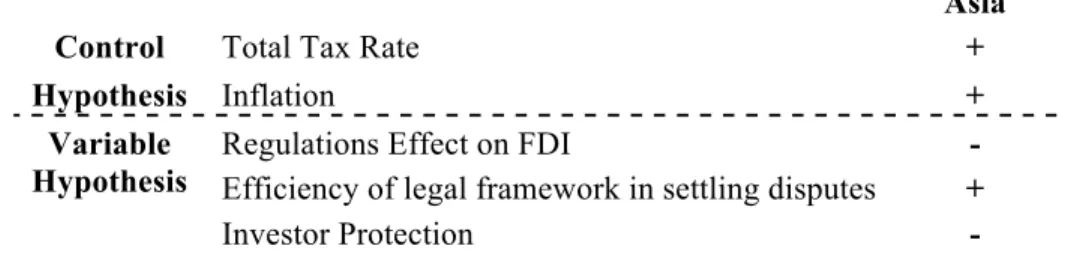
Summary
The table below shows how the findings either prove or disprove my hypothesis and show how effective they are in affecting private equity returns and transaction volume. In Asia, the control hypotheses of tax rate and inflation were significant factors, as was the newly introduced variable of efficiency of legal frameworks.
38
Europe
After four rough years enduring the lingering effects from the Euro Zone crisis, European private equity has offered signs of positivity. At the peak of the continents issues in 2009, banks withdrew from the market, and economic uncertainty dented investor confidence resulting in only 672 buyouts with a transaction capitalization worth €30.5 billion being closed in Europe (Bagshaw, 2014). Key debt markets in Europe,
including the UK, have begun to return to low interest rates. The emergence of alternative sources of acquisition finance, such as asset-based lending has also helped lure investors back into the European continent. Though returns will likely continue to struggle and lag behind other geographic regions, there is room for optimism as Europe rises out of recession. My study analyzed the five major sovereign private equity markets in Europe-the United Kingdom, Germany, France, Italy, and Norway.
Total Tax Rate
When I first started my study, I hypothesized that Europe would generally have higher total tax rates in comparison to other geographic regions, but I was curious to see
Asia
Control Total Tax Rate +
Hypothesis Inflation +
Variable
Hypothesis Regulations Effect on FDI Efficiency of legal framework in settling disputes + -
Investor Protection -
39 whether these high tax rates would affect returns or transaction volume in Europe. As seen in Figure 4.3, the average total tax rate of the European countries included in the study stayed constant while returns dropped from 8.54% in 2012 to 2.74% in 2015, indicating no correlation. At the same time, transaction capitalization grew, indicating that the beginning of new investment of dry powder capital.
Countries such as Italy and France have total tax rates of over 60%, which drove the regional average tax rate up, despite these two countries accounting for less than 25% of transaction capitalization in Europe. The United Kingdom, Europe’s most private equity-engaged country, had the lowest tax rate (34.0%), and the region set to see the most growth in transaction capitalization. Since we can conclude that total tax rate is not the main factor affecting European private equity, it is important to evaluate what other market characteristics investors are monitoring, other than the obvious factors such as GDP growth and interest rates.
0 10,000 20,000 30,000 40,000 50,000 60,000 70,000 0.0% 10.0% 20.0% 30.0% 40.0% 50.0% 60.0%
2012 2013 2014 T
ran sac ti on C ap ital iz ati on ($M ) P er ce n tage (%) Year Transaction Capitalization ($M)
Total Tax Rate
40 Inflation Rate
Inflation rate seems to affect returns in my case study of Europe. Interestingly enough, it IRR decreases as inflation decreases, the opposite correlation from what was observed in Asia. As inflation decreases from 3.1% in 2012 to 1.6% in 2014, IRR decreases accordingly, changing from 8.54% in 2012 to 2.74% in 2014. For
transaction capitalization, we see similar results as observed in Asia, as the decrease in inflation (due to an overall stabilization of the European economy) is correlated with an increase in transaction volume.
- 10,000 20,000 30,000 40,000 50,000 60,000 70,000 0.0% 1.0% 2.0% 3.0% 4.0% 5.0% 6.0% 7.0% 8.0% 9.0%
2012 2013 2014
T ran sac ti on C ap ital iz ati on ($M ) P er ce n tage (%) Year Transaction Capitalization ($M) Inflation
41 Government Regulation on FDI
As a more developed continent than emerging markets such as Asia and South America, I hypothesized that government regulation on FDI would be more significant in Europe than in those maturing economies. Based on my study shown in table 4.5, this hypothesis was validated as the countries selected for my survey ranked in the 50-60 range, while Asia was more lenient on FDI, with an average rank in the 30’s. This is mostly due to the stricter FDI regulation in Italy and France, both ranked in the upper half of countries surveyed in the WEF report. The UK once again displayed why it is the hot bed of European private equity, as its regulations ranked as the eighth most favorable for FDI. The decreasing average rank (62 in 2012 to 51 in 2014) also displays correlation with the corresponding increase in transaction capitalization from 2012-2014.
Efficiency of legal framework in settling disputes
My hypothesis was that more developed markets would have a great efficiency of legal framework. For several European countries, including the UK, Germany and France this is true, and their legal frameworks ranked among the most efficient in the world. But the extremely inefficient and ineffectiveness of the Italian legal framework (ranked 143 out of 166 in 2014) significantly lowered Europe’s average regional ranking to 50 in
2012 2013 2014
Regulations Effect on FDI 62 69 51
Internal Rate of Return (IRR) 8.54% 6.38% 2.74% Transaction Capitalization ($M) 37,157 61,219 53,250
42 2014. Despite this outlier, I still believe that the low rankings of the other countries validate efficient legal frameworks as a factor on why investors are attracted to the region. Table 4.6 displays the progression of these legal framework efficiency rankings vs. returns and transaction volume.
2012 2013 2014
Efficiency of legal framework in
settling disputes 52 54 50
Internal Rate of Return (IRR) 8.54% 6.38% 2.74%
Transaction Capitalization ($M) 37,157 61,219 53,250
Ian Bagshaw of White & Case explains that investment opportunities in both the US and Europe are in part sought after because of the legal structures that exist in order to resolve disputes regarding capital structure (2014). Additionally, Bagshaw adds that the integration of US and European capital markets (US debt being used in European deals) has made the legal framework more complex, but the main countries (UK, Germany, France) have adjusted accordingly.
Investor Protection
I hypothesized that investor protections in Europe would be strong due to the developed nature of its capital markets and its complex legal framework. I was surprised to find that only the UK ranked well with strong investor protection (#10) among the
43 European countries included in the study. Especially surprising were the low marks that Germany and France garnered, both ranking 83 and 68 respectively.
Norway was another bright spot for Europe, ranking at 22 for its investor
protection. Much of the recent investment into Scandinavia has been because of Table 4.7 displays the progression of the regional average investor progression rankings, which are higher (weaker investor protection) than Asia. Overall, Europe surprised me with lower than average investor protection rankings, potentially a reason that Europe has taken so long to climb out of the financial crisis.
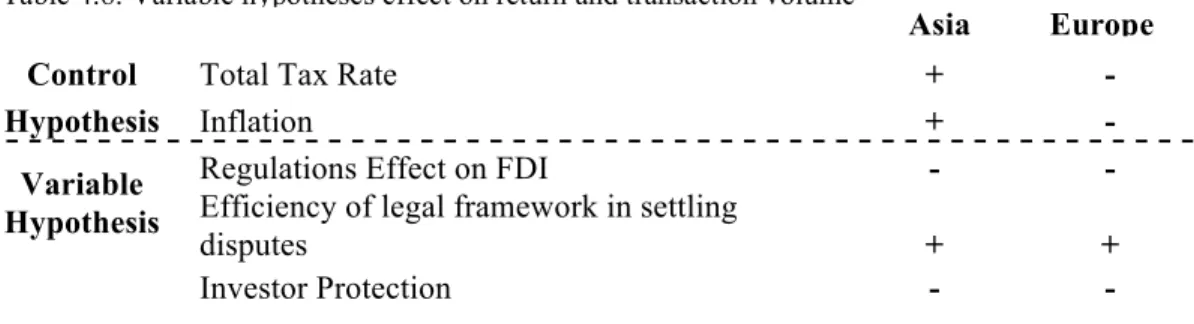
Summary
In Europe, we saw different results, as we saw the macro-economic variables of total tax and inflation not to be relevant, and only observed the efficiency of legal framework being significant in association with private equity success. Though a
combination of different macro-economic factors were most likely to blame (Euro-crisis) it is interesting to see how almost none of the observed variables could explain Europe’s situation.
2012 2013 2014
Investor Protection 52 51 52
Internal Rate of Return (IRR) 8.54% 6.38% 2.74%
Transaction Capitalization ($M) 37,157 61,219 53,250
44
North America
North America continues to be the global leader in private equity returns and transaction volume. Much of this can be attributed to the majority of mega fund private equity firms such as Blackstone and KKR being based in the USA. The cooling of emerging alternative investment markets also have led to investors seeking more mature markets like the United States. But what other factors continue to keep North America as the preferred region for investors? I studied the United States, Mexico, and Canada to see how unique market characteristics correlate with returns and transaction capitalization from 2012 to 2014.
Total Tax Rate
When I hypothesized about North America’s tax rate, I thought it would be among the higher tax rates in the world. I also hypothesized that any decrease in tax rate would result in higher returns and greater transaction volume. As seen in Figure 4.5, my second hypothesis was validated by the data collected from WEF and Burgis Private IQ. As the total regional average tax rate dropped from 43% in 2012 down to 41% in 2014,
Control Total Tax Rate + -
Hypothesis Inflation + -
Variable Hypothesis
Regulations Effect on FDI - -
Efficiency of legal framework in settling
disputes + +
Investor Protection - -
Table 4.8: Variable hypotheses effect on return and transaction volume
45
the regional internal rate of return rose from 14.2% in 2012 to 15.8% in 2014. Though the changes may not be as extreme as other regions, it is important to realize that the scale of the North American market is much larger (over twice the size of Europe and six times the size of Asia) and therefore harder to make significant changes due to the tremendous amount of capital already committed to the region. I was very surprised to see that the total average regional tax rate in the USA ended up being significantly lower than in either Europe or South America, and even was comparable to Asian tax rates.
Inflation Rate
The impact of the inflation rate continued to prove my control hypothesis in my analysis of North America. The inflation rate affected returns and transaction volume in North America similarly to how inflation affected the same metrics in Asia-decreasing inflation resulted in increases in IRR and transaction capitalization. This correlation can be seen in Figure 4.6,
140,000 145,000 150,000 155,000 160,000 165,000 170,000 175,000 180,000 185,000 190,000 195,000 0.0% 5.0% 10.0% 15.0% 20.0% 25.0% 30.0% 35.0% 40.0% 45.0%
2012 2013 2014
T ran sac ti on C ap ital iz ati on ($M ) P er ce n tage (%) Year Transaction Capitalization ($M)
Total Tax Rate
46
with inflation and IRR plotted on the first y-axis, and transaction volume plotted on the second y-axis.
Though inflation seems to be a key factor driving the decision making of
investors in the USA, it is important to examine other factors that may make it by far the largest private equity market.
Government Regulation on FDI
Like its mature market counterpart Europe, North America had middling ranks on their encouragement of foreign direct investment. North America is driven by the large capital markets available in North America to use debt for purchases and equity markets for exits, lessening the need for FDI to spur the economy. Mexico had the most
encouraging government regulation ranking while Canada had the strictest regulation.
2012 2013 2014
Regulations Effect on FDI 53 53 52
140,000 145,000 150,000 155,000 160,000 165,000 170,000 175,000 180,000 185,000 190,000 195,000 0.0% 2.0% 4.0% 6.0% 8.0% 10.0% 12.0% 14.0% 16.0% 18.0%
2012 2013 2014
T ran sac ti on C ap ital iz ati on ($M ) P er ce n tage (%) Year Transaction Capitalization ($M) Inflation
Internal Rate of Return (IRR)
Figure 4.6: North America Average Inflation Rate vs. IRR and Transaction Capitalization ($M)
47 Internal Rate of Return (IRR) 14.25% 15.84% 15.82% Transaction Capitalization ($M) 159,290 189,054 167,314
Though government regulation on FDI is certainly a factor that investors monitor, it is not quite the driving market factor that inflation is.
Efficiency of legal framework in settling disputes
North America also had middling ranks in the regions efficiency of legal framework in settling disputes. Canada had the greatest efficiency, ranking just outside the top ten, while Mexico and their broken judiciary system ranked 99th.
2012 2013 2014
Efficiency of legal framework in settling disputes 48 45 44
Internal Rate of Return (IRR) 14.25% 15.84% 15.82%
Transaction Capitalization ($M) 159,290 189,054 167,314 These results once again surprised me, as I had hypothesized that efficiency of legal
systems would be a major driver of returns and transaction volume while it seems that the ranking does not impact returns nor volume in a significant manner.
Investor Protection
In North America, investor protection appears to have been the key reason that the region’s transaction capitalization ($167,314M in 2014) is more than three times greater than the next largest region (Europe with $53,250M in 2014). Besides the outlier of Mexico, which ranked 57th in investor protection laws in 2014 (great improvement from
48 78th in 2012), the United States and Canada make up the strongest combination of
market size and investor protection laws, as they ranked 5th and 6th respectively.
These high rankings for the United States and Canada are due to the required accountability of board members to shareholders in North America, and the increasing amount of compliance, supervision, and due diligence required from companies (Hew 2003).
Summary
In North America, we observed similar conclusions as we saw in Asia, with the addition of investor protection laws becoming a meaningful factor.
2012 2013 2014
Investor Protection 30 24 22
Internal Rate of Return (IRR) 14.25% 15.84% 15.82%
Transaction Capitalization ($M) 159,290 189,054 167,314
Asia Europe North America
Control Total Tax Rate + - +
Hypothesis Inflation + - +
Variable Hypothesis
Regulations Effect on FDI - - -
Efficiency of legal framework in
settling disputes + + +
Investor Protection - - +
Table 4.11: North America investor protection vs. IRR and Transaction Capitalization
49
South America
Underlying secular trends such as a growing middle class and favorable
demographics in South America have made the region increasingly significant in global private equity. But still after recent years of growth in transaction volume and economic growth, South America has been hampered since 2012 by weakening economic
conditions, both domestically and in its largest trade partner, China (Bunder 2013). Bunder mentions that firms must have patience, resilience, robust networks, access to local resources and ability to add value in active partnership with entrepreneurs to succeed in the region.I used the four main South American countries invested in private equity for my study - Peru, Brazil, Argentina and Chile.
Total Tax Rate
50
Tax rates for the region rose from 60.3% in 2013 to 63.2% in 2014, making them the highest regional tax rates for the four geographic regions included in my study. Corresponding with the tax rate increase, we see a fall in IRR and transaction capitalization. Countries such as Chile had lower tax rates (27.7% in 2014) but were offset by the extremely high tax rates of Argentina (107.8% in 2014), which were the second highest of the 144 countries surveyed by the WEF. Tax rate once again seems to drive both returns and transaction capitalization.
Inflation Rate
The inflation rate in South America is particularly relevant because much of demand for many of the region’s biggest companies and industries is domestic—meaning that inflation directly affects the profitability of South America’s main industries. In accordance with the research from Jeff Bunder in his Ernst & Young report (2014), the past three years have been particularly difficult due to decreasing domestic demand,
0 1,000 2,000 3,000 4,000 5,000 6,000 -10.0% 0.0% 10.0% 20.0% 30.0% 40.0% 50.0% 60.0% 70.0%
2012 2013 2014
T ran sac ti on C ap ital iz ati on ($M ) P er ce n tage (%) Year Transaction Capitalization ($M)
Total Tax Rate
Internal Rate of Return (IRR) Figure 4.7: South America Total Tax Rate vs. IRR and Transaction Capitalization ($M)
51 mostly due to rising inflation, which has slowed the growth of a previously emerging middle class.
Average regional inflation rose from 5.8% in 2012 to 6.9% in 2014 in South America, mostly due to increases in South America’s two largest economies—Argentina and Brazil. We see the results of increased inflation, as IRR dips into negative returns, while transaction capitalization dropped from $5,354M in 2012 to $3,231M in 2014. According to my study, inflation continues to have an inverse relationship with regional returns and transaction volume.
Government Regulation on FDI
There was quite a bit of disparity in the rankings of the four countries’
regulations on FDI. Countries still using many of the neo-liberal policies enacted in the 0 1,000 2,000 3,000 4,000 5,000 6,000 -2.0% -1.0% 0.0% 1.0% 2.0% 3.0% 4.0% 5.0% 6.0% 7.0% 8.0%
2012 2013 2014 Tran
sac ti on C ap ital iz ati on ($M ) P er ce n tage (%) Year Transaction Capitalization ($M) Inflation
52 20th century, such as Peru and Chile, had very encouraging government regulation on FDI, ranking in the top quarter of countries surveyed. On the other side, other South American countries such as Argentina have implemented very restrictive regulation on foreign investors, which coupled with high tax rate and increasing inflation, has driven investors from the country.
2012 2013 2014
Regulations Effect on FDI 63 70 75
Internal Rate of Return (IRR) -0.14% -1.14% -1.41% Transaction Capitalization ($M) 5,354 4,375 3,231
My study observes that the average regional regulation rank increases from 2012 to 2014, correlating with the decrease in IRR and transaction capitalization. Based on the results from the other emerging market region (Asia), favorable FDI regulations are key to luring private equity investors. Based on my results, Asia has done better job than South America of opening up to FDI, and has been rewarded with increased transaction volumes and returns.
Efficiency of legal framework in settling disputes
Similarly to the regions falling WEF ranking on government encouragement of FDI, South America also is enduring plummeting efficiency of legal frameworks in the four countries chosen for my study. Though Chile ranked the highest in legal framework efficiency, all four countries saw their rankings fall from 2012 to 2014.
53
2012 2013 2014
Efficiency of legal framework in settling
disputes 63 93 102
Internal Rate of Return (IRR) -0.14% -1.14% -1.41%
Transaction Capitalization ($M) 5,354 4,375 3,231
Table 4.14 displays this decrease in legal efficiency and the correlated decrease in IRR in transaction capitalization. Though this decrease in metrics may be the result of a
combination of factors, including the rising tax rate, increasing inflation, less favorable legislation and a decrease in legal framework efficiency, this case study of South American private equity from 2012 to 2014 displays an example of poor private equity conditions.
Investor Protection
Investor protection was one ranking on which South America had comparable conditions to other geographic regions. Relying on low rankings from Chile and Peru, ranked 34th and 16th respectively, South America’s investor protection ranking stayed stable around 50th out of the 144 countries surveyed by the World Economic Forum. Table 4.15 shows this stability, something rare for the South American continent.
Investor protection continues to be a non-factor, disproving my original hypothesis that it would be the most impactful qualitative variable.
54
Summary
The South America findings support the control hypotheses of total tax rate and inflation as well as efficiency of legal framework in settling disputes. Additionally, government regulation on foreign direct investment became a relevant factor, where it had not been in the previous three regions.
2012 2013 2014
Investor Protection 51 53 50
Internal Rate of Return (IRR) -0.14% -1.14% -1.41%
Transaction Capitalization ($M) 5,354 4,375 3,231
Asia Europe
North America
South America
Control Total Tax Rate + - + +
Hypothesis Inflation + - + +
Variable Hypothesis
Regulations Effect on
FDI - - - +
Efficiency of legal framework in settling
disputes + + + +
Investor Protection - - + -
Table 4.16: Variable hypotheses effect on return and transaction volume
55
V. Analysis
In this section I will discuss the implications of my results, their relations to existing literature for global alternative investment, and areas for further research.
56 surprising results, as the region reported a decreasing IRR (to -1.41% in 2014) and saw a 39.7% decrease in transaction volume. The next step was examining what factors were driving the observed geographic results.
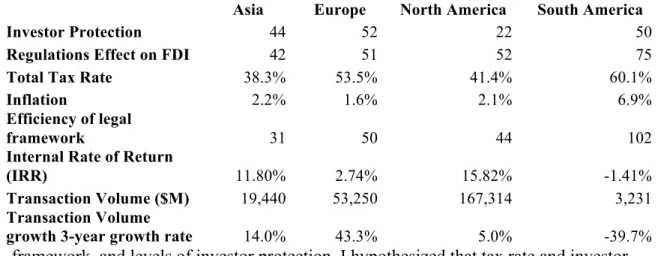
I set out to observe the impact of five unique market characteristics—total tax rate, inflation, government regulation on foreign direct investment, efficiency of legal
framework, and levels of investor protection. I hypothesized that tax rate and investor protection would be the main two factors monitored, followed by government regulation on FDI and legal framework efficiency. I predicted that inflation would have the least impact on private equity metrics. After analyzing the regions by their WEF rankings for the five variables, I compiled the results into Table 5.1.
The results, shown in Table 5.1, actually prove different conclusions from my hypothesis. Inflation actually had a strong inverse relationship with returns and transaction volume in every region except Europe. Total tax rate was also positively
Asia Europe North America South America
Investor Protection 44 52 22 50
Regulations Effect on FDI 42 51 52 75
Total Tax Rate 38.3% 53.5% 41.4% 60.1%
Inflation 2.2% 1.6% 2.1% 6.9%
Efficiency of legal
framework 31 50 44 102
Internal Rate of Return
(IRR) 11.80% 2.74% 15.82% -1.41%
Transaction Volume ($M) 19,440 53,250 167,314 3,231
Transaction Volume
growth 3-year growth rate 14.0% 43.3% 5.0% -39.7%
57 correlated with returns and transaction volume. The efficiency of legal frameworks in resolving private business disputes seemed important to the returns of a region, but did not factor into the transaction capitalization. Investor protection proved to the least significant variable since Asia, Europe, South America, and North America all had similar rankings yet had vastly different returns and volumes. The impact of government regulations on FDI did not appear to have major impact on metrics in this observation but still it was clear to higher rankings resulted in a worse overall market for private equity (i.e. South America).
These conclusions on the variables build on the research done by Alexander Groh, who determined that, the strength of capital markets and interest rates, especially in Europe, were key determinants for alternative investment success (2011). My quantitative ranking analysis of the qualitative variables helps fill in white space left by Rafael La Porta, who stated that different legal frameworks, such as the differences between common and civil law have influence on the success and confidence of investors (2002). Finally, my research builds on the preliminary findings of reports by Bain & Company (2013) and Ernst & Young (2014), which offer a basic measurement of how the private equity industry is performing regionally, with offering explanation as to why these changes in investor preferences are occurring.
Though my research reached conclusions on five of the most relevant variables affecting private equity investing, there is opportunity for my research to be expanded in order to include even more variables that investors may monitor while doing due
58 regionally by using the World Economic Forum Global Competitiveness report include the intensity of local competition, labor-employer relations, quality of education system, quality of overall infrastructure, and strength of auditing and reporting standards (2015). By doing further testing on these variables, one would be able to discover if more qualitative market factors would be beneficial when investors invest by observing how the rankings influenced return and transaction capitalization. Another metric I would like to be able to measure in all geographic regions is average leverage ratio of transactions. Unfortunately, any reporting of that statistic is highly imperfect due to selective bias of only select firms reporting results and general inconsistently in debt ratio reporting across the globe. In conclusion, my research has opened up the opportunity for more research to analyze the effects of additional qualitative market characteristics of countries across five continents.
VI. Conclusion
59 periods of recessed investment (USA, Europe), while other regions begin to deal with slowing growth (South America, China). The combination of exogenous and indigenous factors creates a unique mix that defines each region’s market for alternative investment. This conclusion is in line with many of the professional reports I referenced, including Bain & Company (2014), Ernst & Young (2014), and Prequin (2014). But the
professional researchers at these firms fall short of describing what market factors distinguish each region. Beyond understand the uniqueness of each region it is clear that some of the new qualitative variables that I introduced to my research hold different weights in different regions.
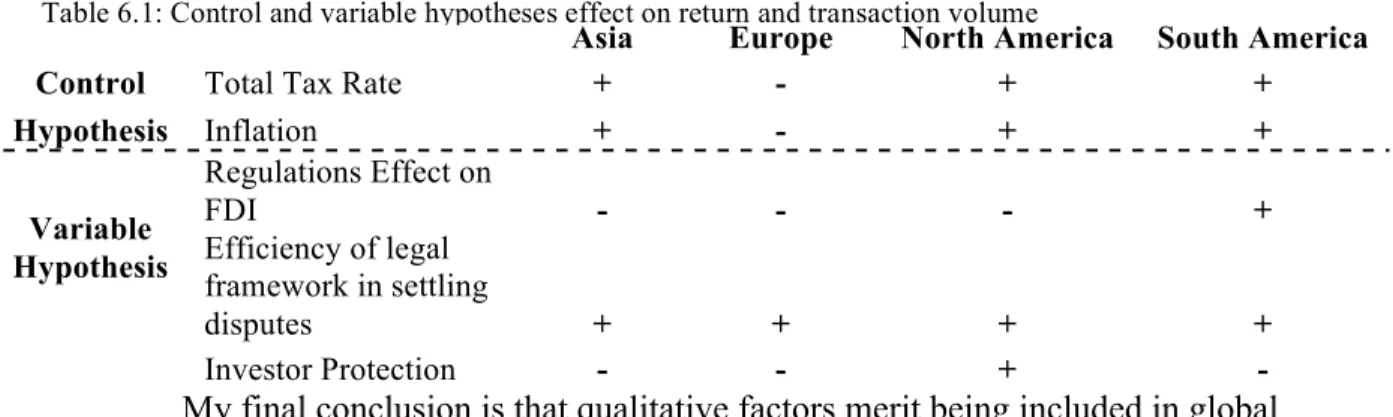
An observation I made as I looked into the qualitative market factors used in the study was that in some regions, depending on history and trading partnerships, certain factors had greater impact than they did in other areas of the world. For example,
according to Table 6.1 below, government regulation on FDI was not a significant market factor for Asia, Europe, and North America. But South America, a region historically reliant on foreign investment due to neo-liberal policies implemented in the 20th century, relies heavily on foreign direct investment and trade partnerships with high growth areas such as Asia (Weyland, 2004). So when the World Economic Forum rankings reflected an increase in foreign business restrictiveness in South American countries, not only did transaction volume tumble, but private equity returns also struggled.
60 macro-economic improvement are the main reasons that the US private equity market has been the strongest to emerge out of the global financial crisis (Saunders, 2010). By observing this association, we see that investor protection is the most impactful
qualitative factor for North America. We can also use the table to determine which region would, and has struggled the most through the financial crisis. Through my study,
61
My final conclusion is that qualitative factors merit being included in global private equity. Of the five variables I tested, both control and variable, only one variable had an impact in all four regional private equity markets. Despite most professional reports and academic literature only focusing on macro-economic variables, such as interest rates, inflation rates, and tax rates, it was efficiency of legal framework in settling disputes, which had association with returns and transaction capitalization in every region. The combination of exogenous and indigenous factors is a threat to the internal validity of this conclusion, but regardless, its prevalence in my study makes it a necessary issue when discussing how the global private equity market is reflected in the literature.
Implications
My findings open up white space for further research into the significance of qualitative market characteristics as it applies to the global alternative investment industry. For years, literature has almost solely focused on reflecting and predicting private equity success using macro-economic variables. In my research, I explored
Asia Europe North America South America
Control Total Tax Rate + - + +
Hypothesis Inflation + - + +
Variable Hypothesis
Regulations Effect on
FDI - - - +
Efficiency of legal framework in settling
disputes + + + +
Investor Protection - - + -
62 whether other qualitative variables could also impact the success of private equity
returns and volume. Professional reports, such as the work by Bain & Company and Ernst & Young, largely ignores qualitative context, and purely focuses their predictions on macro-economic trends in capital markets and economic growth.
Other academics, such as Groh (2010), Wright (2009), and La Porta (2002) attempt to cover the impact of qualitative variables on alternative investing, but fail to account for global variation and don’t apply the variables to metrics of investing success. For example, La Porta (2002) covered the issue of investor protection and legal
frameworks, but only focused on the differences between the civil and common law systems, not the actually legal process needed in private business lawsuits, which is what the variable “efficiency of legal framework” covers. Wright (2009) covers the topic of corporate governance in private equity decision-making, but fails to apply his theory to a global model, and falls short of testing his theory with real data. With my research, I hope to create white space where researchers such as Groh and Wright can test the associations of other qualitative factors listed in the WEF Global Competitiveness report (2014) vs. the success and activity of alternative investment firms.
63 continue to grow in the coming years, and I hope that my contribution will allow more academics to analyze market characteristics through a global data-driven approach.
VII. References
Adongo, J. (2012). The impact of the legal environment on venture capital & private equity in Africa. Middle Tennessee State Journal, 5(2) Retrieved from
http://www.afdb.org/fileadmin/uploads/afdb/Documents/Knowledge/The%20impact %20of%20the%20legal%20environment%20on%20venture%20capital%20and%20 private%20equity%20in%20Africa%20Empirical%20evidence.pdf
Allen, F., & Song, W. (2002). Venture capital and corporate governance. Financial Institutions Center, 03(05) Retrieved from
http://d1c25a6gwz7q5e.cloudfront.net/papers/1115.pdf
64 Retrieved from
http://www.accaglobal.com/in/en/student/foundation-lvl-qual-
student-journey/qualification-resources/foundation-lvl-qual/cat-qualification/ffm/ffm-technical-articles/the-internal-rate-of-return.html
Bagshaw, I., Irving, R., & Youle, R. (2013). Defying the odds: The rise of european private equity. White & Case, Retrieved
from http://www.whitecase.com/files/Publication/762e76d0-d2ba-43f6-9da5- c03e233da3f9/Presentation/PublicationAttachment/79ff6979-9f4b-47f7-8f98-5c277f92154d/print-insight-the-rise-of-european-private-equity.pdf
Bain & Company. (2013). Global private equity report 2013. Retrieved from
http://www.bain.com/publications/articles/global-private-equity-report-2013.aspx
Bain & Company. (2014) Asia-pacific private equity report. Bain & Company Private Equity, Retrieved from http://www.bain.com/Images/REPORT_Asia-Pacifc-Private-Equity-Report-2014.pdf
Bhalla, V., Harris, C., Khanna, D., Wu, X., & Dolya, A. (2012). Private equity in southeast asia: Increasing success, rising competition. BCG Reports, Retrieved
fromhttp://www.bcg.com/documents/file123328.pdf
Bunder, J., Rogers, M., Serventi, D., Asciutti, C., Hache, O., & Witte, P. Private equity roundup: Latin america. Ernest & Young, Retrieved from
http://www.ey.com/Publication/vwLUAssets/Private_equity_roundup_for_Latin_A merica/$FILE/EY-Private_equity_roundup_Latin_America.pdf
Chuhan, P., Claessens, S., & Mamingi, N. (1996). Equity and bond flows to latin america and asia: The role of global and country factors. Journal of Development
Economics, 55(2) doi:10.1016/S0304-3878(98)00044-3
Debevoise & Plimpton LLP. (2013). Private equity & venture capital in Latin America. BVCA Guides, 2(4) Retrieved from
http://www.bvca.co.uk/researchpublications/bvcaguides.aspx
Dixit, A. (2001). Internationalization strategies of private equity firms. The Journal of Private Equity, 5(1), 40-54. doi:10.3905/jpe.2001.319999
European Banking Authority. (2014). Report on impact of differences in leverage ratio definitions. EBA Leverage Ratio Analytical Report, 2(1) Retrieved from
https://www.eba.europa.eu/documents/10180/534414/EBA+-+Leverage+ratio+analytical+report.pdf