THE RELATIONSHIP BETWEEN HOP BIOMECHANICS, FUNCTIONAL PERFORMANCE, AND TALAR CARTILAGE DEFORMATION IN HEALTHY INDIVIDUALS
Devon Nicole Stroup
A thesis submitted to the faculty at the University of North Carolina at Chapel Hill in partial fulfillment of the requirements for the degree of a Master of Arts in the department of Exercise
and Sports Science at the University of North Carolina at Chapel Hill.
Chapel Hill 2019
Approved by:
Erik Wikstrom
Brian Pietrosimone
iii ABSTRACT
Devon Nicole Stroup: The Relationship Between Hop Biomechanics, Functional Performance, and Talar Cartilage Deformation in Healthy Individuals
(Under the direction of Erik Wikstrom)
Lateral ankle sprains are a very common injury in sport, however often go
underreported and mismanaged. This leads to a cascade of events including chronic ankle
instability (CAI) development. People with CAI often exhibit altered biomechanics, as well as
degenerative joint changes when compared to healthy individuals that can lead to
post-traumatic osteoarthritis (PTOA). It is unknown if biomechanics are linked to cartilage
deformation, which stands as a sensitive marker for joint health and PTOA development.
Research is also limited in ultrasound sensitivity to talar cartilage deformation after loading.
Before identifying this relationship and establishing ultrasound as a sensitive imaging technique
of deformation in pathologic individuals, we must first investigate healthy individuals.
Therefore, our overall purpose is to determine how talar cartilage deforms in healthy
individuals after a standardized single leg hopping loading protocol, and to explore how hop
iv
TABLE OF CONTENTS
ABSTRACT ... iii
LIST OF TABLES ... v
LIST OF ABBREVIATIONS ... vi
CHAPTER I: INTRODUCTION ... 1
CHAPTER II: REVIEW OF THE LITERATURE ... 4
Epidemiology ... 4
Lateral Ankle Sprain ... 4
Chronic Ankle Instability ... 5
Post-traumatic Osteoarthritis... 5
Biomechanical Alterations... 6
Measures of Joint Health ... 9
Cartilage Thickness ... 9
Cartilage Content ... 9
Cartilage Deformation... 11
CHAPTER III: METHODS ... 15
3.1 Research Design ... 15
3.2 Participants ... 15
3.3 Instrumentation ... 16
3.4 Procedures... 16
3.5 Statistical Analyses ... 20
CHAPTER IV: RESULTS ... 21
4.1 Demographics ... 21
4.2 Dependent T-Tests... 21
4.3 Correlations ... 22
CHAPTER V: DISCUSSION ... 27
Deformation Post-Loading ... 28
Biomechanical Correlates ... 30
Functional Performance ... 31
Limitations ... 33
Clinical Implications and Future Research ... 34
Conclusions ... 35
APPENDIX: DATA COLLECTION SHEET ... 36
v
LIST OF TABLES
Table 4.1: Means, Standard Deviations, and Effect Sizes……….22
Table 4.2: Average Change Scores and Percent Changes Pre- to Post-Loading………22
Table 4.3: Correlation Coefficients and P-values for Single Leg Hopping
Biomechanics vs. Cartilage Deformation………24
Table 4.4: Correlation Coefficients and P-values for LESS Jump Landing
Biomechanics vs. Cartilage Deformation………25
Table 4.5: Correlation Coefficients and P-Values for Functional
Performance vs. Cartilage Deformation ……….26
vi
LIST OF ABBREVIATIONS
ASIS Anterior Superior Iliac Spine
ATFL Anterior Talofibular Ligament
CAI Chronic Ankle Instability
CFL Calcaneofibular Ligament
IC Initial Contact
LAS Lateral Ankle Sprain
MRI Magnetic Resonance Imaging
OA Osteoarthritis
PTOA Post Traumatic Osteoarthritis
US Ultrasound
1
CHAPTER I: INTRODUCTION
Lateral ankle sprains are one of the most common injuries sustained during athletic
activities.1 It is estimated that more than 28,000 ankle sprains occur every day in the United
States.2 Although lateral ankle sprains have a high prevalence, the perception of the injury is
often seen as inconsequential.3 As a result, this injury goes significantly underreported and it is
estimated that as many as 55% of people who sustain an acute lateral ankle sprain do not seek
medical care.4 The benign perception of this injury perpetuates the negative sequela of events
that occur due to the injury being poorly managed.
Poorly managed lateral ankle sprains can result in a high recurrence of injury. It is
estimated that up to 74% of initial acute ankle sprains result in subsequent injury, residual
symptoms, and feelings of instability.5 Mechanical instability and functional instability due to
recurrent ankle sprains has been termed as chronic ankle instability (CAI) and can lead to many
negative consequences, including feelings of “giving way,” difficulty and apprehension on uneven
surfaces, and the possible presence of pain.6 Perhaps one of the most significant consequences
of CAI is the early degenerative changes in the joint due to unbalanced loading.7 It is estimated
that up to 78% of patients with long term CAI develop osteoarthritis (OA) beyond 10 years7, with
post-traumatic osteoarthritis (PTOA) representing 70% of all OA in the ankle.8
Degeneration of articular cartilage due to direct or indirect injury, or PTOA, is a significant
2
the result of previous injury to the joint, with the target population being at least 10 years
younger than those who develop primary ankle OA.9 Saltzman et al. found that the reported
degree of physical impairment in patients with ankle OA is equal to the impairment associated
with severe medical problems including congestive heart failure and end-stage kidney disease.10
In addition, ankle OA results in a large financial burden, accumulating around $12 billion in
associated costs annually in the United States.11 With its high prevalence, high cause of disability,
and high cost, lateral ankle sprains and the resultant sequelae (i.e. CAI and PTOA) present a major
health concern.
Another consequence that coincides with the negative sequela of ankle injury is altered
joint kinematics. Patients with CAI and early degeneration of the ankle joint have been shown to
possess altered kinematics that increase the ground reaction forces exerted through the ankle.12
As stated previously, early degenerative changes can be seen in the ankle joint due to altered
loading.7 Bischof et al. observed that patients with ankle instability possessed an increased peak
cartilage strain and an anteromedial shift in position of maximum strain of the talar articular
cartilage.13 Increased cartilage contact strain has been theorized to contribute to cartilage
damage.14 Although no direct links between altered kinematics and osteoarthritis have been
found, it is plausible to say that one might influence the other due to both being present in
patients with CAI, ankle cartilage degeneration, and PTOA.
One of the longstanding measures of joint health is cartilage behavior. Many studies have
looked at cartilage thickness, cartilage content, and cartilage deformation in the knee and ankle.
MRI methods are the gold standard for cartilage imaging, however they are very expensive and
3
identified cartilage deformation and thickness measures in the knee, and due to its success in the
knee it may be a good, cost-effective alternative tool to look at ankle joint cartilage health 15,16,17.
Before we can understand the effects of altered kinematics on cartilage deformation in
pathologic individuals, we must first define normal cartilage deformation in a healthy population
and understand how biomechanical alterations influence cartilage deformation. Therefore, the
overall purpose of this study is to explore how hop biomechanics, in healthy individuals, influence
talar cartilage deformation after a standardized single leg hopping loading protocol. To achieve
the overall purpose, we will answer the following research questions:
1. Does talar cartilage deform following a standardized hop protocol in healthy individuals?
Hypothesis: We hypothesize that the thickness measures of talar cartilage using
ultrasonography will significantly change immediately after a standardized hop protocol.
2. How do lower extremity biomechanical outcomes correlate to cartilage deformation
outcomes in healthy individuals?
Hypothesis: We hypothesize that sagittal plane joint angles and vertical ground reaction
forces during hopping will correlate with cartilage deformation.
3. How do functional tasks correlate to talar cartilage deformation outcomes in healthy
individuals?
Hypothesis: We hypothesize that functional task performance will correlate with cartilage
4
CHAPTER II: REVIEW OF THE LITERATURE Epidemiology
Lateral Ankle Sprain
Ankle injuries can be very serious and represent a prevalent health concern. Estimates
suggest that 28,000 ankle injuries occur every day in the US alone2, accounting for 20% of all
injuries treated in emergency facilities.1 Ankle sprains alone, which happen to be the most
common type of ankle injury, make up 10% of all emergency room visits in the United States.18
However, it is approximated that 55% of individuals who sustain an ankle sprain do not seek
medical care, and therefore injuries may be significantly underreported.4 In athletics, ankle
sprains are the highest reported injury, accounting for up to 45% of all athletic injuries.1 Lateral
ankle sprains in particular make up 85% of all ankle sprains.1 Risk factors predisposing someone
to lateral ankle sprains are divided into intrinsic and extrinsic categories. Intrinsic factors
include age, sex, height, body mass index (BMI), history of previous injury, fitness level, limb
dominance and girth, flexibility, muscle strength, proprioception, reaction time, postural
stability, anatomical alignment, foot morphology, and inadequate rehabilitation.19,20 Extrinsic
factors include specific sport and position, level of competition, shoe type, playing surface, and
the use of external restraints.21 However, history of previous ankle sprain presents as the best
predictor for recurrent ankle sprain.22
Due to the high prevalence of lateral ankle sprains, this injury poses a large financial
burden on afflicted individuals. A study by Shah et al.23 reported that on average, an
5
$1.1 billion in total yearly health care costs. However, this $1.1 billion only represents the
acute cost of emergency room visits, not acute management by family physicians or other
health care providers. On top of the cost, acute ankle sprains have been shown to lead to many
other consequences for the affected individual.
Chronic Ankle Instability
Research has shown that up to 74% of individuals with a previous history of ankle sprain
suffer from a negative sequela of residual symptoms, recurrent ankle sprains, and/or feelings of
instability long after the initial injury5, also termed chronic ankle instability (CAI).24 Just as acute
injury poses a significant financial burden, chronic joint injury is responsible for extensive
medical costs as well. It is estimated that up to 87% of all costs resulting from lateral ankle
sprains comes from future rehabilitation and therapy, time lost from work, and treatment for
long-term symptoms, all issues associated with CAI.23 If not treated appropriately, chronic
ankle instability may result in chronic pain, chronic and pathological adaptations, osteochondral
lesions of the talus, and premature osteoarthritis.25
Post-traumatic Osteoarthritis
Post-traumatic osteoarthritis (PTOA) stands as one of the biggest contributors to long
term disability.26 Osteoarthritis (OA) is the most frequent cause of rheumatic complaints27, and
PTOA represents 70% of all foot and ankle osteoarthritis.8 PTOA is a result of an injury to the
joint27, such as an ankle sprain28, as a result of overuse, overload, or damage of other joint
tissues.29 The disease then manifests, slowly degenerating the articular cartilage over time.
Symptoms of ankle PTOA include pain in the talocrural joint line, limited range of motion, and
6
10 years.31 Unlike joint degeneration in the knee and hip, PTOA in the ankle tends to occur in
younger patients30, and results in faster functional loss, with end stage disease progression
reaching its height within 10 to 20 years after the start of the lesion.32 According to Bischof et
al., damage to the anterior talofibular ligament and calcaneofibular ligament during an acute
ankle sprain may be associated with the development of PTOA.13 In a study conducted by
Valderrabano et al., researchers found that in a group of 247 consecutive patients treated for
ankle arthritis, lateral ligament damage was the primary contributor to the development of
ligamentous PTOA.14 PTOA in the ankle generates insurmountable associated costs due to the
disability it creates. In the United States alone, PTOA is responsible for over $3 billion in direct
health care expenses11,28, and over 12 billion in total related costs.11 Overall, the negative
sequela from acute ankle sprains and chronic ankle instability to ankle joint degeneration and
PTOA are shown to be very common, very expensive, and very difficult to treat, leading to
significant long-term disability.
To fully understand what needs to be done to help treat and prevent this progressively
degenerative condition, we must first understand the contributing factors and the
pathophysiology of ankle PTOA to understand what needs to be addressed and eventually
mitigate the long-term disability caused by this disease.
Biomechanical Alterations
Altered kinematics have been shown to be present in people affected by ankle joint
pathology and degeneration, and have long been associated with the etiology of OA.26 During
the normal gait cycle, people with CAI have been shown to have a lower walking velocity, lower
7
exhibit increased inversion, lateral shift of body weight, increased hip flexion during terminal
swing to mid stance, reduced hip extension, increased knee flexion during terminal stance to
initial swing, and slower weight transfer at the beginning and end of the stance.34,35 Individuals
with perceived instability produce compensatory altered gait kinematics in order to complete
dynamic tasks, and these alterations reflect deficits caused by their instability.33,34 These
compensatory mechanisms during gait contribute to higher vertical ground reaction forces and
loading rates. In a study conducted by Bigouette et al., authors found that among individuals
with CAI, impact peak forces, average loading rates, and active peak forces were all higher
when compared to healthy individuals during running because of altered kinematics.12 As seen
in a study conducted by Bischof et al., individuals with CAI exhibited greater cartilage contact
strains when compared to healthy ankles, and these areas of greater strain corresponded to the
region of talar cartilage where OA was clinically observed.13 However, no correlations between
peak vertical ground reaction forces and increased cartilage contact strains have been
established.
Deficits have also been shown during dynamic landing tasks, which is a functional
movement performed in many sports.36 During landing, individuals with CAI exhibit a lower
angle of eversion and abduction in the ankle joint than healthy individuals.37 It has been shown
that increased eversion and dorsiflexion in the ankle may be associated with shock absorption
strategies that reduce vertical ground reaction forces.37 Individuals with CAI alter their
mechanics to offset instability, however this compensatory movement in turn reduces shock
absorption. In a study done by Lee et al., athletes with CAI were shown to have a reduced
8
drop landing when fatigue was induced in both groups.37 In this study, CAI participants also
displayed lower eccentric work of the knee.37 This study showed that CAI individuals have
higher dependence on their ankle than controls in post-fatigue drop landing, which may
increase their risk of recurrent ankle injury and perpetuate the negative sequela of ankle joint
injury and degeneration.37 In addition, these authors suggest that participants with CAI have a
decreased ability to control impact forces from single-leg drop landing due to altered landing
strategies after induced fatigue, which may increase their risks of potential injury in the ankle
joint.37 Other studies have shown that altered biomechanics from injury put an individual at risk
for progressive joint degeneration.21,38 Goreham-Voss et al. found that abnormal loading
associated with injury and instability resulted in increased peak stresses and loading rates on
the articular cartilage when looking at cadaveric ankles.39 Cartilage loading rates over 25 MPa/s
have been shown to cause cell death, and in this study all ankles exceeded this loading rate
except for the fully in-tact model, representing a healthy ankle.39 Altered loading has also been
thought to contribute to the development of chondral lesions and arthritis and be detrimental
to cartilage health.14,21 Bischof et al. found that individuals with CAI possess an increased peak
cartilage strain and an anteromedial shift in position of maximum strain in the talus,
perpetuating cartilage damage sustained during the initial injury.13 Ultimately, altered contact
strains due to altered kinematics could contribute to cartilage degeneration and the
development of ankle OA.13 Although no direct link has been observed between altered
kinematics and altered cartilage activity, both have been seen in individuals with CAI and ankle
9
differences in cartilage activity when comparing healthy cartilage to pathologic cartilage,
cartilage has been used to measure the status of an individual’s joint health.
Measures of Joint Health Cartilage Thickness
In a normal, healthy ankle, ankle cartilage thickness ranges from less than 1 to 2mm and
has a contact area of 350mm2 in load bearing areas. 40 Ankle cartilage is much thinner than that
of the knee and hip, and also has a smaller cartilage contact area, which results in higher forces
per area when the lower extremity is loaded.40 However, due to the compositional differences
in ankle cartilage compared to knee cartilage, the tissue responds differently to loading and has
been shown to resist degradation at higher rates than knee articular cartilage, possibly
accounting for the lower prevalence of ankle OA.40 Several studies have looked at cartilage
contact strains in healthy individuals using MRI. MRI has been labeled as the gold standard for
assessing knee cartilage thickness41, and has been used in studies to look at ankle cartilage
thickness.42 MRI allows for the visualization of intraarticular pathologies that are not evident
on plain radiography43, and is the best tool for looking at deep chondral and subchondral
lesions.44
Cartilage Content
Understanding cartilage composition is also critical to understanding potential
mechanisms and behaviors that can represent early biomarkers for OA. Articular cartilage
consists of chondrocytes and an extracellular matrix composed of collagen, water, and
proteoglycans.45 The combination of water (fluid phase) and the dense collagen and
proteoglycans (solid phase) of the extracellular matrix allows articular cartilage to efficiently
10
The fluid phase provides the matrix with the ability to dissipate load and the hydraulic pressure
within the fluid phase provides very important load support and protects the solid phase from
significant stresses.45 The collagen and proteoglycans resist compression, and in normal
articular cartilage proteoglycans are arranged in such a way to maintain a porous-permeable
solid matrix.45 However, OA has been directly linked to the loss of proteoglycan content.45 In
OA cartilage, there is a breakdown of the proteoglycan structure, leading to a more penetrable
solid matrix.45 This increased permeability leads to a decrease in the hydraulic pressure and
causes a decrease in compressive stiffness, thereby increasing the stress from loading.45
Two types of compositional MRI are T2 and T1ρ mapping, which have been used to
assess articular cartilage properties. T2 and T1ρ mapping techniques are relatively new
methods for the compositional examination of articular cartilage.46 T2 mapping identifies the
water content and collagen fiber status of articular cartilage.43,44 An increase in T2 relaxation values can be seen as a biomarker for early cartilage damage and destruction of the collagen
fiber network.47 T1ρ relaxation time is sensitive to changes in proteoglycan content in the
articular cartilage and increased relaxation times represent less proteoglycan content.43 In the
knee, studies have shown that increased T2 and T1ρ relaxation times are positively correlated
with the severity of OA.48,49
In the ankle, disparities in T2 values have been shown to exist in pathologic individuals
when compared to healthy participants. A study conducted by Golditz et. al found that
individuals with classified functional ankle instability showed uneven loading in the ankle and a
significant increase in T2 values when compared to controls.47 Another study conducted by Lee
11
(ATFL) had increased T2 values at the medial anterior, lateral anterior, and lateral center
compartments of their talar cartilage when compared to individuals with an intact ATFL.50 As
ligamentous injury may stand as a predisposing factor to the development of PTOA in the
ankle13, this study lends insight into the correlation between ATFL injury and cartilage
degeneration.50
As for T1ρ methods, research has shown that individuals with CAI have higher T1ρ
relaxation times compared to healthy individuals.51 Research has also shown that greater T1ρ
relaxation times, meaning less proteoglycan density, positively correlate with greater talar
cartilage thickness attributed to increased water content (swelling) from cartilage breakdown in
individuals with CAI.52 However, most MRI methods, including T2 and T1ρ mapping, are
expensive, not available to all patients at all times, and not easily available for consecutive
measurements of cartilage status.16
Cartilage Deformation
Understanding cartilage deformation is crucial to developing an understanding of
cartilage function and biomechanical factors that may relate to cartilage degeneration.53 Many
studies have identified relative cartilage thicknesses in response to loading, and most studies
have focused on examining cartilage thickness in the knee. Measures of cartilage thickness
using MRI provides an estimate of overall cartilage structure, however it is not the most
sensitive marker for OA development.54 In the earliest stages of OA, there is a change in
cartilage composition without significant declines in cartilage thickness.54 Therefore,
identifying the response of cartilage structure, or cartilage deformation, to acute loading has
12
cartilage composition determines how cartilage deforms.55,56 Most research involving the
examination of cartilage deformation and recovery rate after activity has been conducted at the
knee. In the healthy knee, research has shown that cartilage deformation occurs at similar
magnitudes during walking and running conditions.15 In contrast, during a small frequency,
high amplitude drop landing task which comprised of 100 vertical drops in 30 minutes, cartilage
deformation was significantly lower when compared to a running task.56
In a study by Li et al.53, researchers examined healthy human ankle joint articular
cartilage deformation using MRI under different constant loads while standing. They found that
the cartilage deformation rate reached a peak value at the first second after loading, and
continued to increase until about 50 seconds of constant loading. However, after about one
minute of loading, the deformation rate dramatically decreased and the cartilage deformation
and contact area remained at a relatively constant high. The authors explained that at initial
contact, the contact area was small so the rate of peak cartilage deformation was high.
However, as the joint continued to increase contact area, there was a resultant decrease in
deformation rate.53
In a study conducted by Van Ginckel et al., researchers examined ankle cartilage
deformation using MRI during an in vivo exercise task of 30 closed kinetic chain knee bends in
one minute reaching maximal dorsiflexion in healthy individuals.26 After the in vivo exercise
task, authors found significant deformation in talar cartilage, and the cartilage recovered within
30 minutes post-exercise.26 However, no current studies have examined talar cartilage
13
As stated previously, MRI methods are expensive and not easily accessible.16 Ultrasound
(US) has become a recent method of great interest in quantifying pathologic cartilage in the
kneedue to ease and low cost, accessibility and good reproducibility.15,16,17 In a study
conducted by Schmitz et al. that compared the use of US to MRI imaging techniques, ultrasound
cartilage thickness measures in the knee were significantly positively correlated with MRI
thicknesses.16 In another study conducted by Harkey et al. that looked at ultrasound as a tool
for identifying medial femoral cartilage deformation, authors found that US imaging is sensitive
to medial femoral cartilage deformation immediately following walking and running in healthy
individuals.15 Overall, US appears to be beneficial to the researcher and clinician due to lower
cost, greater availability, and access compared to MRI techniques.16 Although US has not been
extensively used to look at talar cartilage deformation, due to its success in the knee it may be a
sensitive, cost-effective alternative tool to look at ankle joint cartilage health.
In conclusion, the sequela of events leading to PTOA is detrimental. Being able to identify
predisposing factors and early biomarkers of the disease, including altered biomechanics and
cartilage behavior, will allow us to eventually find early intervention methods to decrease the
negative impact PTOA has on individuals. Many studies have looked at static weight bearing,
walking and running to evaluate cartilage deformation and recovery rate. However, the
literature is lacking in highly dynamic tasks, such as jump landing and hopping. Single limb landing
is a common functional task in sport, and a very common mechanism for ankle injury.36 When
people return to their sport, jumping and single/double leg landing is often the mechanism for
recurrent ankle sprain leading to development of CAI36, which is known to be a predisposing
14
pathologic patients looks like during a functional landing/hopping task, we must first understand
how functional landing/hopping affects healthy cartilage deformation. Therefore, the purpose of
this study is to identify the biomechanics and deformational behavior of talar articular cartilage
in healthy individuals after a dynamic single limb hopping task. These results will lend themselves
as a basis for future studies looking at altered kinematics and cartilage deformation in the
15
CHAPTER III: METHODS
3.1 Research Design
This descriptive laboratory study seeks to identify if talar cartilage deforms after a single
leg hopping task, how hop and jump biomechanics correlate with talar cartilage deformation,
and how performance on functional tasks correlate with talar cartilage deformation. The
independent variable for research question 1 is time. There are no independent variables for
research questions 2 or 3 as it is a correlation study. Talar cartilage deformation is a dependent
variable for all questions. Hop and jump biomechanics are dependent variables for question 2,
and performance on the functional tasks is a dependent variable for question 3.
3.2 Participants
Participants in the study consisted of thirty healthy, physically active individuals and we
recruited them in person or via email. Inclusion criteria for this group consisted of being
between 18-35 years of age, no previous history of lower extremity ligamentous injury, no
chronic ankle instability or balance disorders, no history of lower extremity surgery, no history
of concussion or head injury in the past six months, no history of cardiac condition or stroke,
not currently pregnant, and individuals who are recreationally active (i.e. participate in at least
3, 30 minute sessions of physical activity per week). Exclusion criteria consist of failing to meet
16 3.3 Instrumentation
The instruments used in this study included the VICON Motion Capture System (VICON,
Oxford Metrics, Oxford, UK),Bertec force plates, and a Phillips Lumify portable ultrasonography
system on a Microsoft tablet. The motion capture system included 10 high-speed VICON
cameras synchronized with three force plates57 positioned within the center of the capture
volume. Kinematic data were collected at a sampling frequency of 120 Hz. Kinetic data were
collected at a sampling frequency of 1200 Hz and low-pass filtered at 75 Hz. We placed
retroflective markers placed on the acromion processes, sternal notch, sacrum, anterior
superior iliac spines (ASIS), greater trochanters, mid-thighs, lateral and medial femoral
condyles, tibial crests, lateral and medial malleoli, calcanei, and first and fifth metatarsals of
each participant. We used ultrasonography to capture the cross-sectional area of the talar
cartilage. A Phillips Lumify portable ultrasonography system captured images at a frequency of
25 Hz, gain of 50, and depth of 3.0 cm.
3.4 Procedures
This study was conducted over the course of two, 75-minute sessions. As part of a larger
study, participants completed a survey to determine eligibility as control subjects. After
determining eligibility, participants read and signed the university approved informed consent
form. We then recorded the the participants’ age, height, and weight. We also asked
participants, “if you were to kick a soccer ball, which foot would you use?” Participants then
performed all tasks on their chosen limb. During the first session, participants performed
17
Second, we completed a biomechanical analysis of the subject. Participants changed
into spandex shirts and shorts and completed a static standing trial by standing with feet
shoulder width apart and arms across his or her chest after being marked with the
aforementioned anatomical markers. Using Visual3D software, we created a kinematic model
of the pelvis, thigh, shank, and foot from the static trial.57 Then, the subject completed a series
of single leg hopping and jump landing for biomechanical analysis. For each assessment,
participants completed a series of 3 practice trials to familiarize themselves with the task. For
the single leg hop, the participant was positioned 24 inches away from the force plate. They
jumped from his or her chosen limb onto the center of the right force plate, landing on the
same limb, and stabilizing for roughly two seconds. They completed this task a total of 5 times.
Next, participants completed 5 jump landings from a twelve-inch box onto the force plates.
Participants completed both tasks with simultaneous biomechanical analysis using the VICON
System. Participants then had the markers removed.
Additionally, participants completed four functional tests including the side hop test, the
figure-of-8 test, the single leg hop test, and the crossover hop test on their chosen limb. For the
side hop test, we instructed participants to hop on the chosen limb laterally over a 30-cm
distance. Hopping laterally 30 cm and back to the starting location constituted 1 repetition, and
each participant completed 10 repetitions as fast as possible. A repetition was only successful if
the participant’s foot landed outside of the 30-cm distance marked by tape. For the figure-of-8
hop, participants completed single leg hops in a figure-8 pattern, twice around a 5-meter
course marked by cones as fast as they could. We recorded both tests to the nearest 10th of a
18
over a 15cm wide strip marking on each hop and maintain landing after the 3rd hop for 2
seconds. The participant had to maintain stabilization at the end of the trial to be considered a
successful trial the first of the 3 hops is lateral with respect to the direction of the crossover.
The participants completed 3 successful trials and the best of the 3 was recorded. Lastly, the
single limb hop for distance required the participant to stand on one limb and hop as far
forward as possible, landing on the same limb along a 15-meter strip. To be a successful trial,
the participant had to maintain stabilization for 2 seconds. The participant completed 3
successful trials and the best of the 3 trials were recorded. We recorded both tests to the
nearest 10th of a centimeter58. We randomized the order of task completion for each
participant to minimize the influence of fatigue on performance.
Participants then returned for a second session for cartilage deformation analysis.
Participants sat in a long-sit position for one hour to unload the cartilage of the ankle. 15 We
measured knee and ankle joint angles at 140 degrees for optimal image capture. As part of a
larger study, we took images of the ankle and knee using the Lumify ultrasound system at
15-minute increments. At the end of the one hour unloading period, we captured another set of
ultrasound images of the knee and ankle by placing the probe longitudinal to the joint line and
rotating to best show the articular cartilage image.15,27,51
Participants then placed their shoes back on, were seated in a chair, and rolled in a chair
to align themselves with the starting position of the hop loading protocol. The loading protocol
consisted of a total of 60 single-leg hops on their chosen limb. We instructed participants to
stabilize each hop for about 2 seconds. Participants hopped 12 times in one direction across
19
this 5 times for a total of 60 hops, with each hop being about 28 inches in distance. If
participants lost balance, we allowed the participant to place his or her other foot down to help
regain their balance before returning to a single limb stance as quickly as possible. At the
completion of the 60th hop, participants were seated in the chair again, and rolled back to the
table to have another series of talar cartilage images taken in a manner identical to the
pre-test.
We analyzed sagittal hip, knee, and ankle kinematics and vertical ground reaction force
kinetics. We extracted these variables using the VICON Nexus system and Visual3D Software.
We cropped all trials, confirmed and labeled the presence of all markers, and created body
segments in VICON. We then imported trials into Visual3D for biomechanical and kinetic
analysis. If needed, we used a fill technique before running the data through a custom written
MATLAB code.
We measured and analyzed cartilage images using ImageJ Software. Variables extracted
included lateral, medial, and overall area and length. We imported each image into ImageJ, set
the measuring scale to pixels/cm, and adjusted each picture to a 0 degree angle for uniform
analysis. First, we measured the overall length of the talar cartilage from medial peak to lateral
peak of the cartilage. We then marked the halfway, lateral edge and medial edge points using
the multi-point tool. We defined the lateral/medial regions as 50% between the middle of the
image and the lateral/medial “peaks.” We then measured lateral and medial areas by tracing
the outline of each segment of the cartilage with the polygon function on ImageJ. We defined
the lateral/medial area as the area from the middle point to the lateral/medial edge. We took
20
image). If needed, we adjusted outlines for precision. We calculated the overall area as the sum
of the lateral and medial areas. Finally, we measured the length of the lateral segment by
drawing a line to measure from one end of the traced area to the other end. We repeated the
process for the medial length, and measured an overall length once again. We measured and
analyzed a total of 3 pre-loading images and 3 post-loading images for each participant to get
average values. From these average values, we calculated lateral, medial and overall
normalized cross-sectional areas by dividing the respective pre- and post- area by width for
each segment for the statistical analysis.
3.5 Statistical Analyses
To achieve RQ1, we conducted three dependent T-tests to compare pre- to
post-deformation for lateral, medial, and normalized cross-sectional areas. Because values were not
normally distributed for RQ1, we conducted a non-parametric Wilcoxon Signed Ranks Test to
determine if cartilage deformed after a standardized hop loading protocol. In addition, we
conducted pre-to post Cohen’s d effect sizes and 95% confidence intervals. To achieve RQ2,
we conducted Pearson Product Moment Correlations among the specific peak vertical ground
reaction force (vGRF), biomechanical, and cartilage deformation measures. To achieve RQ3, we
conducted Spearman Correlations among the functional test scores and cartilage deformation
measures as well, due to values not being normally distributed. We set statistical significance to
21
CHAPTER IV: RESULTS 4.1 Demographics
Thirty healthy, recreationally active participants met the inclusion and exclusion criteria
for this study. There were twenty-three females and seven males included in the study.
Twenty-eight participants chose the right as his or her dominant limb, and two chose the left. The age,
height and weight of participants were 20.52±2.37 years, 170.39±8.63 cm, and 65.98±13.07 kg,
respectively.
4.2 Dependent T-Tests
For aim one, five out of the six values for cartilage thickness showed significance:
pre-lateral p<.05, pre-lateral p<.01, pre-medial p=.20, medial p<.05, pre-overall p<.05,
post-overall p<.05. These values indicate that the data are not normally distributed. Therefore, we
conducted a non-parametric Wilcoxon Signed Ranks Test to determine if cartilage deformed
after a standardized hop loading protocol. We found a statistically significant difference
between pre- and post-measures for lateral (p<.001), medial (p<.001), and overall (p<.001)
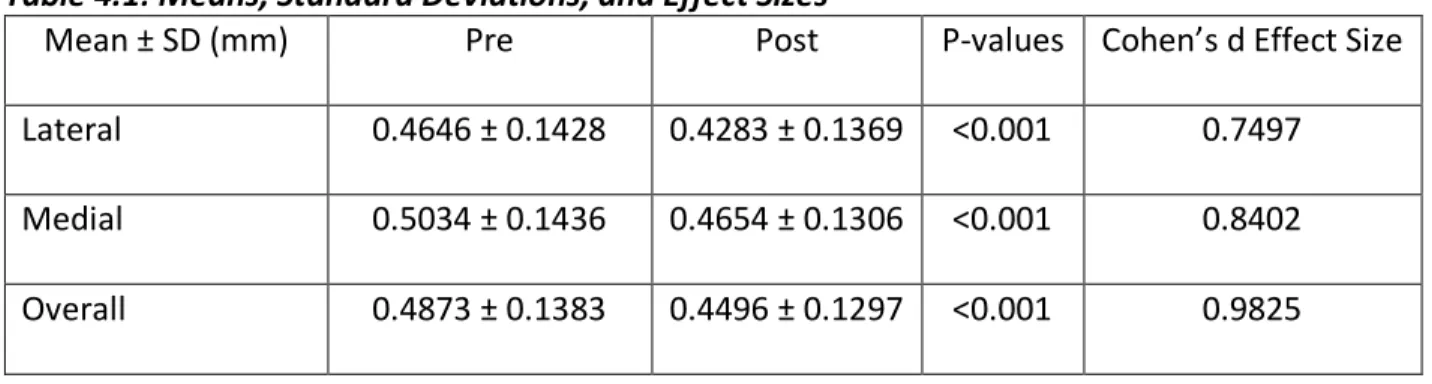
normalized cross-sectional areas. Means, standard deviations, and effect sizes can be found in
Table 4.1. Average change scores and percent changes pre- to post-loading can be found in
22
Table 4.1: Means, Standard Deviations, and Effect Sizes
Mean ± SD (mm) Pre Post P-values Cohen’s d Effect Size
Lateral 0.4646 ± 0.1428 0.4283 ± 0.1369 <0.001 0.7497
Medial 0.5034 ± 0.1436 0.4654 ± 0.1306 <0.001 0.8402
Overall 0.4873 ± 0.1383 0.4496 ± 0.1297 <0.001 0.9825
Table 4.2: Average Change Scores and Percent Changes Pre- to Post-Loading Average Change mm
(decrease) Percent Change % (decrease)
Lateral 0.0376 ± 0.0494 7.48%
Medial 0.0410 ± 0.0472 7.30%
Overall 0.0398 ± .0402 7.65%
4.3 Correlations
For aim two, we ran the Shapiro-Wilk Normality Test and the significance values
indicated that the variables were normally distributed, so we chose to run Pearson
product-moment correlations for these variables. All correlations and p-values between cartilage
deformation and single leg hopping and jump landing biomechanics can be found in tables 4.3
and 4.4.
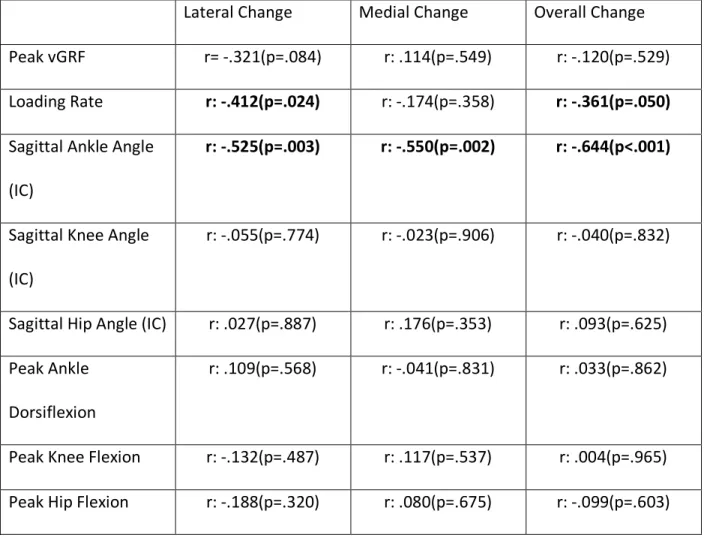
For single leg hopping biomechanics, there was a significant correlation between loading
rate and change in lateral cartilage thickness (r= -.412, p=.024). As loading rate decreased,
cartilage deformation increased. There were also significant correlations between sagittal ankle
angle at initial contact and changes in lateral (r=-.525, p=.003), medial (r= -.550, p=.002), and
overall (r= -.644, p<.001) thicknesses. As sagittal joint angle decreased, or as plantarflexion
23
significant correlations found between normalized peak vertical ground reaction force (vGRF),
sagittal knee and hip joint angles at initial contact, or peak joint angles and changes in cartilage
thickness.
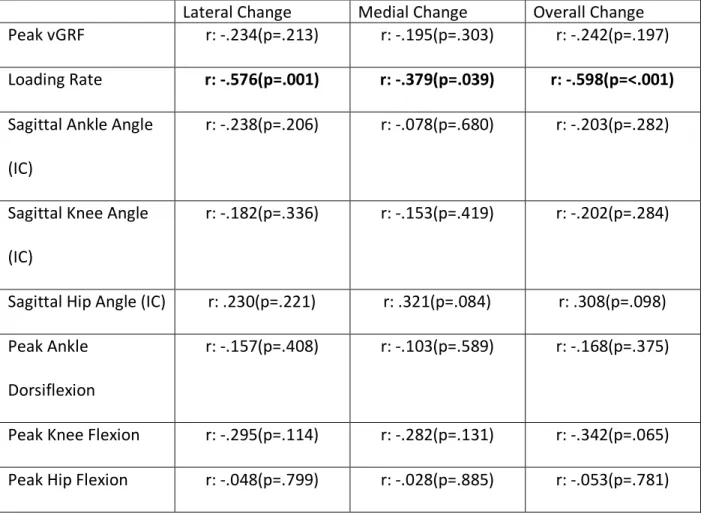
For jump landing, there were significant correlations between loading rate and changes
in lateral (r=-.576, p=.001), medial (r=-.379, p=.039), and overall (r=-.598, p <.001) thicknesses.
As loading rate decreased, cartilage deformation increased. There were no statistically
significant correlations found between normalized peak vGRF, sagittal joint angles at initial
24
Table 4.3: Correlation Coefficients and P-values for Single Leg Hopping Biomechanics vs. Cartilage Deformation
Lateral Change Medial Change Overall Change
Peak vGRF r= -.321(p=.084) r: .114(p=.549) r: -.120(p=.529)
Loading Rate r: -.412(p=.024) r: -.174(p=.358) r: -.361(p=.050)
Sagittal Ankle Angle
(IC)
r: -.525(p=.003) r: -.550(p=.002) r: -.644(p<.001)
Sagittal Knee Angle
(IC)
r: -.055(p=.774) r: -.023(p=.906) r: -.040(p=.832)
Sagittal Hip Angle (IC) r: .027(p=.887) r: .176(p=.353) r: .093(p=.625)
Peak Ankle
Dorsiflexion
r: .109(p=.568) r: -.041(p=.831) r: .033(p=.862)
Peak Knee Flexion r: -.132(p=.487) r: .117(p=.537) r: .004(p=.965)
25
Table 4.4: Correlation Coefficients and P-values for LESS Jump Landing Biomechanics vs. Cartilage Deformation
Lateral Change Medial Change Overall Change
Peak vGRF r: -.234(p=.213) r: -.195(p=.303) r: -.242(p=.197)
Loading Rate r: -.576(p=.001) r: -.379(p=.039) r: -.598(p=<.001)
Sagittal Ankle Angle
(IC)
r: -.238(p=.206) r: -.078(p=.680) r: -.203(p=.282)
Sagittal Knee Angle
(IC)
r: -.182(p=.336) r: -.153(p=.419) r: -.202(p=.284)
Sagittal Hip Angle (IC) r: .230(p=.221) r: .321(p=.084) r: .308(p=.098)
Peak Ankle
Dorsiflexion
r: -.157(p=.408) r: -.103(p=.589) r: -.168(p=.375)
Peak Knee Flexion r: -.295(p=.114) r: -.282(p=.131) r: -.342(p=.065)
Peak Hip Flexion r: -.048(p=.799) r: -.028(p=.885) r: -.053(p=.781)
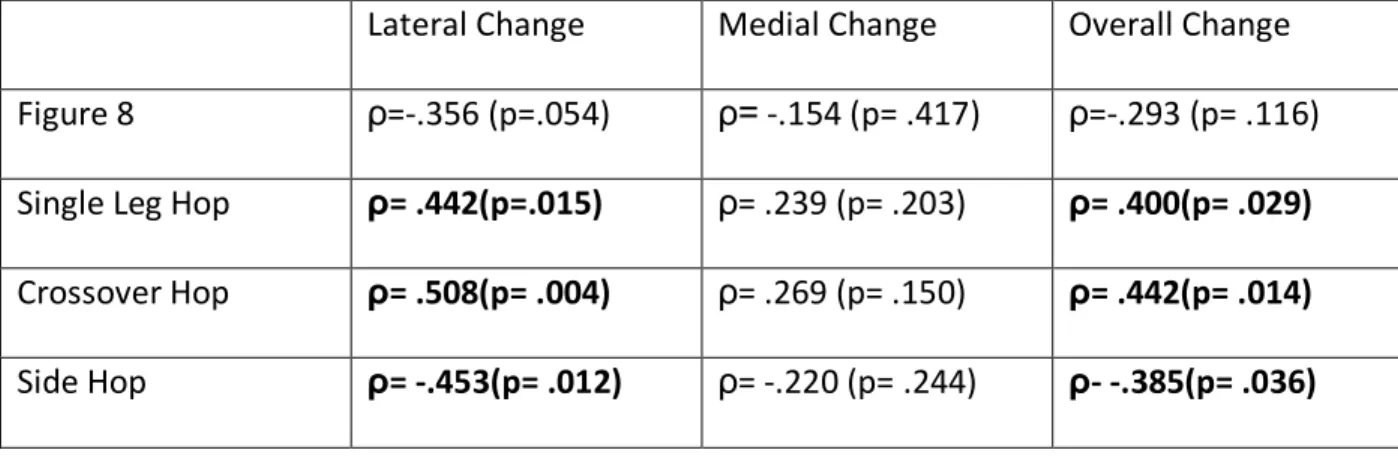
For aim three, normality tests showed significance values that indicated data were not
normally distributed. Therefore, we conducted Spearman’s rank correlations to determine a
relationship between functional hop test performance and changes in cartilage thickness after a
standardized hop loading protocol. Table 4.5 shows Spearman correlation values and
significance levels. There was a statistically significant correlation between single leg hop
distance and changes in lateral (ρ=.442, p=.015), and overall (ρ=.400, p=.029) thicknesses. As
hop distance increased, cartilage deformation increased. There was a statistically significant
26
(ρ=.442, p=.014) thicknesses. As hop distance increased, cartilage deformation increased.
Lastly, there was a statistically significant correlation between side hop time and changes in
lateral (ρ=-.453, p=.012), and overall (ρ=-.385, p=.036) thicknesses. A decrease in side hop test
time is correlated with an increase in cartilage deformation. There was no statistically
significant correlation between the figure 8 hop test and lateral, medial or overall normalized
cross-sectional area deformation. There was no statistically significant correlation between any
of the functional performance tests and the medial normalized cross-sectional area
deformation.
Table 4.5 Correlation Coefficients and P-Values for Functional Performance vs. Cartilage Deformation
Lateral Change Medial Change Overall Change
Figure 8 ρ=-.356 (p=.054) ρ= -.154 (p= .417) ρ=-.293 (p= .116)
Single Leg Hop ρ= .442(p=.015) ρ= .239 (p= .203) ρ= .400(p= .029)
Crossover Hop ρ= .508(p= .004) ρ= .269 (p= .150) ρ= .442(p= .014)
27
CHAPTER V: DISCUSSION
The purpose of this study was multi-faceted. The first aim of this study was to determine
whether or not talar cartilage deformed after a standardized hop loading protocol in healthy
individuals. The second and third aims were to determine if there was a relationship between
1) lower extremity biomechanics and talar cartilage deformation, and 2) functional
performance and talar cartilage deformation. We hypothesized that 1) talar cartilage would
deform after a standardized hop loading protocol, 2) lower extremity biomechanics would
correlate with talar cartilage deformation, and 3) functional task performance would correlate
with talar cartilage deformation. We found statistically significant differences between pre- and
post-thickness measures in lateral, medial and overall areas of the measured talar cartilage
images. This indicates that healthy talar cartilage does in fact deform following a hop loading
protocol and supports our a priori hypothesis. We also found significant correlations between
plantar flexion angle at initial contact during a single leg hopping task and talar cartilage
deformation, and between loading rate and lateral cartilage deformation. Additionally, we
found significant correlations between loading rate during a jump landing task and talar
cartilage deformation. These findings support our a priori hypothesis. Lastly, we found
statistically significant correlations between three of the four functional performance tasks and
28 Deformation Post-Loading
Mechanical loading is believed to play a pivotal role in maintaining joint health.59 In the
knee, healthy articular cartilage deforms in response to mechanical loading, and due to the low
permeability of the articular cartilage matrix, time is required for the cartilage to restore itself
to an unloaded state.60 This is why measurements of relative cartilage thickness after loading
have been used as a measure of joint health. In the earliest stages of OA, there is a change in
cartilage composition without significant declines in cartilage thickness.54 Therefore,
identifying the response of cartilage structure, or cartilage deformation, to acute loading has
been thought to provide a more accurate surrogate measure of cartilage composition, because
cartilage composition determines how cartilage deforms.55,56 Thus, we would anticipate that
talar cartilage would deform following mechanical loading.
Research has shown substantial cartilage deformation in healthy individuals after
different in vivo impact conditions using MRI analysis techniques.26,61 In a study conducted by
Van Ginckel et. al. researchers investigated percent change of talar cartilage deformation after
performing 30 bilateral knee bends in 12 healthy individuals using MRI.26 They analyzed the 3D
images pre-loading, as well as at 4 time points post-loading and determined a 10.41% average
volume decrease immediately after loading. In a follow up study, the authors61 used 13 healthy
individuals to complete 4 different in vivo tasks and again quantified cartilage deformation
using 3D MRI. Tasks included 30 bilateral knee bends, 30 unilateral knee bends, 2-minute
unilateral stance, and 10 single leg drop jumps which corresponded to an 8.3%, 7.7%, 14.6%,
and 12.5% decline in cartilage volume respectively. Their research suggests that static loading,
29
To date, there is limited research to demonstrate that US is capable of quantifying
cartilage deformation following a loading protocol in general 15,62,63,64 and no studies
demonstrating this ability at the ankle. However, research has demonstrated the validity of US
based measures of cartilage morphology. Schmitz et al. noted that ultrasound cartilage
thickness measures in the knee were significantly positively correlated with MRI thickness
measures.16 Further, research has demonstrated femoral cartilage deformation using US based
thickness measures following a variety of dynamic loading protocols.15,62,63 Consistent with the
existing literature, we showed a 7.65% mean decrease in overall normalized cross-sectional
area following a dynamic hop protocol using US based measures. Thus, our results demonstrate
that US can capture comparable talar cartilage deformation in healthy individuals as a more
sensitive MRI analysis. This suggests that US may be a suitable tool to assess cartilage behavior
in a more clinical setting.
Research to date consistently demonstrates cartilage deformation following loading but
the magnitude of difference varies slightly (~2-5%). Differences could be attributed to types of
loading, duration of loading, and the use of ultrasound vs. MRI. However, the relatively small
differences between studies further supports the claim that ultrasound imaging could be a
clinical surrogate of MRI in measuring talar cartilage health metrics. Future research should
focus on determining reliability and reproducibility of ultrasound imaging specifically in the
ankle, as well as if US is sensitive to differences in deformation between healthy and pathologic
30 Biomechanical Correlates
Our study examined relationships between various biomechanical outcomes and
cartilage deformation magnitude. Previous research has suggested that healthy individuals may
exhibit greater plantarflexion at initial contact because this allows for contact forces to be
distributed through a greater range of motion and allow for reduction of force.65 Caufield and
Garrett also found that healthy individuals exhibit greater plantarflexion during landing.66
Similarly, static (i.e. sustained) loading elicits greater cartilage deformation59, as it is associated
with lower loading rates. Lower loading rates, because of greater plantar flexion positioning at
IC, appears to result in greater deformation of the talar cartilage.
Cumulatively, these results make intuitive sense. Healthy individuals are able to
modulate impact forces (i.e. lower loading rates via greater plantar flexion) which increase
cartilage strain. While this may seem like a negative result, it is important to remember that
cartilage deformation is also a force absorption technique in the body and greater deformation
is an appropriate physiologic response in this situation. This complex interaction is likely the
reason why positive correlations among lower loading rates, greater plantar flexion at IC, and
greater cartilage deformation magnitude were observed in our healthy sample.
While associations were noted with IC plantar flexion during a hop task, no such
association was noted for IC plantar flexion during the jump landing task. This may be due to
the nature of the loading protocol used. The single leg hop task mimicked our loading protocol,
whereas the double leg jump landing did not. This may be particularly important for future
research and clinical stress tests as it appears that only biomechanical profiles representative of
31
hypothesis and determine how gait biomechanics influence cartilage deformation following
walking and how jump landing biomechanics influence cartilage deformation following a jump
landing loading protocol.
Interestingly, no significant correlations were found between IC sagittal knee or hip joint
angles in either task and cartilage deformation magnitude. Research has shown that healthy
individuals have more variability in hip and knee flexion during single leg jumping prior to IC and
through stance phase.67 Thus the lack of associations may be due to a more variable kinematic
pattern of the proximal joints within a healthy population. Similarly, no significant correlations
between peak joint measures or vertical ground reaction forces and cartilage deformation
magnitude were noted. Because we saw correlations between loading rates but not peak joint
angles, this may support the notion that loading rate is more important to cartilage behavior
than overall load or an overall peak joint angle. However, this remains largely speculative due
to lack of studies looking specifically at peak joint angles during dynamic tasks, which makes it
difficult to draw conclusions about whether or not there may be a relationship to cartilage
deformation magnitude. If rate of movement is in fact more important than overall movement
in the joint when examining the way cartilage deforms, this could also explain the lack of
associations among peak vGRF and cartilage deformation magnitude in our sample of healthy
individuals. Future research is needed to confirm our initial results and better determine the
roles of peak force and joint angle versus loading and movement rates.
Functional Performance
Our study found that as performance improved in certain functional tasks, there was
32
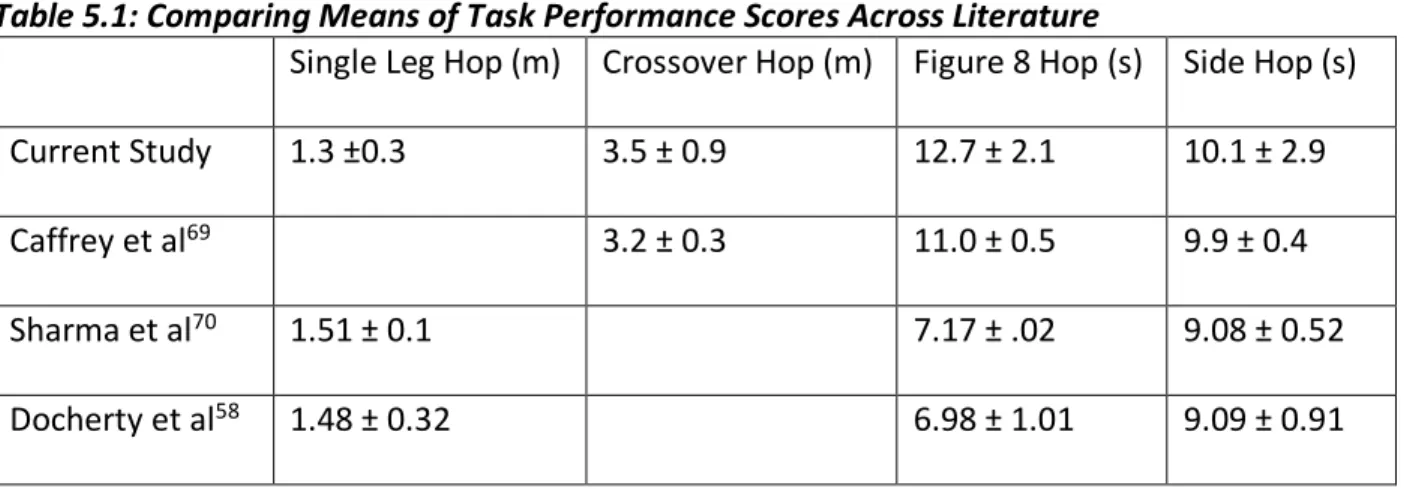
previously reported means on the tasks in question to demonstrate the generalizability of our
results within a young adult healthy population. With the exception of the figure 8 hop test,
our mean functional performance scores are very similar to those found in previous studies
observing healthy individuals, which supports that our sample is representative of a healthy
population.
Table 5.1: Comparing Means of Task Performance Scores Across Literature
Single Leg Hop (m) Crossover Hop (m) Figure 8 Hop (s) Side Hop (s)
Current Study 1.3 ±0.3 3.5 ± 0.9 12.7 ± 2.1 10.1 ± 2.9
Caffrey et al69 3.2 ± 0.3 11.0 ± 0.5 9.9 ± 0.4
Sharma et al70 1.51 ± 0.1 7.17 ± .02 9.08 ± 0.52
Docherty et al58 1.48 ± 0.32 6.98 ± 1.01 9.09 ± 0.91
Stated previously, we found that better functional performance and loading rates
correlate with greater deformation magnitude in the lateral and overall aspects of the cartilage
in our healthy sample. These correlations may mean that these functional tasks could serve as
sensitive cartilage stress tests. From a clinical perspective, this could mean that clinicians could
establish baseline functional movement performances of patients and potentially identify
individuals who are at risk of altered cartilage loading, which has been linked to early
degenerative changes in the joint.7 Functional performance is a more bedside tool than
biomechanical outcomes. Eventually, these stress tests may allow clinicians to initiate
preventative rehabilitation programs to improve functional performance and mitigate the
33
Our study found that better functional performance and lower loading rates correlate
with greater cartilage deformation magnitude. Intuitively, one may think that better
performance, i.e. jumping farther and faster, is likely to lead to higher impact forces and higher
loading rates, which has been observed in the CAI population during landing. This contradicts
our findings. If true, then better functional performance should have resulted in less cartilage
deformation. Thus, we hypothesize that healthy individuals who perform better may have
performance strategies that allow them to better attenuate force and lower loading rates.
Better performance in healthy individuals may be due to better, more adaptive neuromuscular
and sensorimotor landing strategies that could also be advantageous for cartilage health. The
assessment of these neuromuscular strategies was beyond the scope of this investigation but
should be an area of future research.
Limitations
There were several limitations in this study. For example, the subjects recruited were
self-reported as healthy and recreationally active, which could result in self reporting bias. Our
sample was also heavily female and right-limb dominant, which may not be representative of
the larger population. Additionally, the assessor was not blinded to whether or not the cartilage
images were pre or post loading. We also only looked at the ankle cartilage immediately after
loading, so we did not capture cartilage recovery rate, which is also a measure of joint health.
Lastly, we only took images of talar cartilage at one joint angle. This allowed us to only see one
2D cross-sectional area of the subjects’ cartilage which may not be representative of
34 Clinical Implications and Future Research
This study observed that healthy cartilage does deform in response to a standardized
hop loading protocol when measured using ultrasound imaging. The findings of this study also
indicate that cartilage deformation magnitude correlates with increased plantarflexion at initial
contact and lower loading rates, as well as better performance on certain sport-specific
functional tasks. Because we have seen positive correlations between 1) biomechanics , 2)
functional performance scores, and 3) cartilage behavior found in healthy individuals, our
results support a relationship between the way individuals load their joint and how their talar
cartilage responds to that load. Although more research needs to be done, this study may act as
a foundation for studies investigating talar cartilage deformation in pathologic individuals, as
well as the relationship between biomechanics, functional performance, and cartilage
deformation magnitude in pathologic individuals. For example, previous research has shown
differences in loading rates between how healthy individuals and those with CAI during a
running task.12 A recent systematic review also found that healthy individuals exhibited lower
loading rates than CAI individuals during unilateral jump landing tasks.71 Additionally, those
with CAI have been shown to have altered biomechanical profiles33,34,35 and functional
performance scores relative to uninjured controls.58,67,68 When these group differences are
coupled with our observed associations, it is likely that those with CAI have differences in
cartilage deformation behavior. While this investigation provides further support for the use of
ultrasound imaging as a clinical surrogate to MRI measures of cartilage health, determining if
US is sensitive to differences in cartilage deformation in pathological groups relative to
35 Conclusions
This study aimed to bridge the gap in the literature between lower extremity
biomechanics, functional performance, and healthy cartilage deformation of the talus. Before
developing a full understanding of the effects of altered kinematics on cartilage deformation in
pathologic individuals, we needed to establish normal cartilage deformation measures in a
healthy population and understand how biomechanical correlates influence cartilage
deformation. Based on our results, talar cartilage deforms, as measured via US, following a hop
loading protocol and this deformation occurs across the entire width of the talar dome.
Further, cartilage deformation magnitude is associated with key biomechanical parameters
during a hop but not a jump landing task. Additionally, cartilage deformation magnitude in the
lateral and overall aspects of the talus is also associated with better performance on select
functional tasks. In total, the results provide meaningful support for US to be used as a clinical
surrogate for MR based measures of ankle joint cartilage health and may provide insight into
healthy biomechanical and cartilage deformational profiles, laying the foundation for future
36
APPENDIX: DATA COLLECTION SHEET
Number: Date:
DOB: Height: Weight: Sex:
Dominant limb: Involved limb:
Data collection time: Session1: Session2:
Functional testing
Figure 8 Single leg hop Cross-over hop Side hop
1 2 3
Biomechanics Hopping
Hopping 1
2 3 4 5
Jump landing (50% of height) LESS 1
37 US measures
Positioning
Degrees (140) Distance
Ankle
Hopping protocol
60 Single leg hops (Control1H001)
0 15 30 45 60 Post
Ankle 1 2 3 7 8 9 13 14 15 19 20 21 25 26 27 31 32 33
38 REFERENCES
1. Ferran NA, Maffulli N. Epidemiology of sprains of the lateral ankle ligament complex.
Foot Ankle Clin. 2006;11(3):659-662. doi:10.1016/j.fcl.2006.07.002.
2. Adams J, Barton E, Collings J, DeBlieux P, Gisondi M, Nadel E. Emergency Medicine. In:
Saunders, ed. Emergency Medicine. Philadelphia, PA: Elsevier, Inc.; 2008:897-898.
3. Hubbard TJ, Wikstrom EA. Ankle sprain: pathophysiology, predisposing factors, and
management strategies. Open access J Sport Med. 2010;1:115-122.
http://www.ncbi.nlm.nih.gov/pubmed/24198549. Accessed October 8, 2017.
4. Cook M, Lamb S, Marsh J, Dale J. A survey of current consultant practice of treatment of
severe ankle sprains in emergency departments in the United Kingdom. Emerg Med.
2003;6(20):505-507.
5. Anandacoomarasamy A, Barnsley L. Long term outcomes of inversion ankle injuries. Br J
Sport Med. 2005;39. doi:10.1136/bjsm.2004.011676.
6. Chan K, Ding B, Mroczek. Acute and Chronic Lateral Ankle Instability in the Athlete. Bull NYU Hosp Jt Dis Bull NYU Hosp Jt Dis. 2011;6969(11):17-2617.
http://hjdbulletin.org/files/archive/pdfs/238.pdf. Accessed October 5, 2017.
7. Harrington KD. Degenerative arthritis of the ankle secondary to long-standing lateral
ligament instability. J Bone Joint Surg Am. 1979;61(3):354-361.
http://www.ncbi.nlm.nih.gov/pubmed/429402. Accessed November 6, 2017.
8. Saltzman CL, Salamon ML, Blanchard GM, et al. Epidemiology of ankle arthritis: report of
a consecutive series of 639 patients from a tertiary orthopaedic center. Iowa Orthop J. 2005;25:44-46. http://www.ncbi.nlm.nih.gov/pubmed/16089071. Accessed September 22, 2017.
9. Caine DJ, Golightly YM. Osteoarthritis as an outcome of paediatric sport: an
epidemiological perspective. Br J Sports Med. 2011;45(4):298-303. doi:10.1136/bjsm.2010.081984.
10. Saltzman CL, Zimmerman MB, O’Rourke M, Brown TD, Buckwalter JA, Johnston R. Impact of comorbidities on the measurement of health in patients with ankle osteoarthritis. J Bone Joint Surg Am. 2006;88(11):2366-2372. doi:10.2106/JBJS.F.00295.
11. Brown TD, Johnston RC, Saltzman CL, Marsh JL, Buckwalter JA. Posttraumatic
39
12. Bigouette J, Simon J, Liu K, Docherty CL. Altered Vertical Ground Reaction Forces in Participants With Chronic Ankle Instability While Running. J Athl Train. 2016;51(9):682-687. doi:10.4085/1062-6050-51.11.11.
13. Bischof JE, Spritzer CE, Caputo AM, et al. In vivo cartilage contact strains in patients with lateral ankle instability. J Biomech. 2010;43(13):2561-2566.
doi:10.1016/j.jbiomech.2010.05.013.
14. Valderrabano V, Hintermann B, Horisberger M, Fung TS. Ligamentous Posttraumatic Ankle Osteoarthritis. Am J Sports Med. 2006;34(4):612-620.
doi:10.1177/0363546505281813.
15. Harkey MS, Blackburn JT, Davis H, Sierra-Arévalo L, Nissman D, Pietrosimone B.
Ultrasonographic assessment of medial femoral cartilage deformation acutely following walking and running. Osteoarthr Cartil. 2017;25(6):907-913.
doi:10.1016/j.joca.2016.12.026.
16. Schmitz RJ, Wang H-M, Polprasert DR, Kraft RA, Pietrosimone BG. Evaluation of knee cartilage thickness: A comparison between ultrasound and magnetic resonance imaging
methods. Knee. 2017;24(2):217-223. doi:10.1016/j.knee.2016.10.004.
17. Keen HI, Wakefield RJ, Conaghan PG. A systematic review of ultrasonography in
osteoarthritis. Ann Rheum Dis. 2009;68(5):611-619. doi:10.1136/ard.2008.102434.
18. Berlet G, Anderson R, Davis W. Chronic Lateral Ankle Instability. Foot Ankle Clin. 1999;(4):713-728.
19. Waterman BR, Belmont PJ, Cameron KL, DeBerardino TM, Owens BD. Epidemiology of Ankle Sprain at the United States Military Academy. Am J Sports Med. 2010;38(4):797-803. doi:10.1177/0363546509350757.
20. Beynnon BD, Murphy DF, Alosa DM. Predictive Factors for Lateral Ankle Sprains: A Literature Review. J Athl Train. 2002;37(4):376-380.
http://www.ncbi.nlm.nih.gov/pubmed/12937558. Accessed October 8, 2017.
21. Waterman CBR, Owens MBD, Davey CS, Zacchilli CMA, Belmont LCPJ. The Epidemiology of Ankle Sprains in the United States. J Bone Jt Surgery-American Vol. 2010;92(13):2279-2284. doi:10.2106/JBJS.I.01537.
40
23. Shah S, Thomas AC, Noone JM, Blanchette CM, Wikstrom EA. Incidence and Cost of Ankle
Sprains in United States Emergency Departments. Sports Health. 2016;8(6):547-552.
doi:10.1177/1941738116659639.
24. Gribble PA, Delahunt E, Bleakley CM, et al. Selection criteria for patients with chronic ankle instability in controlled research: a position statement of the International Ankle Consortium. J Athl Train. 2014;49(1):121-127. doi:10.4085/1062-6050-49.1.14.
25. McCriskin BJ, Cameron KL, Orr JD, Waterman BR. Management and prevention of acute and chronic lateral ankle instability in athletic patient populations. World J Orthop. 2015;6(2):161. doi:10.5312/wjo.v6.i2.161.
26. Van Ginckel Yz A, Roosen P, Almqvist KF, Verstraete K, Witvrouw E. Effects of in vivo exercise on ankle cartilage deformation and recovery in healthy volunteers: an experimental study. Osteoarthr Cartil. 2011;19:1123-1131.
doi:10.1016/j.joca.2011.06.009.
27. Naredo E, Acebes C, Möller I, et al. Ultrasound validity in the measurement of knee cartilage thickness. Ann Rheum Dis. 2009;68(8):1322-1327.
doi:10.1136/ard.2008.090738.
28. Kraeutler MJ, Kaenkumchorn T, Pascual-Garrido C, Wimmer MA, Chubinskaya S. Peculiarities in Ankle Cartilage. Cartilage. 2017;8(1):12-18.
doi:10.1177/1947603516642572.
29. Anderson DD, Chubinskaya S, Guilak F, et al. Post-traumatic osteoarthritis: improved understanding and opportunities for early intervention. J Orthop Res. 2011;29(6):802-809. doi:10.1002/jor.21359.
30. Santos ALG, Demange MK, Prado MP, Fernandes TD, Giglio PN, Hintermann B. Cartilage lesions and ankle osteoarthrosis: review of the literature and treatment algorithm. Rev Bras Ortop. 2014;49(6):565-572. doi:10.1016/j.rboe.2014.11.003.
31. Povacz P, Unger SF, Miller WK, Tockner R, Resch H. A randomized, prospective study of operative and non-operative treatment of injuries of the fibular collateral ligaments of the ankle. J Bone Joint Surg Am. 1998;80(3):345-351.
http://www.ncbi.nlm.nih.gov/pubmed/9531201. Accessed October 10, 2017.
32. Valderrabano V, Horisberger M, Russell I, Dougall H, Hintermann B. Etiology of ankle osteoarthritis. Clin Orthop Relat Res. 2009;467(7):1800-1806. doi:10.1007/s11999-008-0543-6.