0
Add Health Wave IV
Documentation
Report
Cardiovascular Measures
Appendix I: Baroreflex
Sensitivity & Hemodynamic
Recovery
Report prepared by
Carmen C. Cuthbertson
Eric A. Whitsel
Chirayath M. Suchindran
Ping Chen
Mariah M. Cheng
Redford B. Williams
Joyce W. Tabor
Ley A. Killeya-Jones
Jon M. Hussey
Carolyn T. Halpern
Kathleen Mullan Harris
This research was supported by grant P01-HD31921 from the Eunice Kennedy Shriver National Institute of Child Health and Human Development, with cooperative funding from 23 other federal agencies and foundations. Further information may be obtained by contacting Add Health at [email protected].
2014
Carolina Population Center University of North Carolina at Chapel Hill
Table of Contents
Section Page
1. Introduction ...2
2. Rationale ...2
3. Estimation ...2
3.1 Baroreflex Sensitivity (BRS) ...2
3.2 Hemodynamic Recovery ...2
3.2.1 Pulse Rate Recovery (PRR) ...2
3.2.2 Systolic Blood Pressure Recovery (SBPR) ...3
3.3 Example Computation ...3
4. Quality Control ...3
4.1 Reliability ...3
4.2 Validity ...4
1. Introduction
This is an appendix to Add Health Wave IV Documentation: Cardiovascular and Anthropometric
Measures (Entzel et al., 2009). Please refer to that user guide for complete descriptions of the
cardiovascular data collection procedures and measures disseminated by the study at that time. In addition to the measures described there, this appendix introduces three more constructed measures that are included in the Add Health Wave IV public use data:
Baroreflex sensitivity
Pulse rate recovery
Systolic blood pressure recovery
The rationale for their estimation and description of their quality control are provided below.
2. Rationale
The carotid sinus, aortic arch, heart, and lungs contain stretch receptors that are sensitive to increases in arterial, cardiac filling, and central venous blood pressure. These sinoaortic and cardiopulmonary baroreceptors project information about decreases in blood pressure to the spinal cord and brain which in turn, increase sympathetic and decrease parasympathetic
stimulation of the heart and peripheral blood vessels. This baroreceptor reflex arc mediates the increase in pulse rate that usually accompanies decreases in systolic blood pressure over serial recordings, an autonomic phenomenon attributed to recovery from stress associated with
instrumentation for sphygmomanometry and initial cuff inflation. Because baroreceptor reflexes prevent short-term fluctuation of blood pressure and their impairment is associated with
cardiovascular diseases such as hypertension, diabetes, coronary heart disease, and heart failure (La Rovere et al., 2008; Eckberg, 1992), we estimated baroreflex sensitivity (BRS), pulse rate recovery (PRR) and systolic blood pressure recovery (SBPR) at Add Health Wave IV.
3. Estimation
Estimation was restricted to 14,003 participants with non-missing sampling weights and all three resting, seated measures of SBP (mmHg) and PR (beats/min). It involved converting PR to its unit-corrected reciprocal, RR interval duration (RR, ms) = 60,000 ÷ PR, and then running random-effects models implemented in Stata® 13 using XTMIXED and multi-level survey weights (Chen et al., 2014) to estimate BRS as the slope of the RR-SBP association, PRR as the increase in PR, and SBPR as the decrease in SBP across recordings.
3.1 Baroreflex Sensitivity (BRS)
The model used to estimate BRS (ms/mmHg) was given by: = + SBPij + +
1, …, 14,003), and are the fixed and random intercepts, and are the fixed and random slopes, and = + .
3.2 Hemodynamic Recovery
3.2.1 Pulse Rate Recovery (PRR)
The model used to estimate PRR (beats/min) was given by: = + timeij + + timeij
+ , where is the PR at the ith measurement (i = 1,…,3) on the jth participant (j = 1, …, 14,003), and are the fixed and random intercepts, and are the fixed and random slopes at times (0,1,2), and = + .
3.2.2 Systolic Blood Pressure Recovery (SBPR)
The model used to estimate SBPR (mmHg) was given by: = + timeij + + timeij
+ , where is the SBP at the ith measurement (i = 1,…,3) on the jth participant (j = 1, …, 14,003), and are the fixed and random intercepts, and are the fixed and random slopes at times (0,1,2), and = + .
3.3 Example Computation
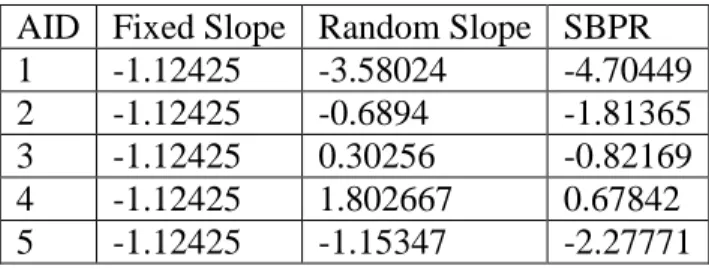
Table 1 provides an example computation of as the sum of the overall fixed slope and participant-specific, random slope (extracted using XTMIXED post-estimation commands).
and were computed in an analogous way.
Table 1. Example of estimating SBPR (mmHg). AID Fixed Slope Random Slope SBPR
1 -1.12425 -3.58024 -4.70449
2 -1.12425 -0.6894 -1.81365
3 -1.12425 0.30256 -0.82169
4 -1.12425 1.802667 0.67842
5 -1.12425 -1.15347 -2.27771
4. Quality Control
4.1 Reliability
effects model to partition the variance in of BRS, PRR and SBPR and estimate their reliability as the ratio of between-participant to total variance, i.e. a variance partitioning coefficient and 95% confidence interval (Goldstein, 1995). Greater than 75% of the variance in each of the three measures was attributable to that between participants. For BRS, the variance partitioning coefficient ranged from 0.84-0.94 over SBPs of 90-180 mmHg, and for PRR and SBPR, ranges were 0.85-0.86 and 0.76-0.79 over time.
4.2 Validity
We dichotomized the measures at their means and then used logistic regression to estimate their associations with cardiovascular disease risk factors as odds ratios and 95% confidence intervals at Add Health Wave IV (Cuthbertson, et al., 2014). Relative to those without a given
cardiovascular risk factor, the odds ratios for low BRS, PRR, and SBPR increased with increasing body mass index, blood pressure, and hemoglobin A1c.
5. References
Chen P, Chantala K. (2014). Guidelines for analyzing Add Health data. UNC Chapel Hill: Carolina Population Center. Available at
http://www.cpc.unc.edu/projects/addhealth/data/guides/wt-guidelines.pdf.
Cuthbertson CC, Suchindran CM, Harris KM, Hussey JM, Halpern CT, Tabor JW, Williams RB, Killeya-Jones L, Whitsel EA. (2014). Hemodynamic recovery and baroreflex sensitivity are reliable and associated with cardiovascular disease risk factors in a nationally representative sample of young US adults. Circulation;129(S1):AP3244.
Eckberg DL, Sleight P. (1992). Human baroreflexes in health and disease. New York: Oxford University Press.
Entzel P, Whitsel EA, Richardson A, Tabor J, Hallquist S, Hussey J, Halpern CT, Harris KM. (2009). Add Health Wave IV documentation: Cardiovascular and anthropometric measures. UNC Chapel Hill: Carolina Population Center. Available at
http://www.cpc.unc.edu/projects/addhealth/data/guides/Wave%20IV%20cardiovascular%20and %20anthropometric%20documentation%20110209.pdf.
Goldstein H. (1995). Multilevel Statistical Models. New York: Halsted Press.