Vol. 3, No. 2, pp 116-124 Summer 2009
Software Implementation and Experimentation with a New Genetic
Algorithm for Layout Design
E. Shayan
Department of Operations Management, Kazakhstan Institute f Management, Economics and Strategic Research (KIMEP), 4 Abai St , Almaty, Kazakhstan
ABSTRACT
This paper discusses the development of a new GA for layout design. The GA was already designed and reported. However the implementation used in the earlier work was rudimentary and cumbersome, having no suitable Graphical User Interface, GUI. This paper discusses the intricacies of the algorithm and the GA operators used in previous work. It also reports on implementation of a new GA operator which was not included in earlier reports. The software was then used to conduct a series of experimentations to establish the best configuration of the operators for better results. The paper is also demonstrating a comparison of the new GA results and results from the literature. In addition the results show the solution of two new problems by various methods from the author’s own layout developments in industry. The results demonstrate that in most cases the new GA is superior to the existing methods. In particular the speed of the new GA is achieving a reasonable solution is significantly low.
Keywords: Layout design, Genetic algorithm, Graphical user interface
1. INTRODUCTION
The material handling cost (MHC) can be reduced by 10–30% by robust facilities layout and material handling systems (Tompkins, 1996). Better design of layouts has become a research issue leading to many approaches. The quadratic assignment problem (QAP) is a famous layout model, which assigns n equal area departments to n equal sized locations. However, in general QAP is an NP-complete problem (Gorey, 1979). To deal with mo general unequal locations, several sub-optimal approaches to solve facilities layout problems using heuristics have also been developed such as simulated annealing, tabu search, artificial neural networks, and genetic algorithms (GAs) widely implemented to solve combinatorial optimization problems (Gero, 1997) and are considered to be robust approaches in artificial intelligence. Facilities layout is interconnected to running costs in the manufacturing industry.
An effective layout should arrange and integrate physical facilities to utilize the offering resource leading to multiple objectives including minimizing investment in equipment, minimizing overall production time, utilizing existing space the most effectively, employee convenience, safety and comfort, flexibility for arrangement and operation, and minimizing material handling cost (Francis, 1992). Most of the facility layout problems found in the literature deals with the arrangement of rectangular departments. There are applications, however, in which an orthogonal arrangement of departments is not necessarily a requirement. For an interesting survey the reader is referred to (Kusiak, 1987). The problem of determining the optimal location of areas in a plant falls in the class
of the Quadratic Set Covering (QSC) problems. Because of the large amount of possible area shapes and locations in a plant, there are no computationally feasible optimal or hybrid algorithms available for the QSC problem (Zhang, 1999).
Genetic algorithms are a family of parallel, randomized-search optimization heuristics which are based on the biological process of natural selection (Holland, 1975). Tam (1992) published a work on how to use Genetic Algorithms to solve plant layout problems. Tate and Smith (1995) focused on the case of compartmenting problems within different surfaces. Suresh, Vinod and Sahu (1995) presented a further application of Genetic Algorithms to the field of layout. Wang et al. (1996) produced a software based on GA for layout design. Tam and Chan (1998) further improved the GA based results using the Gambler’s ruin method, to make sure that the chromosome represents a slicing tree.
The work carried out by Moghaddam and Shayan (1998). Chittllappilly (2003), implemented a new chromosome representation and decoding scheme introduced by Hanafi (2000) based on slicing trees, using a two dimensional chromosome. It produces better results than existing representations mainly due to the fact that the new chromosome generated by GA operators are always feasible, thus no need for feasibility checks. Accordingly the new algorithm requires considerably less computational effort to produce results for practical sized problems. Further work and experiments were reported by Shayan (2004) to test the performance of the new algorithm under varying parameter settings and problem sizes, as compared with other algorithms from the literature. The experiments were conducted with rudimentary software. Wilsten, Shayan (2007) report an application of these developments in a real case scenario of a great complexity.
This paper is reporting on yet further extension of the previous work in which a unified user friendly interface called Genetic Algorithm for Layout Planning (GALP) was developed to facilitate further experimentation with the above mentioned GA algorithm. In addition it implemented an additional new operator devised by Shayan (1999) to the GA and tested the effect of this operator on the solution space exploration.
0 1 0141620 1 5 7 3 0 0 0110110 0 1 1 1
0
3 1
0
6 0
1
5 1
1
7 2
4
3 6 4
7 2
5 1
Algorithmic representation
Symbolic representation
Pictorial representation
0 1 0141620 1 5 7 3 0 0 0110110 0 1 1 1 0 1 0141620 1 5 7 3 0 0 0110110 0 1 1 1
0
3 1
0
6 0
1
5 1
1
7 2
4 0
3 1
0
6 0
1
5 1
1
7 2
4
3 6 4
7 2
5 1
3 6 4
7 2
5 1
Algorithmic representation
Symbolic representation
Pictorial representation
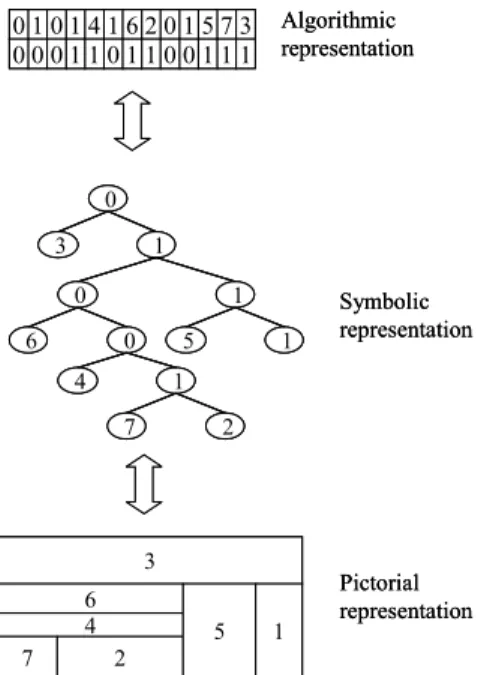
2. GA REPRESENTATION AND OPERATORS
We invite the readers to consult the pervious papers for details of the chromosome design, to avoid repetition. Here the minimum background necessary to understand the content of the software are introduced briefly.
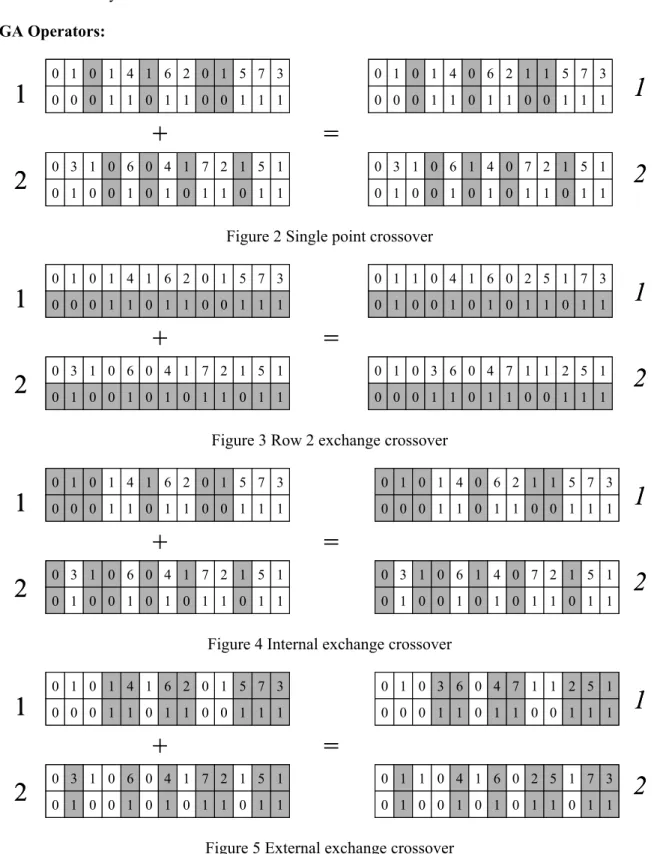
GA Operators:
0 1 0 1 4 1 6 2 0 1 5 7 3
0 0 0 1 1 0 1 1 0 0 1 1 1
0 3 1 0 6 0 4 1 7 2 1 5 1
0 1 0 0 1 0 1 0 1 1 0 1 1
0 1 0 1 4 0 6 2 1 1 5 7 3
0 0 0 1 1 0 1 1 0 0 1 1 1
0 3 1 0 6 1 4 0 7 2 1 5 1
0 1 0 0 1 0 1 0 1 1 0 1 1
+
=
1
2
1
2
0 1 0 1 4 1 6 2 0 1 5 7 3
0 0 0 1 1 0 1 1 0 0 1 1 1
0 1 0 1 4 1 6 2 0 1 5 7 3
0 0 0 1 1 0 1 1 0 0 1 1 1
0 3 1 0 6 0 4 1 7 2 1 5 1
0 1 0 0 1 0 1 0 1 1 0 1 1
0 3 1 0 6 0 4 1 7 2 1 5 1
0 1 0 0 1 0 1 0 1 1 0 1 1
0 1 0 1 4 0 6 2 1 1 5 7 3
0 0 0 1 1 0 1 1 0 0 1 1 1
0 1 0 1 4 0 6 2 1 1 5 7 3
0 0 0 1 1 0 1 1 0 0 1 1 1
0 3 1 0 6 1 4 0 7 2 1 5 1
0 1 0 0 1 0 1 0 1 1 0 1 1
0 3 1 0 6 1 4 0 7 2 1 5 1
0 1 0 0 1 0 1 0 1 1 0 1 1
+
=
1
2
1
2
Figure 2 Single point crossover
0 1 0 1 4 1 6 2 0 1 5 7 3
0 0 0 1 1 0 1 1 0 0 1 1 1
0 3 1 0 6 0 4 1 7 2 1 5 1
0 1 0 0 1 0 1 0 1 1 0 1 1
0 1 1 0 4 1 6 0 2 5 1 7 3
0 1 0 0 1 0 1 0 1 1 0 1 1
0 1 0 3 6 0 4 7 1 1 2 5 1
0 0 0 1 1 0 1 1 0 0 1 1 1
+
=
1
2
1
2
0 1 0 1 4 1 6 2 0 1 5 7 3
0 0 0 1 1 0 1 1 0 0 1 1 1
0 1 0 1 4 1 6 2 0 1 5 7 3
0 0 0 1 1 0 1 1 0 0 1 1 1
0 3 1 0 6 0 4 1 7 2 1 5 1
0 1 0 0 1 0 1 0 1 1 0 1 1
0 3 1 0 6 0 4 1 7 2 1 5 1
0 1 0 0 1 0 1 0 1 1 0 1 1
0 1 1 0 4 1 6 0 2 5 1 7 3
0 1 0 0 1 0 1 0 1 1 0 1 1
0 1 1 0 4 1 6 0 2 5 1 7 3
0 1 0 0 1 0 1 0 1 1 0 1 1
0 1 0 3 6 0 4 7 1 1 2 5 1
0 0 0 1 1 0 1 1 0 0 1 1 1
0 1 0 3 6 0 4 7 1 1 2 5 1
0 0 0 1 1 0 1 1 0 0 1 1 1
+
=
1
2
1
2
Figure 3 Row 2 exchange crossover
0 1 0 1 4 1 6 2 0 1 5 7 3
0 0 0 1 1 0 1 1 0 0 1 1 1
0 3 1 0 6 0 4 1 7 2 1 5 1
0 1 0 0 1 0 1 0 1 1 0 1 1
+
=
1
2
1
2
0 1 0 1 4 0 6 2 1 1 5 7 3
0 0 0 1 1 0 1 1 0 0 1 1 1
0 3 1 0 6 1 4 0 7 2 1 5 1
0 1 0 0 1 0 1 0 1 1 0 1 1
0 1 0 1 4 1 6 2 0 1 5 7 3
0 0 0 1 1 0 1 1 0 0 1 1 1
0 1 0 1 4 1 6 2 0 1 5 7 3
0 0 0 1 1 0 1 1 0 0 1 1 1
0 3 1 0 6 0 4 1 7 2 1 5 1
0 1 0 0 1 0 1 0 1 1 0 1 1
0 3 1 0 6 0 4 1 7 2 1 5 1
0 1 0 0 1 0 1 0 1 1 0 1 1
+
=
1
2
1
2
0 1 0 1 4 0 6 2 1 1 5 7 3
0 0 0 1 1 0 1 1 0 0 1 1 1
0 1 0 1 4 0 6 2 1 1 5 7 3
0 0 0 1 1 0 1 1 0 0 1 1 1
0 3 1 0 6 1 4 0 7 2 1 5 1
0 1 0 0 1 0 1 0 1 1 0 1 1
0 3 1 0 6 1 4 0 7 2 1 5 1
0 1 0 0 1 0 1 0 1 1 0 1 1
Figure 4 Internal exchange crossover
0 1 0 1 4 1 6 2 0 1 5 7 3
0 0 0 1 1 0 1 1 0 0 1 1 1
0 3 1 0 6 0 4 1 7 2 1 5 1
0 1 0 0 1 0 1 0 1 1 0 1 1
+
=
1
2
1
2
0 1 0 3 6 0 4 7 1 1 2 5 1
0 0 0 1 1 0 1 1 0 0 1 1 1
0 1 1 0 4 1 6 0 2 5 1 7 3
0 1 0 0 1 0 1 0 1 1 0 1 1
0 1 0 1 4 1 6 2 0 1 5 7 3
0 0 0 1 1 0 1 1 0 0 1 1 1
0 1 0 1 4 1 6 2 0 1 5 7 3
0 0 0 1 1 0 1 1 0 0 1 1 1
0 3 1 0 6 0 4 1 7 2 1 5 1
0 1 0 0 1 0 1 0 1 1 0 1 1
0 3 1 0 6 0 4 1 7 2 1 5 1
0 1 0 0 1 0 1 0 1 1 0 1 1
+
=
1
2
1
2
0 1 0 3 6 0 4 7 1 1 2 5 1
0 0 0 1 1 0 1 1 0 0 1 1 1
0 1 0 3 6 0 4 7 1 1 2 5 1
0 0 0 1 1 0 1 1 0 0 1 1 1
0 1 1 0 4 1 6 0 2 5 1 7 3
0 1 0 0 1 0 1 0 1 1 0 1 1
0 1 1 0 4 1 6 0 2 5 1 7 3
0 1 0 0 1 0 1 0 1 1 0 1 1
0 1 0 1 4 1 6 2 0 1 5 7 3
0 0 0 1 1 0 1 1 0 0 1 1 1
1
1
0 1 0 5 4 1 6 2 0 1 1 7 3
0 0 0 1 1 0 1 1 0 0 1 1 1
0 1 0 1 4 1 6 2 0 1 5 7 3
0 0 0 1 1 0 1 1 0 0 1 1 1
0 1 0 1 4 1 6 2 0 1 5 7 3
0 0 0 1 1 0 1 1 0 0 1 1 1
1
1
0 1 0 5 4 1 6 2 0 1 1 7 3
0 0 0 1 1 0 1 1 0 0 1 1 1
0 1 0 5 4 1 6 2 0 1 1 7 3
0 0 0 1 1 0 1 1 0 0 1 1 1
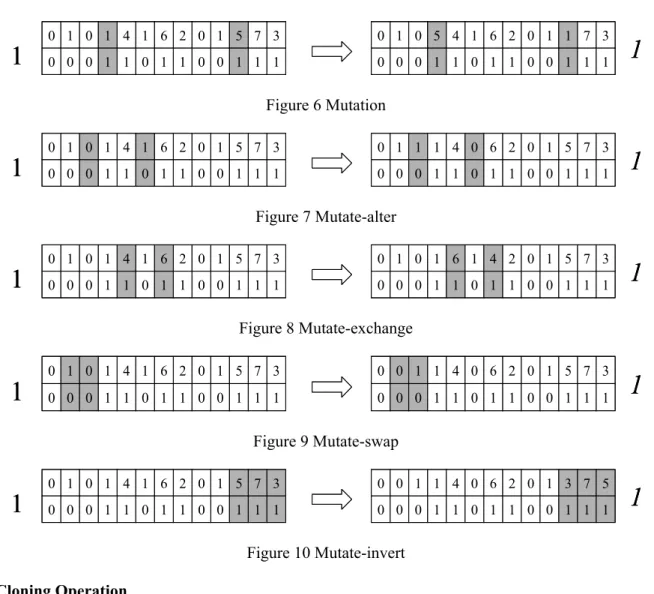
Figure 6 Mutation
0 1 0 1 4 1 6 2 0 1 5 7 3
0 0 0 1 1 0 1 1 0 0 1 1 1
1
1
0 1 1 1 4 0 6 2 0 1 5 7 3
0 0 0 1 1 0 1 1 0 0 1 1 1
0 1 0 1 4 1 6 2 0 1 5 7 3
0 0 0 1 1 0 1 1 0 0 1 1 1
0 1 0 1 4 1 6 2 0 1 5 7 3
0 0 0 1 1 0 1 1 0 0 1 1 1
1
1
0 1 1 1 4 0 6 2 0 1 5 7 3
0 0 0 1 1 0 1 1 0 0 1 1 1
0 1 1 1 4 0 6 2 0 1 5 7 3
0 0 0 1 1 0 1 1 0 0 1 1 1
Figure 7 Mutate-alter
0 1 0 1 4 1 6 2 0 1 5 7 3
0 0 0 1 1 0 1 1 0 0 1 1 1
1
1
0 1 0 1 6 1 4 2 0 1 5 7 3
0 0 0 1 1 0 1 1 0 0 1 1 1
0 1 0 1 4 1 6 2 0 1 5 7 3
0 0 0 1 1 0 1 1 0 0 1 1 1
0 1 0 1 4 1 6 2 0 1 5 7 3
0 0 0 1 1 0 1 1 0 0 1 1 1
1
1
0 1 0 1 6 1 4 2 0 1 5 7 3
0 0 0 1 1 0 1 1 0 0 1 1 1
0 1 0 1 6 1 4 2 0 1 5 7 3
0 0 0 1 1 0 1 1 0 0 1 1 1
Figure 8 Mutate-exchange
0 1 0 1 4 1 6 2 0 1 5 7 3
0 0 0 1 1 0 1 1 0 0 1 1 1
1
1
0 0 1 1 4 0 6 2 0 1 5 7 3
0 0 0 1 1 0 1 1 0 0 1 1 1
0 1 0 1 4 1 6 2 0 1 5 7 3
0 0 0 1 1 0 1 1 0 0 1 1 1
0 1 0 1 4 1 6 2 0 1 5 7 3
0 0 0 1 1 0 1 1 0 0 1 1 1
1
1
0 0 1 1 4 0 6 2 0 1 5 7 3
0 0 0 1 1 0 1 1 0 0 1 1 1
0 0 1 1 4 0 6 2 0 1 5 7 3
0 0 0 1 1 0 1 1 0 0 1 1 1
Figure 9 Mutate-swap
0 1 0 1 4 1 6 2 0 1 5 7 3
0 0 0 1 1 0 1 1 0 0 1 1 1
1
1
0 0 1 1 4 0 6 2 0 1 3 7 5
0 0 0 1 1 0 1 1 0 0 1 1 1
0 1 0 1 4 1 6 2 0 1 5 7 3
0 0 0 1 1 0 1 1 0 0 1 1 1
0 1 0 1 4 1 6 2 0 1 5 7 3
0 0 0 1 1 0 1 1 0 0 1 1 1
1
1
0 0 1 1 4 0 6 2 0 1 3 7 5
0 0 0 1 1 0 1 1 0 0 1 1 1
0 0 1 1 4 0 6 2 0 1 3 7 5
0 0 0 1 1 0 1 1 0 0 1 1 1
Figure 10 Mutate-invert
Cloning Operation
Consider the layout and its chromosome representation of Figure 11. The two type of cloning are shown in Figures 12 and 13.
0 3 1
0
1
6
0
5
1 4 1 7 2
0 1 0
0
0
1
0
1
1 1 0 1 1
0 3 1
0
1
6
0
5
1 4 1 7 2
0 1 0
0
0
1
0
1
1 1 0 1 1
3
6 4
7 2
5 1
3
6 4
7 2
5 1
0 1 3 0 1 0 6 5 1 1 4 7 2 0 0 1 0 0 0 1 1 1 0 1 1 1 0 1 3 0 1 0 6 5 1 1 4 7 2 0 0 1 0 0 0 1 1 1 0 1 1 1
3 6 4
7 2
5 1
3 6 4
7 2
5 1
Figure 12 Chromosome representation and layout after horizontal cloning
0 3 1 1 0 1 5 6 0 4 1 2 7 0 1 0 0 0 1 1 1 0 1 0 1 1 0 3 1 1 0 1 5 6 0 4 1 2 7
0 1 0 0 0 1 1 1 0 1 0 1 1 3
6 4
7 2
5 1
3 6 4
7 2
5 1
Figure 13 Chromosome representation and layout after vertical cloning
3. IMPLEMENTATION
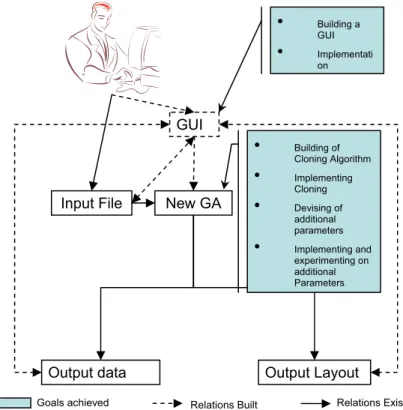
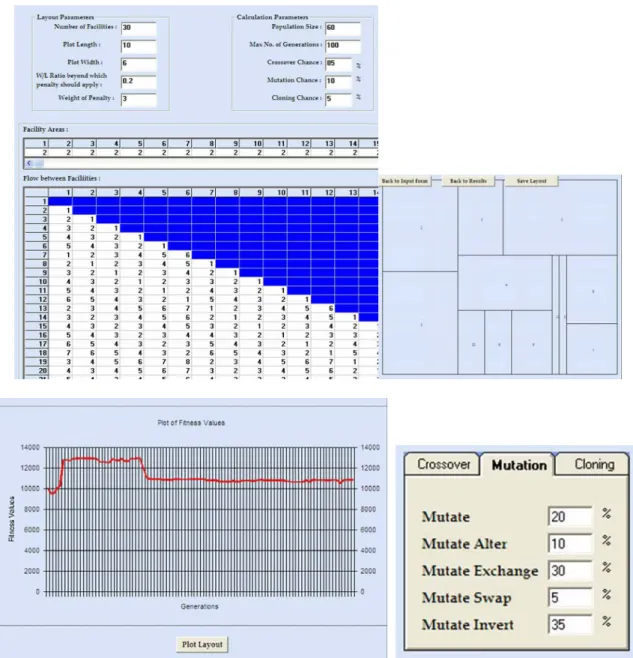
The software is introduced as in Figure 14.
Figure 14 The overall structure of the software GUI
New GA Input File
Output data Output Layout
• Building of Cloning Algorithm
• Implementing Cloning
• Devising of additional parameters
• Implementing and experimenting on additional Parameters
• Building a GUI
• Implementati on
We demonstrate only a few of the GUI features in a collectively referred to Figure 15
Figure 15 Examples of the Guis developed
4. EXPERIMENTATION
The test problems came from the literature including Bazaraa (1979), Moghaddam (1997), Imam and Mir (1993), QAPLIB, (www.opt.math.tu-graz.ac.at/qaplib/), J E Beasly (http://mscmga.ms.ic.ac.uk/jeb/or/faclay.html) and Rong-Long et al (2004). These consist of
Table 1 The values of parameters used for all the experiments Population
size
No. of generations
Crossover rate
Mutation rate
Cloning rate
Weight of penalty
length/width ratio
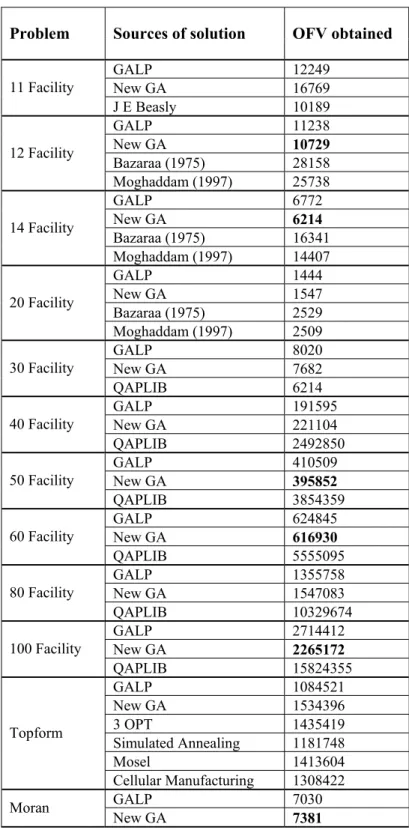
unequal area problems with 11, 12, 14 and 20 facilities and equal area problems with 30, 40, 50, 60, 80 and 100 facilities. The real life problems were from two local companies. The results from the New GA are tabulated against the results from other sources
Table 2 The summary of results of experiments carried on different problems
Problem Sources of solution OFV obtained
GALP 12249
New GA 16769
11 Facility
J E Beasly 10189
GALP 11238
New GA 10729
Bazaraa (1975) 28158 12 Facility
Moghaddam (1997) 25738
GALP 6772
New GA 6214
Bazaraa (1975) 16341 14 Facility
Moghaddam (1997) 14407
GALP 1444
New GA 1547
Bazaraa (1975) 2529 20 Facility
Moghaddam (1997) 2509
GALP 8020
New GA 7682
30 Facility
QAPLIB 6214 GALP 191595
New GA 221104
40 Facility
QAPLIB 2492850 GALP 410509
New GA 395852
50 Facility
QAPLIB 3854359 GALP 624845
New GA 616930
60 Facility
QAPLIB 5555095 GALP 1355758
New GA 1547083
80 Facility
QAPLIB 10329674 GALP 2714412
New GA 2265172
100 Facility
QAPLIB 15824355 GALP 1084521
New GA 1534396
3 OPT 1435419
Simulated Annealing 1181748
Mosel 1413604 Topform
Cellular Manufacturing 1308422
GALP 7030 Moran
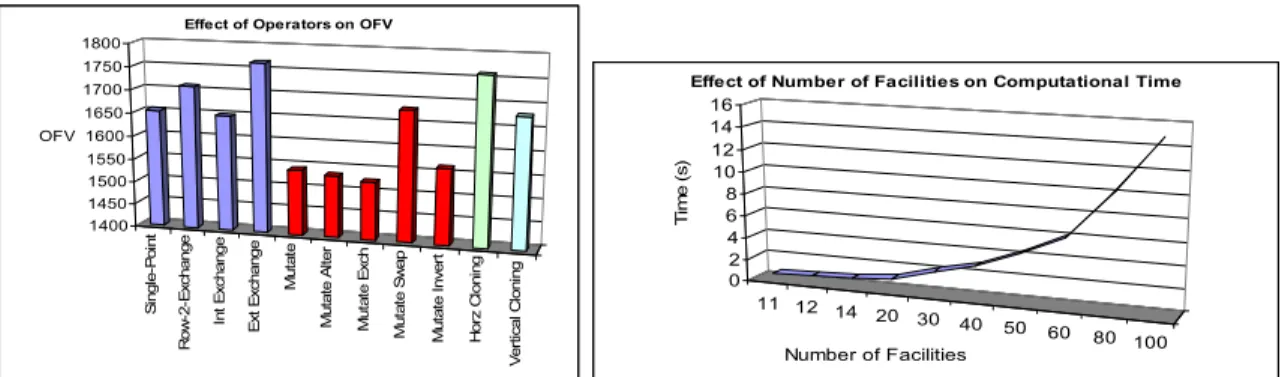
The graph shown below is the best OFV generated for a 20 facility problem when only one kind of operator was used. The performances are as plotted in Figure 16.
S ingl e-P o in t Ro w -2 -Ex c h a n g e In t E x c h ange E x t E xch a n g e M u ta te M u ta te A lte r M u ta te E x c h M u ta te S w a p M u ta te In v e rt Ho rz Cl o n in g V e rt ic al C loni n g 1400 1450 1500 1550 1600 1650 1700 1750 1800 OFV
Effect of Operators on OFV
11 12 14 20 30 40 50 60 80 100 0 2 4 6 8 10 12 14 16 Ti m e ( s )
Number of Facilities
Effect of Number of Facilities on Computational Time
Figure 16 Examples of experiments: Effect of operator types and number of facilities
5. CONCLUSIONS
This paper demonstrates the result of a software development exercise in a relatively difficult area. As a result we were able to conduct several experimentations on a GA algorithm for layout design. This included change of all the parameters and measurement of the fitness of the solutions. Everything is conducted interactively and the user can observe the solution as it develops. The results demonstrate the user-friendliness of the software in producing very interesting results for the algorithm’s robustness and speed. Note that even for 100 facilities, the time is in seconds while other software is incapable of reaching a solution in reasonable time. We acknowledge that the experimentation is still limited and more work needs to be done to also improve the software.
ACKNOWLEDGEMENTS:
Author acknowledges that Manjunath Shivarudrappa has made significant contribution to the development of the software.
REFERENCES
[1] Bazaraa M.S. (1975), Computational Layout Design: a branch-and-bound approach, AIIE Transactions 7(4); 432-438.
[2] Bazaraa M.S., Kirca O. (1983), A Branch-and-bound heuristic to solve QAP; Naval research logistics quarterly 30; 287-304.
[3] Bazaraa M.S., Sherali M.D. (1980), Benders' partitioning scheme applied to a new formulation of Quadratic Assignment Problem; Naval Research logistic quarterly 27(1); 29-41.
[4] Chittallappilly A. (2003), A Genetic Algorithm with two-dimensional chromosomes for Facility Layout; Swinburne University of Technology.
[5] Francis R.L., McGinnis L.F, White J.A. (1992), Facility Layout and Location: An Analytical Approach; Prentice-Hall, Englewood Cliffs, NJ.
[6] Gero J.S., Kazakov V. (1997), Learning and reusing information in space layout planning problems using genetic engineering; Artificial Intelligence Engineering 11(4); 329–334.
[7] Gorey M.R., Johnson D.S. (1979), Computers and intractability: a guide to the theory of NP-completeness; W. H. Freeman, New York.
[8] Hanafi R. (2000), Design of a Genetic Algorithm to solve the Facility Layout problem; Swinburne University of Technology, Melbourne, unpublished dissertation.
[9] Holland J. (1975), Adaptation in Natural and Artificial Systems; Ann Arbor, The University of Michigan Press.
[10] Imam M.H., Mir M. (1993), Automated layout of facilities of unequal areas; Computers and Industrial Engineering 24(3); 355-366.
[11] Kusiak A., Heragu S.S. (1987), The facility layout problem; European Journal of Operations Research 29; 229–251.
[12] Moghaddam R.T. (1997), Design of a genetic algorithm to solve manufacturing facilities layout problem; Swinburne University of Technology, Melbourne, dissertation.
[13] Moghaddam R.T., Shayan E. (1998), Facility layout design by genetic algorithm; International Journal of computers and Industrial Engineering 35(3-4); 527-530.
[14] Pinto Wilsten J. , Shayan E. (2007), Layout Design of a Furniture Production Line Using Formal Methods, Journal of Industrial and Systems Engineering 1(1); 81-96.
[15] Shayan E., Al-Hakim L. (1999), Cloning in layout design problem: A genetic algorithm approach; Proceedings of the 15th International Conference on Production Research (Hillery M., Lewis, H. Eds.); University of Limerick, Ireland; 787-792.
[16] Shayan E., Chittilappilly A. (2004), Genetic algorithm for facilities layout problems based on slicing tree structure; International Journal of Production Research 42(19); 4055-4067.
[17] Suresh G., Vinod V.V, Sahu S. (1995), A genetic algorithm for facility layout; International Journal of Production Research 33; 3411-23.
[18] Tam K.Y. (1992), A simulated annealing algorithm for allocating space to manufacturing cells; International Journal of Production Research 30(1); 63–87.
[19] Tam K.Y. (1992), Genetic algorithm, function optimization, and facility layout design; European Journal of Operational Research 63; 322–346.
[20] Tam K.Y., Chan D.K. (1998), Solving facility layout problems with geometric constraints using parallel genetic algorithms: experimentation and findings; International Journal of Production Research 36(12); 3253–3272.
[21] Tate David M., Smith Alice E. (1995), A Genetic Approach to the Quadratic Assignment Problem; Computers and Operations Research 22(1); 73-83.
[22] Tompkins James A., White John A., Bozer Yavuz A. (1996), Facilities Planning, 2nd Edition; John Wiley & Sons Canada, Ltd
[23] Wang Rong-Long, Okazaki Kozo (2004), Solving Facility Layout Problem Using an Improved Genetic Algorithm; ICICE transactions.
[24] Zhang L., Zhang B. (1999), A Geometrical Representation of McCulloch-Pitts Neural Model and Its Applications; IEEE Transactions on Neural Networks 10(4); 291-295.