Rochester Institute of Technology
RIT Scholar Works
Theses
Thesis/Dissertation Collections
7-1-1994
Colorimetric characterization of a desktop drum
scanner using a spectral model
Ming-Ching James Shyu
Follow this and additional works at:
http://scholarworks.rit.edu/theses
This Thesis is brought to you for free and open access by the Thesis/Dissertation Collections at RIT Scholar Works. It has been accepted for inclusion in Theses by an authorized administrator of RIT Scholar Works. For more information, please [email protected].
Recommended Citation
Colorimetric Characterization of a Desktop Drum Scanner
Using a Spectral Model
Ming-Ching
James
Shyu
B. S. National Cheng-Kung University (1983)
M. S. Colorado State University (1988)
A thesis submitted for partial fulmlment
of the requirements for the degree of
Master of Science in Color Science
in the Center for Imaging Science
in the College of Imaging Arts and Sciences
of the Rochester Institute of Technology
July 1994
Ming-Ching
1. Shyu
Signature of Author
Mark D. Fairchild
Accepted by
College of Imaging Arts and Sciences
Rochester Institute of Technology
Rochester, New York
CERTIFICATE OF APPROVAL
M. S. DEGREE THESIS
The M. S. Degree Thesis of Ming-Ching James Shyu
has been examined and approved
by two members of the color science faculty
as satisfactory for the thesis requirement for the
Master of Science degree.
Dr. Roy Berns, Thesis Advisor
Thesis Release Permission Form
Rochester Institute of Technology
Center for Imaging Science
Title of Thesis:
Colorimetric Characterization of a Desktop
Drum Scanner Using a Spectral Model
I, Ming-Ching James Shyu, hereby grant permission to the Wallace Memorial Library of
R.
I. T. to reproduce my thesis in whole or in part. Any reproduction will not be for
commercial use or profit.
Colorimetric
Characterization
of aDesktop
Drum Scanner
Using
a
Spectral Model
Ming-Ching
James Shyu
Athesissubmittedforpartialfulfillment oftherequirementsforthedegreeof
MasterofSciencein ColorScience intheCenterfor
Imaging
ScienceintheCollegeof
Imaging
Arts andSciencesoftheRochester Instituteof
Technology
ABSTRACT
Ascanner characterizationmethodbasedon ananalytic spectral model wasderived.
Themethodfirstmodeledthespectralformationof eachmediumusingeitherBeer-Bouguer
LaworKubelka-Munktheory. Scanner digitalcountswerethenempiricallyrelatedtodye
concentrations. Fromtheseestimateddyeconcentrations, either spectral transmittanceor
spectral reflectancefactorcouldbepredicted. Theseestimated spectraldatawere used to
calculate tristimulus values and then color differences forthe target object. A Howtek
D4000
desktop
drumscanner wascolorimetrically characterizedaccordingly. The averageAcknowledgments
I wishto express my gratitudeto the
following
sources ofsupportin completion ofthisthesis:
Dr.
Roy
Berns forguidance andinspiration,
Dr. Mark Fairchildand staffs oftheMunsell Color Science Lab forallthe support,
Mr. TaekKimofDupont
Printing
andPublishing
forthespectralmeasurements,Dupont
Printing
andPublishing
for financialsupport,HowtekInc. forpartialdonationoftheHowtekD4000 drumscanner,
My
wifeYu-Ling
forallthe encouragement,myparents and in-lawsfortheirfully
Dedicate
toYu-Ling,
Table
ofContents
Table of Contents i
ListofTables iv
ListofFigures vi
1. Introduction 1
2. Background 4
3. Scanner Characterization Process 13
3. 1 Material Analysis 14
3.1.1 Spectral Model- Transparent Material 15
3. 1.2 Spectral Model
- Opaque Material 18
3.1.3 Derivation of Unit Absorptivities 20
3.2 PredictionofActualConcentrations 22
3.3
Building
Characterization Model 253.3.1
Linearizing
Scanner Signals 273.3.2
Relating
Scanner ReadingstoConcentration 283.4Model Verification 29
3.5Comparison with prior spectral methods 32
4.Experimental 33
4.1 Target Objects 33
4.2
Metrology
andColorimetry
344.3Spectral Measurement 37
4.3.1 TransparentTarget 37
4.4 System Configuration 38
5. ResultsandDiscussion 40
5.1 Transparent Material- Kodak Ektachrome
40
5.1.1 MaterialAnalysis 40
5.1.2PredictionofActualConcentrations 45
5.1.3 Image
Scanning
465.1.4
Building
Characterization Model 475.1.5 Performance Verification 69
5.2 Transparent Material
-FujiFujichrome 72
5.2. 1 Material Analysis 72
5.2.2 PredictionofActual Concentrations 77
5.2.3 Image
Scanning
785.2.4
Building
CharacterizationModel 785.2.5 Performance Verification 86
5.3 Opaque Material Kodak Ektacolor Plus Paper 89
5.3. 1 Material Analysis 89
5.3.2PredictionofActualConcentrations 94
5.3.3 Image
Scanning
955.3.4
Building
CharacterizationModel 965.3.5 PerformanceVerification 105
5.4OpaqueMaterial- FujiFujicolorPaper 108
5.4.1 MaterialAnalysis 108
5.4.2PredictionofActualConcentrations 113
5.4.4
Building
Characterization
Model 1145.4.5 Performance Verification 124
6. Conclusions 131
References 134
Appendix A:Spectral Weightings for
Calculating
TristimulusValues 139Appendix B: Spectral
Property
oftheTarget Materials 141AppendixC:ProgramtoPredict Concentrations 145
Appendix D: Program to Calculate Color Difference 155
Appendix E: ProgramtoretrieveRaw Scanner Digital Counts 163
List
ofTables
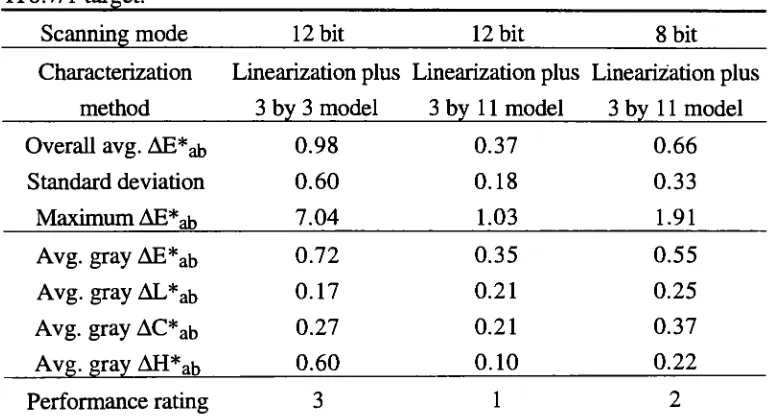
TABLE I. List ofpublished scanner characterization results 12
TABLEn. Resultsoftheprincipal component analysisonKodak IT8.7/1 target 42
TABLEHI. Regressionresults
-rampeigenvectors againstglobaleigenvectorsfor
Kodak IT8.7/1 target 43
TABLE TV. Regressionresultsofthe3
by
3model(12-bitscan)for Kodak IT8.7/1target ; 50
TABLE V. Regression results ofthe 3
by
11 model (12-bit scan) for Kodak1T8.7/1 target 55
TABLEVI. Regressionresultsofthe3
by
1 1 model(8-bit scan) for Kodak IT8.7/1target 61
TABLE VII. Performance summary of 3 different scanner models for Kodak
IT8.7/1 target 66
TABLE vm. Resultsoftheprincipal component analysis onFuji IT8.7/1 target 74
TABLE DC Regressionresults
-eigenvectors against global -eigenvectors for Fuji
IT8.7/1 target 75
TABLE X. Regressionresults ofthe 3
by
1 1 model (12-bitscan) for Fuji IT8.7/1target 81
TABLE XI. Resultsoftheprincipal component analysis onKodak Q-60Ctarget 91
TABLE XII.Regressionresults
-rampeigenvectorsagainst global eigenvectorsfor
Kodak Q-60C target 92
TABLE XIII. Regression results ofthe 3
by
1 1 model (8-bitscan) for KodakQ-60Ctarget "
TABLE XTV. Resultsoftheprincipal component analysisonFujiIT8.7/2target 110
TABLE XV. Regressionresults
-rampeigenvectors against globaleigenvectorsfor
Fuji IT8.7/2target Ill
TABLE XVI. Regressionresultsofthe3
by
1 1 model (8-bit scan)forFuji IT8.7/2target 118
TABLE XVII. Regressionresults - theindependentFujicolortarget'seigenvectors
againsttheFuji IT8.7/2target'seigenvectors 130
List
ofFigures
FIG.3-1
. Overalldataflowofthecharacterization method 14 FIG. 3.1-1. Optical geometry oftransmittance and opaque materials 15
FIG. 3.3-1.Plotsofnormalized scanner readings against concentration readingsfor
spectrallynon-selectivecolors 27
FIG. 3.4-1. Flow chart of the characterization process 31
FIG. 4.1-1. Sample images ofthe targetmaterials 36
FIG. 5.1-1. MaximumtransmittanceofKodak IT8.7/1 target 41
FIG. 5.1-2.Eigenvectors ofKodak IT8.7/1 target 45
FIG. 5.1-3. Predictedspectraltransmittancefactors fromthe tristimulus matching
algorithm 46
FIG. 5.1-4. Histogramofthe
AE*ab
from the tristimulus matching algorithm forKodak IT8.7/1 target 46
FIG. 5.1-5. Example plots ofthelinearizationprocess for Kodak IT8.7/1 target 49
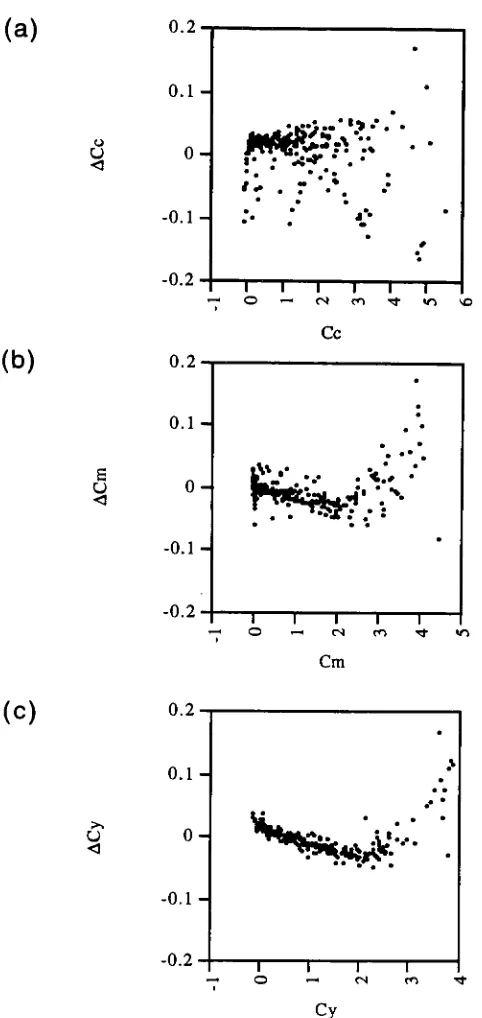
FIG. 5.1-6. Concentration differences from the 3
by
3 model prediction (12-bitscan)against actual concentrationsfor Kodak IT8.7/1target 51 FIG. 5.1-7. Histogramofthe
AE*ab
errorfromthe 3by
3 model (12-bitscan) forKodak IT8.7/1 target 52
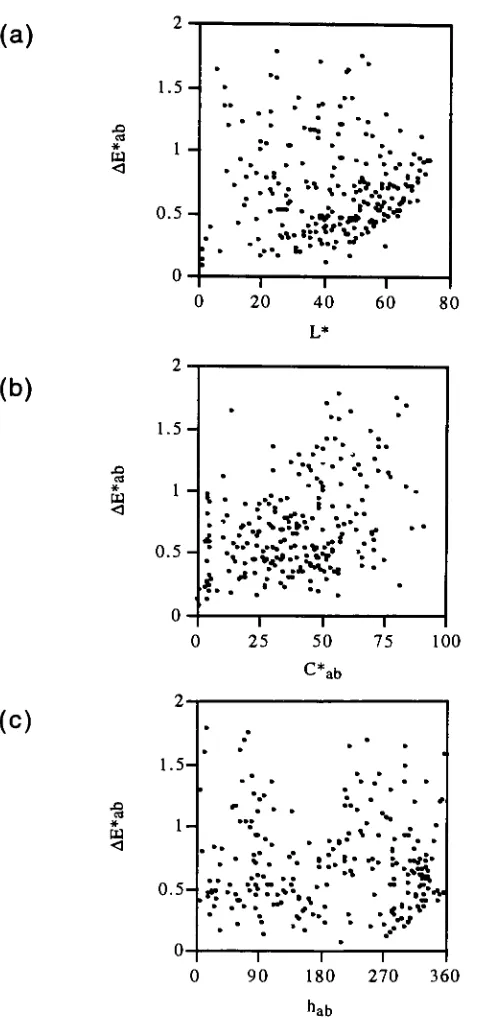
FIG. 5.1-8. Color differenceversus
L*,
C*ab
andhab from the3by
3 model(12-bit scan) for Kodak IT8.7/1 target 53
FIG. 5.1-9. Concentration differences fromthe 3
by
11 model prediction (12-bitscan) against actual concentrationsfor Kodak IT8.7/1 target 56
FIG. 5.1-10. Histogramofthe
AE*ab
errorfromthe 3by
11 model (12-bitscan)for Kodak IT8.7/1 target 57
FIG. 5.1-11. Color difference versus
L*,
C*ab
andhab
fromthe 3by
11 model(12-bit scan) for Kodak IT8.7/1 target 58
FIG. 5.1-12. Concentration
differences
from the 3by
11 modelprediction (8-bitscan)against actualconcentrationsfor Kodak IT8.7/1 target 62
FIG. 5.1-13. Color difference versus
L*,
C*ab
andhabfromthe3by
1 1 model(8-bit scan) for Kodak IT8.7/1 target 63
FIG. 5. 1-14. Histogramofthe
AE*ab
errorfromthe3by
1 1 model (8-bit scan) forKodak IT8.7/1 target 64
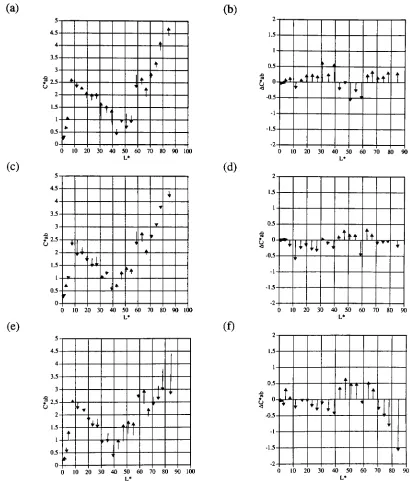
FIG. 5.1-15. Model performance analysis for the gray balanceofKodak IT8.7/1
target 67
FIG. 5. 1-16. Modelperformance analysisforthehueshiftofKodak IT8.7/1 target....69
FIG. 5.1-17. Color difference versus
L*,
C*ab
andhab fromthe 3by
11 model(12-bitscan)foranindependent Kodak Ektachrometarget 70
FIG. 5.1-18. Histogramofthe
AE*ab
errorfromthe 3by
11 model (12-bit scan)foranindependent Kodak Ektachrometarget 71
FIG. 5.2-1. Maximum transmittance of Fuji IT8.7/1 target 73
FIG. 5.2-2. Eigenvectors of Fuji IT8.7/1 target 76
FIG. 5.2-3. Histogram ofthe
AE*ab
fromthe tristimulus matching algorithm forFuji IT8.7/1 target 77
FIG. 5.2-4. Exampleplots ofthelinearizationprocessfor Fuji IT8.7/1 target 80
FIG. 5.2-5. Concentration differences fromthe 3
by
11 model prediction (12-bitFIG. 5.2-6.Color differenceversus
L*,
C*ab
andhab fromthe3by
11 model(12-bitscan)for Fuji IT8.7/1 target 83
FIG. 5.2-7. Histogramofthe
AE*ab
errorfromthe3by
1 1 model (12-bit scan) forFuji IT8.7/1 target 84
FIG. 5.2-8. Model performance analysisforthegray balance ofFuji IT8.7/1 target 85
FIG. 5.2-9. Modelperformance analysisforthehueshift ofFuji IT8.7/1 target 86
FIG. 5.2-10. Histogramofthe
AE*ab
errorfrom the 3by
11 model (12-bit scan)foranindependent Fujichrometarget 87
FIG. 5.2-11. Color difference versus
L*,
C*ab
and hab from the 3by
11 model(
12-bitscan)for independent Fujichrome target 88FIG. 5.3-1. Maximumreflectance ofKodak Q-60Ctarget 90
FIG. 5.3-2. EigenvectorsofKodak Q-60C target 93
FIG. 5.3-3. Measured and predicted spectral reflectances from the tristimulus
matching algorithm for Q-60C target 95
FIG. 5.3-4. Histogram ofthe
AE*ab
from the tristimulus matching algorithm forKodak Q-60C target 95
FIG. 5.3-5. Exampleplotsofthelinearizationprocessfor Kodak Q-60C target 99
FIG. 5.3-6. Concentration differences from the 3
by
11 model prediction (8-bitscan) against actual concentrationsfor Kodak Q-60Ctarget 102
FIG. 5.3-7. Color difference versus
L*,
C*ab
andhab fromthe3by
11 model(8-bit scan) for Kodak Q-60C target 103
FIG. 5.3-8. Histogram ofthe
AE*ab
errorfrom the 3by
11 model(8-bit scan) forKodak Q-60C target 104
FIG. 5.3-9. Model performance analysis forthe gray balance of Kodak Q-60C
target 104
FIG. 5.3-10. Modelperformance analysisforthehueshift ofKodak Q-60C target 105
FIG. 5.3-11. Histogramofthe
AE*ab
errorfromthe3by
1 1 model(8-bit scan) foranindependent Ektacolorpapertarget 106
FIG. 5.3-12. Color differenceversus
L*,
C*ab
andhabfromthe3by
1 1 model(8-bitscan)for independent Ektacolorpapertarget 108
FIG. 5.4-1. Maximum reflectance of Fuji IT8.7/2 target 109
FIG. 5.4-2. Eigenvectors of Fuji IT8.7/2 target 112
FIG. 5.4-3. Histogramofthe
AE*ab
fromthe tristimulus matching algorithm forFuji IT8.7/2target 113
FIG. 5.4-4. Exampleplotsofthelinearizationprocessfor Fuji IT8.7/2target 116
FIG. 5.4-5. Concentration differences from the 3
by
11 model prediction (8-bitscan)against actual concentrationsfor Fuji IT8.7/2target 119
FIG. 5.4-6. Histogram ofthe
AE*ab
errorfromthe3by
1 1 model(8-bitscan)forFuji IT8.7/2target 120
FIG. 5.4-7. ColordifferenceversusL*.
C*ab
andhab fromthe 3by
11 model(8-bitscan)for Fuji IT8.7/2target 121
FIG. 5.4-8. Modelperformanceanalysisforthe gray balanceofFuji IT8.7/2target 123
FIG. 5.4-9. Model performanceanalysisforthehueshift ofFuji IT8.7/2target 123
FIG. 5.4-10. Histogram ofthe
AE*ab
errorfromthe 3by
11 model (12-bit scan)foranindependentFujiEktachrometarget 125
FIG. 5.4-1 1. Colordifferenceversus
L*,
C*ab
andhab fromthe 3by
1 1 modelFIG. 5.4-12.Measuredand predicted spectral reflectances ofindependentFujicolor
papertarget 127
FIG. 5.4-13. Maximumreflectances ofFuji IT8.7/2 target and the independent
Fujicolor target 128
FIG. 5.4-14. Rotatedeigenvectors oftheindependentFujicolortargetandtheFuji
1. Introduction
Inthe graphic arts color reproductionprocess, aphotographicoriginal is captured
by
an analytical deviceandthenrecomposedby
asynthetic mediumfromwhichforms thereproduction. Agoalofthereproduction processistomakethereproduced coloridentical
to the original when
they
are viewed side-by-side under a specific viewing condition.However,
this goal is not always achieved satisfactorily due to the lack ofprocessingaccuracy.
Therefore,
an accurateinputanalyticaldevice isanecessity inthereproductionsystem. The focusofthis thesisistocolorimetricallycharacterize a
desktop
drumscannerserving as an analytical device in order to enhance the accuracy of graphic arts color
reproduction.
Intraditionalprinting, thescanningoperationis done
by
a skilledcraftsmanusinga"high-end"
scanner. Thescanneris usually inthe million-dollar range and equipped with
very sophisticated color correction controllers. Based on accumulated experience, the
craftsman adjusts the controllers to convert the image
density
ofthe original to screenpercentages of the separations for press printing. Since the craftsman has profound
knowledge about howthe screen
density
willtranslate into color-ink onpaper, accuratecolor reproductionmay beachievedinsuch aclosed-loopenvironment.
Meanwhile,
thecolor reproductionindustry
hasexperienced significantchangesduetothe adventof electronicimage processingtechnology. Thedevelopmentofthe
desktop
electronic scanner provides a more productive andless expensive methodthan traditional
high-end scanningin colorreproduction. Despitethis technological advance, two issues
The first issue is that the users ofthe
desktop
systemdo not always have goodcolor separation skill compared withtheprintingcraftsmen. Sincetheusers ofthe
desktop
scanneraremost
likely
artists withexpertise notinoffsetprinting,thedesktop
systemhastoprovide a vehicleto assuretheaccuracyofthecolor reproduction. The secondissue is
that the reproduction synthetic medium may not be limited to ink on paper. Since the
reproductioncouldbecarried outinanopen-ended system withadditionaldifferentmedia
such as CD
ROM, CRT,
film recorder, or digital color printer, the scanning operationdesignedforthe close-loopedink-on-paperprocess is not adequateto assureaccuracy of
the color reproduction for open-ended media.
Consequently,
colorimetric accuracyindependent fromthe output media is required for the
desktop
scanner to provide goodcolor reproduction quality. Scanner colorimetric characterization is the first step in
achieving device independentcolorforthisopen-endedcolor reproduction system andthe
scanner is also the first device in the color reproduction chain.
Therefore,
it becomescriticaltohavethescanning device colorimetricallycharacterizedtorecordtheimagesignal
faithfulto theoriginal.
There aretwo general approaches in scanner colorimetric characterization: direct
tristimulus value matching and spectral matching. Both approaches usethe set ofthree
digital counts fromthe threeprimary sensorsinthescannertoderiverequisite data. The
directtristimulusmatchingapproach mapsthedigitalcountsto tristimulusvalues througha
set ofcharacterizationfunctions. Thespectralmatchingapproachreconstructs thespectral
dataoftheoriginal
by
a spectral model andthencalculatesthetristimulusvalueswiththeThere have beenseveral recent articles
describing
thecolorimetriccharacterizationof
desktop
scanners based on the tristimulus matching approach,1"3to be discussed in detail in the
following
chapter. A few articles have described the colorimetriccharacterization of
desktop
scanners based on the spectral matching approach.4'5 Thetristimulus approach iseasier toimplement since it does not require a spectral analysis.
However,
the spectral match approachhasnotonlytheadvantage ofhigheraccuracy butalsoin
functioning
well undermultipleilluminantsand notbeing
susceptibletoproblems of illuminantmetamerismincomparison withthe tristimulusmatchingapproach. Thespectralmatchingapproach waschosen asthesolecharacterizationmethodinthisthesis.
Theoverall objectiveofthisthesiswastoachievecolorimetric characterizationof a
Howtek D4000
desktop
drum scanner suchthat the scanner's output could be translatedinto accurate colorimetric signals of the target object. The scanner was treated as a
densitometer where the scanner digital counts were related to the material's dye
concentrationsinordertoreconstructthespectralinformationofthephotographic original.
Thespectralinformationwas usedtocalculatetristimulusvalues andthenCIELAB values
asthefinalresultofthecharacterizationprocess. In a similar mannertocurrent practicein
the printing
industry,
photographic materials were used as the target objects. CIEilluminant D50andtheCIE 1931 2 degreestandard colorimetricobserver6
were usedinall
the computations as recommended
by
the Committee for Graphic Arts Technologies Standards (CGATS).7 The performance ofthe characterization method was evaluatedquantitatively
by
AE*ab
color differences between instrumental measurements and the characterized scanner output ofthe test targets. These results were also comparedwith2. Background
There havebeen several articles
describing
the colorimetric characterization ofdesktop
scanners. In general, their methodologies can be categorized as operatorintervention,8 polynomial regression,9'10
multidimensional interpolation,11'12 multi
channelanalysis,13-14
and spectral modelanalysis.4-5
They
allshare onecommon goal: toachieve the smallest
AE*ab
difference between the original and the transformed digitalsignals.
Ideally,
this goal could be achieved easily with a simple 3by
3 matrix if thescanner's sensor spectral sensitivities are a linear combination of a set of CLE color
matching functions. This has been proven mathematically
by
Schrodinger15 that intransforming
fromone set of primaries toanother set ofprimaries,thenew primaries willbe homogeneous linear functionsoftheoldprimaries. Thistopicwas revisitedrecently
by
Gordon and Holub.16 Gordon andHolub also cautioned thatifthe sensors'
sensitivities
are not linear combinations ofcolor matching
functions,
nonlinear transformations areneededtorelatetheRGB digitalcountstoXYZtristimulusvalues. Thisisthe typicalcase.
Wandell and Farrell8 utilized the 3
by
3 transformation and also analyzed theresidualdistribution betweenthemeasured and predictedtristimulus values.
They
foundthattheerror cloud wasprincipally scatteredinonedirectionand proposedto add afourth
channelalongthecolor coordinates where most ofthecharacterization errorwas observed.
By
visually evaluatingimages,
theusercould use a slidertocorrecttheestimatedcolorandto reducethetransformationerror. Intheir experiment,thecharacterizationresultsof aHP
13.2)
for the direct 3by
3 transformation and improved to an averageAE*ab
of 1.7(maximumat
6.2)
with userinterventionalongthefourth dimension. Theoperationof userintervention did improvethecoloraccuracy;
however,
itadded considerableburdenonthedesktop
userforextra color adjustmentlikely
reducingproduction speed.The 3
by
3 transformationfailedtorelatethe scannerdigital countstotristimulus values because the scanner responsivities were not a linear combination of CIE colormatching functions. One could ask the question: why not build a scanner
having
responsivitiesthat are alinearcombinationofCIEcolor matching functions? Vrhel and
Trussell have addressed this question
by deriving
a method to select color filters andimaging
illuminants for scanner systems.13 Avectorspace approach combinedwith set theoreticalmethods was usedto synthesizethedesired filters with as few basis filters as possible.14 Optimal
nonnegativesets offilters were derived
by
this method forseveralviewing illuminants. Simulations wereperformedon343 spectralreflectance patchesfrom a color copier. The simulation results under illuminant D65 were as follows: average
AE*ab
of2.3 unit (maximumof10.7)
fortheoptimal3filters,
averageAE*ab
of0.35unit(maximumof
1.3)
fortheoptimal4filters,
averageAE*ab
of0.34unit(maximumof1.4)
for the optimal 5 filters. The constraint of nonnegative terms for the filters' spectral
response would ensure that thefilters arephysically conceivable. Howevertheseresults
were allfromcomputersimulation;it isnot clearthathowfeasible it istomanufacture such
filter sets with good signal-to-noise performance and with reasonable cost from commerciallyavailablefiltermaterials.
polynomial regression ormulti-dimensionalinterpolation. Thetechnique ofpolynomial
regression17 is based on the
following
theory: assuming the processing error in thescanningelementsfollows a normal
distribution,
aregression equation canbeestablishedtorepresent therelationship betweenthepredictor variables- RGB
digitalcounts andthe
response variables - their
corresponding XYZ values. North9 performed stepwise
polynomial regression for a
Sharp
JX450 flat-bed scanner with 125 color patches ofphotographic material and achieved results where86%ofthepredictions werelessthan2.0
AE*ab. Berns10performedstepwise polynomialregression with200
photographicsamples
basedon photographing aMunsell BookofColorand achieved an average
AE*ab
of 1.6units (maximumat
4.5)
forilluminantD50. Kang2performed polynomialregressionforaSharp
JX450scannerusingaKodakQ60Cphotographic standard andachievedanaverageAE*ab
of2.8 for a 3by
3 matrix, an averageAE*ab
of2.5 for a 3by
6 matrix and anaverage
AE*ab
of1.9 fora3by
14matrix. Moreresults are listed in Table I.Kang
alsoincluded agray balance routinein his
implementation,
which forced thegray patches tohaveequal amount ofRGB digitalcounts.
Berns3 further
concentrated on thecolor correction operation of the system and
performed a regression from the digital counts
directly
to CIELAB values. Thecharacterization was performed on a
Sharp
JX610 scannerwithaKodak Q60Creflectancetarget and a Macbeth Color Checker chart; the result was an average
AE*ab
of 1.8(maximumat
8.8)
fora3by
9matrix. Otherthan usingtheKodak Q60Cas atesttarget,Clippeleer18applied polynomial regression on aflatbed CCD scanner withanAgfachrome
IT8.7/1 standard and achieved an average
AE*ab
around2.5 (maximumat around9.0)
fora(maximumat around
5.0)
fora3by
27 matrix and around 1.0(maximum at around3.5)
fora3
by
64matrix.Severalissues exist when using the regression technique. One is the regression
function can not be extrapolated beyond the range of the known predictor variables.
Another issue is how to interpret any physical meaning for the non-linear polynomial
terms.
Moreover,
itisvery difficulttocalculatetheinverse transformationfromahigh-order polynomial regressionfunction.
Fortunately,
thisisnot requiredinthisapplication.Multidimensional interpolation techniques with table look up were then considered as
another approachtoscannercharacterization.11'19
Theideaofmulti-dimensional interpolation is basedonthemathematicalprinciple
that any smooth function can be approximated
by
many contiguous linear segments.Together,
allthe smalllinear segmentsdefinethe systemresponsecharacteristic betweenthe input domain and the output domain.
Treating
a scanner as a blackbox,
theinput/output relationship canbecharacterizedbetween the systeminput (scanner values)
and the system output (tristimulus values) with a
look-up
tableby
the interpolationtechnique.
Thereareseveral waysto subdividethedomainspaceintosubspaces. Twotypical
ways are cubic subspace division and tetrahedral division. The cubic interpolation
techniqueuseseight corners of a cube tointerpolate betweentwo3-dimensionalspaces. It
is a straight-forward operation to map a uniform orthogonal cube in six flat plans to
another solid form
having
eightcorners in another space. Howeverinversely,
anyeightThetetrahedralinterpolationtechniqueis basedonthephenomenonthatfourpoints
define a unique tetrahedron.
Consequently,
a subcube divided into tetrahedrons in onecolor space canbe
linearly
relatedtoa pointinthecorresponding
tetrahedron intheothercolor space and the forward or inverse relationship is a unique one-to-one mapping.
Hung1! appliedtetrahedralinterpolation
andLUTtechnique
(33x33x33)
tocharacterize aSharp
JX450 scanner with 125photographic color patchesforilluminantD65 and resultedin an average
AE*ab
of 1.1 with a maximumerror of9.9. Forcomparison,Hung
alsoappliedpolynomialregression onthesameconfigurationand got anaverage
AE*ab
of4.7(maximum at
12.9)
for 1st order regression, 2.8 (maximum at8.2)
for 2nd orderregression and2.2 (maximumat
7.8)
for 3rdorder regression.To comparetheperformancedifference betweenvariousLUTsizes, Hung12used
an analytical model to generate 65x65x65 data points and tested the data with
5x5x5,
9x9x9,
17x17x17 and 33x33x33 linear tetrahedral LUT. In the case of Beer's lawsimulation, the average
AE*UV
errors were5.4,
1.4,
0.4 and 0.1 for5x5x5,
9x9x9,
17x17x17 and 33x33x33 tetrahedral
LUTs,
respectively. The maximumAE*UV
errorswere
18.7,
6.0,
1.7 and0.5 respectively.Hung
suggestedthat the suitable sizeforaLUTmodel showing a small enough error may result from 17x17x17 to 33x33x33
look-up
tables.However,
a 17x17x17LUT implies 4913 measurements in each oftheinput andoutputdomains.
Hung12 had furthercombined the tetrahedral and LUT technique with nonlinear
interpolation. He adjustedtheRGB digitalcounts with "tonecurve
adjustment"
using
one-dimensional LUTs similar to the gray balance routine
Kang
used. The results of thissimulatedtest databasedonBeer'slawmodel. Underthesamecondition, theregression
techniqueresultedAE*uverrorof 15.1 (maximumat
52.3)
for 1storderregression,AE*uvof5.5 (maximum at
29.4)
for2nd order regression and AE*uv of2.1 (maximum at8.8)
for3rdorderregressionrespectively. Fromthese results,itseemedthatthenon-linear
one-dimensionalinterpolationcombined with multi-dimensionaltetrahedrallinear interpolation
producedabetterresultthan theregression method.
Unfortunately,
these testresults werenot available in
AE*ab;
neitherhas there been any further published results on scannercharacterizationusingthis technique.
RodriguezandStockham4proposed amethod whichtreats thedigitalcounts ofthe
scanner output as the scanner
density
readings and relates themdirectly
to colorimetricquantities based on the assumptions that the system responsivities of the scanner are
narrow, like delta
functions,
andthespectral characterization ofthe scanned photographicmaterialis known.
They
usedNewton'smethodtoestimatethedye densitiesof each colorpatch withthe transparent film'sspectral characterizations ofthedye accordingtoBeer's
law. Beer's law20'21 statesthat the
density
spectrum of a color patchislinearly
relatedtotheconcentrationsofthedyesand itsspectraltransmittancecanbe reconstructed with the
density
spectrum asfollowing:K(k)
=ko(A.)
+Ci ki(X)
+C2 k2(k)
+C3 k3(A,)
+... +Cn kn(X)
T(A.)
=I(X)/I<A)
=e-Kft)where
kr/A,)
isthe spectraldensity
ofthebaseandkn(A)
istheunitabsorptivity spectrumofthenthdyeinthematerial.
Cn
isthe associated concentration of eachnthdye.Io(A)
isthefactor. For a photographic material, the scanner's digital counts can be related to the
concentrations ofthe cyan,magenta andyellowdyes andthen thespectralinformation as
wellasthetristimulusvalues canbecalculatedaccordingly. More detail aboutBeer's law
is discussed inthe
following
chapter.RodriguezandStockhamappliedthespectral methodforaHell 3000series drum
scanner with a Kodak Ektachrome Q-60 test target. An iterative method was used to
estimatethe dyeconcentrations fromthescannerdensities.4-22 WiththeEktachrome dye
spectral
density
curvesprovidedby
the manufacturer, theestimated concentrations wereusedtoreconstructtheestimated spectrumbasedonBeer's law. Theestimated spectrum
was fed into scanner model equations to generate the predicted scanner densities. The
scanner model equations werebasedonthephysicalchannel responsivities ofthegraphic
artsscanner. The difference betweenthepredicted scannerdensitiesandtheactual scanned
density
readings was usedtocalculatetheincrementoftheestimatedconcentrations. Theiterative algorithm was based on the
theory
that when the concentrations are correctlyestimated, theestimated spectrum wouldbe identicalto theactualspectrum,therefore,the
difference betweentheestimatedand actual scannerdensitieswouldbenegligibleandthe
iterationcanbeended. Notethat thisiterationcriterionwas notbasedonCIE colorimetry
and the spectral
density
ofthebase, kn(A),
was notinvolved in the computation.They
achieved thecharacterizationforaverage
AE*ab
lessthan2 and maximum values oflessthan4.
Viggiano andWang5 appliedtheBouguer-Lambert-Beer modelto calibrateaflat
bedscanner with aKodak Ektachrome Q60Ctarget.
They
performedan extensive analysisto compensate for the scanner's nonlinear amplitude response function. The amplitude
response, sometimes referredto as "gamma
correction,"
wasincorporated
by
thescannermanufacturer to account for the nonlinearity
introduced
by
CRTs. As a result, theamplitude response function should be compensated when getting the actual sensor
readingsoftheobject
density
fromthescanner output.They
used a non-linearfunctiontomodel the amplitude response function ofa series of spectrally non-selective tiles. In
addition,
they
performedaprincipal component analysis onthedensity
spectra of all thepatchestoobtain the spectral curves ofthedyeset ratherthanusing datasupplied
by
themanufacturer. An ordinary least-squares algorithm was used in predicting each patch's
concentrations withthe derivedeigenvectorsfromthe principal componentanalysis. The
published characterization results were an average
AE*ab
of4. 1 anda90thpercentile of6.2. Besides the procedural difference in estimating the concentrations (least-squares
algorithm versus iterative algorithm), the fact that Viggiano and
Wang
performed theirexperiment on a flat-bed CCD scanner while Rodriguez and Stockhamused a high-end
drumscannercontributedto thelargeperformancedifference.
At the current state-of-the-art, all these published characterization results as
summarizedin Table Iare stillintherange of average errorslargerthan 1
AE*ab
unit withthemaximumerrors largerthan3
AE*ab
units.Stokes,
etal23foundthat the perceptibility
threshold for images is around 2
AE*ab
units on average.Therefore,
to have thecolorimetric errorintroduced
by
thescanningoperationnottobeperceptible,itrequiresthemaximum characterization error ofthe scannertobe around2
AE*ab
units.Meanwhile,
sincethe scanner operationisthefirstelementinthecolor reproductionchain,it isdesirable
to
keep
the average characterization error as small as possibleto preventthe errorfromofthis thesis was to achieve highercharacterization accuracythan the published results
summarizedin Table I.
Method Author Avg.
AE*ab
Max.AE*ab
3
by
3 WandellandFarrell8 4.9 13.63
by
3 WandellandFarrell8 3.6 13.13
by
(3+1)
WandellandFarrell8 2.4 6.23
by
(3 +1)
WandellandFarrell8 1.7 6.23simulatedfilters VrhelandTrussell13 2.3 10.7
4simulatedfilters VrhelandTrussell13 0.4 1.3
5 simulatedfilters VrhelandTrussell13 0.3 1.4
Stepwise Polynomial North9 2 N. A.
3
by
3+Gray
Balance Kang2 2.8 N. A.3
by
6+Gray
Balance Kang2 2.5 153
by
14+Gray
Balance Kang2 1.9 N. A.1storder reg. Hung11 4.7 12.9
2nd order reg. Hung11 2.8 8.2
3rdorder reg. Hung11 2.2 7.8
5*5*5 LUT Hung11 1.1 9.9
3
by
6(SSXYZ)
Berns3 3.6 22.13
by
9 (SSXYZ)
Berns3 2.5 12.53
by
9 (SSLab)
Berns3 1.8 8.83
by
9 (SS .33)Berns3 2.4 9.2
3
by
3Polynomial Clippeleer11 2.5 9.03
by
8Polynomial Clippeleer11 2.0 9.53
by
27Polynomial Clippeleer11 1.5 5.03
by
64Polynomial Clippeleer11 1.0 3.5Spectralmodel ViggianoandWang5 4.1
6.2(90%)
Spectral model Rodriguezand
Stockham4 <2 <4
3.
Scanner
Characterization Process
Inthegraphic arts color reproductionprocess,photographic materials arepresented
astheoriginal. Thescanner characterization methodinthis thesisutilizes thecolorimetric
andspectralproperties ofthephotographic materialtoformthebasisfor characterizingthe
original. An analytical method is used in material analysis to decompose the spectral
informationofthetargetmaterialintounit absorptivities oftheprimarydyes. Thescanner
istreatedas an
imaging
densitometer enablingtherelationshipfromthescanner readingsby
thescannerto thedyeconcentrations ofthe targetmaterialtobemodeled. Thismodelis
then usedtopredictthedyeconcentrationsfromthescanner's digitalreadings for images
having
the same dye set. The predicted concentrations can be used to recompose thespectral datawiththeunit absorptivities ofthedyes. The spectral data is
finally
used tocalculate colorimetric parameters of the original for defined observers and illuminant.
Color differencescanbeassessedbetweenthemeasured andthepredicted colorimetricdata
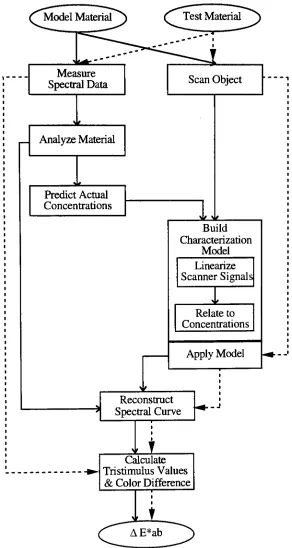
toevaluate themodel performance. Anobject-oriented representation ofthedata flow is
shownin Fig. 3-1. To havean objective performanceverification,anindependentoriginal
Scanner Digital Counts
J
c
CMYConcentrations
f
Spectral CurvesJ
c
TristimulusValues [image:31.571.114.246.84.330.2]Color Difference Values
FIG. 3-1. Overall dataflowofthecharacterization method.
3.1 Material
Analysis
Therearetwogeneraltypesof photographic materials: transparentandopaque. As
shown in Fig.
3.1-1,
the optical property of the material determines its viewing andmeasurement conditions. The transparent material is viewed and measured with 0/0
geometry. Theopaquematerialis viewed and measured withd/0geometry.
Hence,
thereare different spectral models for each kind of material based on the Beer-Bouguer
theory20-21
andtheKubelka-Munktheory,20'24"26respectively.
T
Transparency
isviewed under0/0geometryOpaquematerialisviewed
underd/0 geometry
FIG. 3.1-1. Optical geometryoftransmittanceand opaque materials.
3.1.1 Spectral Model - Transparent Material
The Beer-Bouguertheory20'21
states that the
intensity
of abeamofmonochromatic light i passing through a transparent material of thickness X suffers a weakening ofintensity, di,
thatisproportionaltoits intensity:di /dx=- K i
,
(D
where K is the absorption coefficient of the material. Integration of this differential
equationovertheentirethicknessofthematerialgives
ln(I/I0)
=ln(Ti)
=-KX,
(2)
or
I /
10
=Ti=e-KXwhere
Lj
is theintensity
ofthemonochromatic light before passingthrough thematerial;afterpassingthroughit is I. Ti istheinternaltransmittanceofthematerial.
For material with n layers ofdifferent colorants with asingle base substrate, the
totalabsorption,
K,
of unitthicknessX becomes:K=
kt
+Ki
+K2
+ ... +Kn
,
(4)
where
kt
is the absorption of the substrate without colorant, andKi,...,Kn
are theirrespective absorptions ofn colorants. With thefurther assumption that the unitspectral
absorptionproperties of eachdyeareinvariantwithconcentration,Eq.
(4)
becomes:K=
kt
+ciki+c2k2 +... +cnkn,
(5)
where
kt
is the absorption of the substrate without colorant, ci,...,cn are scalarsrepresenting amount oftheconcentrations ofthevarious colorants, andki,...,knaretheir
respective unitabsorption coefficients. Further expandingthedomain frommonochromatic
light tochromatic
light,
variablesT, Io,
I and K become functions of wavelength(A)
asfollow:
I/I0(A)=Ti(A)
_
e-(kt(X)+Cl kl(k)+ C2k2(X,)+...+ Cn kn(A,))
}
(g)
Equation
(6)
formsthebasisofthespectral analysisfortransparentmaterials.Since onlyphotographicmaterials are presented astheoriginal, several assumptions
are made specifically about this material in order to be applicable to the Beer-Bouguer
theory:27
Noopticalscattering,
No
fluorescence,
Refractive index
discontinuity
between material and air is not significantlyinfluenced
by
thevariationofthedyeconcentrations.The reversal film after processing can be considered as a transparent medium
consistingofcyan, magentaandyellowdyescoatedon abasegelatin.
According
toBeer-Bouguer
theory
andtheprevious statedassumptions,theinternaltransmittanceof a reversalfilmcanbe describedasfollow:
Tj(A)
=e~(ks^
+ cckc^
+ Cmkm(A)
+cyky(A) )
?,ys
_ e-kg(X.) * e-(cc
kc(A.)
+ cmkm(A,)
+Cyky(A.)
) /o-vwherecc,cm andcy aretheconcentrations and
kc(A),
km(A)
andky(A)
aretheunitspectralabsorptivities of cyan, magenta and yellow
dye,
respectively.kg(A)
is the spectralabsorptivity of the base and can be separated out as the base transmittance, Tg(A).
Assuming
thechangeof refractiveindex betweenthebasematerial and airisnotinfluencedby
differentamount ofdyeconcentration,themeasurement ofTg(A)
wouldbethenetbasetransmittance
including
therefractionfactor. Thetotal transmittanceofthetransparentfilmbecomes:
T(A)
=Tg(A)
* e~(cckc(^)
+ cmkm(^
+cyky^ )
,
(9)
Further
dividing
Tg(A)
andapplyingthenatural logarithmfunctiononbothsides ofEq. (9):K(A)
=-ln( T(A)
/Tg(A)
)
=Consequently,
anygiven spectraltransmittanceofa coloronthefilm canbe decomposedintoalinearcombination ofthedyeconcentrations anditsrespectiveunit absorptivity.
3.1.2 Spectral Model - Opaque Material
Themost common photographicreflectancematerialisphotographicpaper,which
has transparentdye layered on
top
of a paper base. The dye layer is considered as ahomogeneous layeroffinite thickness.
Scattering
occurs within the natural fiberpaperbase. Eventhough thepaperbaseisnotopaque,
by backing
thepaper withblackmaterialas recommended
by
CGATS.5-1993 standard,7the measurement of the paper base is
equivalentto themeasurement of a mediumthatisthickenoughtobeopaque. As aresult,
the photographic paperis considered as atransparent dye layer in opticalcontact with a
scattering,opaque support. This has been described in detail
by
Berns.28Kubelka and Munk24 described therelationship between reflectance
(R)
andtheproportionality constant of absorption coefficient
(K)
overscattering coefficient(S)
ofacoloredlayeroffinitethickness
(X)
applied on abackgroundofknownreflectance(Rg)
asshown in Eq. 1 1.
R_l-Rg(a-bcoth(bSX))
a-Rg+
bcoth(bSX)
where a= 1 +
(K/S)
and b= (a2-l)1/2. The symbol"coth"
is the hyperbolic cotangent
function and is defined as coth(bSX) =
[exp(bSX)
+ exp(-bSX)] /[exp(bSX)
exp(-bSX)]. For opaque materials, the thickness X is large enough to make the exp(-bSX)
negligiblecomparedtoexp(bSX). Eq. (1
1)
canthenbesimplifiedas:Roo=l+(K/S) [(K/S)2+2(K/S)]1/2,
(12)
Since onlyphotographic paperispresented astheoriginal,several assumptionsare
madespecificallyabouttheopaque materialinordertobe applicableto theKubelka-Munk
theory
asfollows:No
fluorescence,
Thescatter effect caused
by
thedye isnegligible,Refractive index
discontinuity
between material and air is not significantlyinfluenced
by
thevariationofthedyeconcentrations.When assumingthe scatteringcoefficient S inthedye layer is allowedto approachzero,
Eq.
(11)
becomes:R=
Rge-2KX,
(13)
whichisverysimilartoEq.
(3)
describing
theBeer-Bouguertheory.However,
it is notedthat the Beer-Bouguer
theory
is defined for collimated light (0/0 geometry) while theKubelka-Munk
theory
is defined for diffused light (d/d geometry).20-27Sincethe
Rg
ismeasured onthefinishedpaperbasewithminimumdyeconcentration,theinfluence ofthe
refractive index
discontinuity
between the paper and the air wouldbe built into theRg
measurement automatically. Inaddition, the thicknesstermX in Eq.
(13)
canbeeliminatedsince it is constant for given photographic paper. The spectral absorption ofthe
dyes,
K(A),
is derived as a functionof spectral reflectance factorby
the inverseofEq.(13)
asfollow:
Given that the photographic paper is a continuous-tone material, it is assumed that the
absorption properties of a given area arethesum oftheabsorption propertiesofeach ofthe
cyan,magenta andyellowdyes:
Kmixture(A)=
Kc(A)
+Km(A)
+Ky(A)
,(15)
With furtherassumptionthat theunit spectral absorption propertiesofthedyesareinvariant
withconcentration,Eq.
(15)
becomes:K(A)=cc
kc(A)
+cmkm(A)
+cy ky(A.)
,(16)
wherecc, cm,
cy
arescalarsrepresentingamountoftheconcentrationofcyan,magentaand yellow dye respectively, andkc(A), km(A)
andky(A)
are their respective unit absorptioncoefficients.
Combining
Eq.(14)
andEq.(16)
together,thespectral reflectancedatacanbedirectly
relatedto thelinearcombinationofthedyeconcentrations andtheirrespective unitabsorptivities,as follows:
- 0.5
ln( R(A)
/Rg(A) )
= cckc(A)
+cmkm(A)
+cy ky(A)
,(17)
or
R(
A)
=Rg
(A)
* e"2( cckc^>
+ cmkm(x>
+yky(^
) .(18)
Eq.
(17)
formsthe basisofthespectral analysisforopaquephotographic materials.3.1.3 Derivation of Unit Absorptivities
The fact thatthe spectraldataofevery color onthephotographic material can be
transformedintoalinearcombination ofits primary dyes'
absorptivitiesandits respective
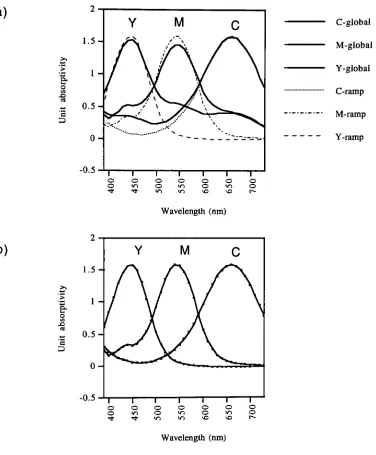
concentration provides afirm basis forstatisticalanalysis. Principalcomponent analysisis
concerned with explaining the variance-covariance structure through a few linear
combination oftheoriginal variables (oreigenvectors).29
Consequently,
theprimarydyes'absorptivities ofthematerial areessentially theeigenvectors andtheconcentrationsofthe
dyesaretherespective scalarforeachvariableinthelinearcombination.
Whenasamplingpopulationisuniformly distributed fora photographic material's
color gamut, the eigenvectors from the principal component analysis would depict the
variation vectors among all the samplings from their mean.
Ideally,
these "global"eigenvectors should resembletheprimarydyes' absorptivities since what makes thecolor
different is justtheconcentrationdifferencesoftheuniquedyes inthe material.
However,
principal component analysis
traditionally
tends to draw maximum explanation of thevariationofthefirsteigenvectorbeforefurther
deriving
consequenteigenvectors; thereisno guaranteethatalltheprimary dyeswillbetreatedequally in
deriving
theeigenvectors.Fortunately,
there are rotationoptions29-30availableinseveral statistical software
packages. One particular option is "equamax rotation", which equalizes the variance
betweeneach eigenvector. Howeverasindicated
by
Berns,27 thereis significantunwantedsecondary absorptions in the global eigenvectors, which may be introduced
by
the"equamaxrotation"
tocompensatetheunevensampling ofthe colorgamut. As a result,
further correction is needed. Separate analyses are performed to estimate each dye's
eigenvector(and
hopefully
its absorptivity) one at atime,by
sampling along one singleprimary with aminimum presence of other primaries. These three
"local"
eigenvectors
theoreticalspectral models and actual
behavior,
theselocaleigenvectorsdonotrepresenttheglobal variationfortheentire gamutpopulation.
A combined method was used
by
Berns27where the global eigenvectors were
rotatedto match thelocal eigenvectorsminimizing sumofsquareserror. Since thelocal
eigenvectors are defined
by
the primariesindividually,
the rotation from the globaleigenvectorsto the localeigenvectors removes theunwanted secondary absorptionwhile
preserving therepresentation oftheglobal variation. Multiple linearregression17
canbe
used:
b=(XTX)-1XTY
(19)
Y =XbwheretheYmatrixcontains the threelocaleigenvectors andtheXmatrix containsthe three
global eigenvectors. The 3*3 b matrix is the rotation coefficients from the regression
analyses and theestimatedmatrix Y are the resulting finaleigenvectors to describe the
absorptivities oftheprimary dyes.
3.2
Prediction
ofActual Concentrations
An analytical method was used to determine the concentrations needed to
colorimetrically match each color. This type of method is commonly referred to as
computer colorantformulationandhas been
long
usedinthepaintmatchingindustry
withsatisfactoryresults.20-24-31 This analytical method estimatestheconcentration mixture of
the colorants with a numerical computation algorithm until the predicted and actual
tristimulusvalues are within a specified goodnesslevel.
Allen20 has
described
a tristimulus matching algorithm for matching opaque
samples or clear samples based on a pseudotristimulus match and Newton-Raphson
iteration. In Allen'salgorithm, itfirstestimatesinitialconcentrationsby:
c= (WDO)'WDf
,
(20)
where c is the scalarmatrix ofthe colorants; in thisthesis, cc, cm and
cy
are scalars ofconcentrationtoeach ofthe cyan,magenta and yellowdyeunit absorptivities as
c= Cc
Cm
Cy
(21)
Wx,
Wy
andWz
are the ASTM tristimulus weights7 fora given CIE observer and
illuminantcombination:
W=
Wx(Al)
. .Wx(A.)
Wy(Al)
. .Wy(JL)
Wz(Ai)
. .Wz(A.)
(22)
D is the multiple-linear regression weighting matrix, which is the partial derivative of
reflectanceortransmittancewith respectto absorptionforopaque ortransparentmaterials:
D=
'd(Ai)
00
d(Xi)
0 0
0
0
d(A)
(23)
O isthe matrix of unitspectral absorptivities
k(A)
foreachcyan, magenta and yellowdyeo=
kc(Al)
km(Al)
ky(Al)
kc(/Ln)
km(Ao)
ky(An)
(24)
fis thegivenspectral absorptivity
K(A)
ofa standard color. Inthisthesis, f iscalculatedfromthe spectral measurement ofeach color
by
Eq.(14)
for opaque materials orby
Eq.(10)
fortransparentmaterials:IVstandard(/tl)
f=
Kstandard(An)
(25)
The firstestimationoftheconcentrations(Eq.
20)
are usedtocalculatethespectraldataandthen tristimulus values. Subsequentiterations
by
means ofthe Newton-Raphson methodcanimprovetheprediction results towarda closer match and stopthe iteration when the
tristimulusdifference have becomesmallerthan some goodness parameter. The iteration
algorithmis:
Acra
Ac,,
=
(WDO)
AXAY
AZ
(26)
c=
cc+Acc
cm +
Acn
c +
Ac,,
(27)
Thegoodness parameterinthis thesiswas set as follows:
[(AX)2+(AY)2
<0.001
,
(28)
wheretheperfect reflectancediffuser hasaYequalto 100.
Similartristimulus matching algorithms wereproposed
by
Ohta.32'33 except thathis algorithm does not require spectral data of the standard. Both Allen's and Ohta's
algorithm can be traced back to the pioneering work of Park and Stearns.34
Lately,
Berns27 has applied Allen's algorithm in
predicting the dye concentrations of thermal
transferpaperwith good results.
3.3
Building
Characterization
Model
The
key
issue inbuilding
thecharacterization model is how torelate the scanneroutput to the actual concentrations. With the primary dyes' absorptivities, each color's
spectraldistributioncanbe first decomposed intotheconcentrations oftheprimary dyes
by
the tristimulusmatching algorithm. Ifthescanner's sensor spectral responsivities arevery
narrow,the naturallogarithmofthescanner'sdigitalcount readings canberelatedfromthe
integral density35 to the analytic densities ofthematerial's atthe specific wavelength as
follow:
Ja"
-ln(j
T(X)
S(X)
s(X)dX) =-ln(T(X)-
5(A)-s{X)\
dX)
,(29)
where
T(A)
isthespectraltransmittanceorreflectanceoftheobjectpropertyreceivedby
theresponsivity. The integral ofthe product of
T(A-),
s(A) andS(A)
is actually the scannerchannel reading.
WhenthebandwidthdA is verysmall,
T(A),
s(A)andS(A)
are not changedwiththevariance of
A.
SinceT(A),
s(A) andS(A)
are constant terms in theintegral,
they
can bemoved outside theintegral andEq.
(29)
becomes valid. As described in Eq.(2)
andEq.(5),
the -ln(T(A))is actuallythetotalabsorptionK(A),
whichisalinearcombination oftheproducts of eachprimarydye'sconcentrationwithits unitabsorptivity . As aresult, after
applying the natural logarithm transformation on the scanner digital counts, these
transformeddigitalvalues are
directly
relatedto thedyeconcentrations oftheprimary dyes.Fromthiscorrelation,a
training
model canbe derivedtorelatethescannerdigitalcountstothe material's concentrations. However inreality, the scanner sensor responsivities may
not be narrow enough such that theintegral interval dA is wider and
T(A),
s(A) andS(A)
are not constants in the integral.
Consequently,
Eq.(29)
does not hold and non-linearfunctions are needed to describe the relationship between the integral
density
and theanalyticdensities.
Two steps are taken to derive the characterization model. The first step is to
linearize the scannerdigital counts to the concentrations ofthe spectrally non-selective
colors. Thesecondstep is torelatethelinearized digitalvalues to theconcentrations ofall
colors considering the possible cross-talkbetween the scanner's channel responsivities.
Combining
these two steps together, thescanner digitalcounts canbetranslatedinto theconcentrationsofthe targetmaterial.
3.3.1
Linearizing
Scanner
Signals
Thepurposeofthelinearizationprocessisto
independently
relatethe red,greenandblue digital counts torespective cyan, magenta andyellow concentrations. This can be
achieved
by
regressingthescanner readings withtherespective concentrationsofthenonselective colors.
However,
the red, green andblue scanner readings (denoteddr,
dg
anddb)
are not alwayslinearly
related to the material's concentrations. Fig. 3.3-1 is anexample plot ofthe scanner sensor readings (normalized between 0 and
1)
against theconcentrations of agroupofspectrallynon-selective colors.
u Q
Normalized ScannerReading
FIG. 3.3-1. Plots of normalized scanner readings against concentration readings for
Itisclearthatatransformationfunction isneededtolinearizethescanner readings
withthematerial concentrations. Stepwisepolynomial regression canbeusedtoderivethe
linearizationfunctionas:
P
=(XTXrXTY,
D=
[P0
A
p\ p\ft
][!
Nd
N]
N]
N* N'f.(30)
where X is the 5thorder matrixof
Nd
andNd
is thenormalizedscannerdigitalcountinnatural
log
transformation. Y is the concentration matrix of spectrally non-selectivecolors. D isthepredictedlinearized digitalcount. Note that
/J0
termis needed tomodelthepossibledarkcurrentinthescannersystem.
3.3.2
Relating
Scanner Readings to ConcentrationIdeally,
ifthe scanner's sensor responsivities are narrow enough, the scanner'sreadings wouldbethe linearcombinations ofthedyes' concentrations. Afterthe scanner
digital counts are transformed through the linearization process, a simple 3
by
3transformation shouldbe able to relate the transformed digital values to the actual dye
concentrationsasfollow:
(3= (DTD)-1DTC ,
Per
P,
"A"
Hmr
Pmg
/L,
D,
Pyr
K
P,b
A.
(31)
where the
ft
terms are derivedby
regression.Dr,
Dg
andDb
are the transformed red,green and blue scanner readings.
Cc
,Cm
andCy
arethe predicted cyan, magenta andyellowconcentrations ofthe targetmaterial.
However in reality, the scanner's channel responsivities are not always narrow
enoughto be
totally
linearly
independent. Unwantedcross-talk could existbetween thescanner's channel responsivities. Stepwise regression with higher order polynomial
equationisusedtomodelthenon-linearrelationbetweenthetransformeddigitalvalues and
the material concentration
including
thecross-talk. Second order polynomial terms plusr*g*b crosstermare oftenusedinthemodel. Themodel coefficientsforeachindependent
variableina matrixform isasfollows:
p
=[ft
ft
ft
ft
ft.g
ft.
ft,fr
ft.r
ft.?
ft.
ft.4
Following
thestepwiseselection,some ofthesecoefficients will equal zero.3.4
Model
Verification
Nowthatthescannerdigitalcountscanbetranslatedintothedyeconcentrations
by
thecharacterizationmodel,it ispossibletoreconstructthespectraldataofeach objectcolor
with the unit absorptivities ofcorresponding dyes
by
Eq.(9)
orEq.(18)
describedin thematerial analysis section. With the reconstructed spectral
data,
the model-predictedcolorimetric properties ofthe targetmaterial canbecompared withtheinstrument-measured
data. CIELAB colordifferences canbegenerated to assessthe model performance. The
complete process flow ofthecharacterizationmethodis summarized
by
the solid arrowThroughout the derivation of the characterization model, the spectral data
measurement, thematerial analysis, andthe scanningoperation are all doneon the same
targetobject. Itis doneso astoprovideaconsistent groundforthemodel
training
process.However inreal-life applications,a characterizeddevicehastowork well withindependent
data.
Consequently,
an independent object of the same photographic material wasprocessed through this characterized scanner system. The colorimetric information
generated
by
thescanner systemiscomparedwiththemeasured colorimetricinformationofthe independent test target. This colorimetric difference data shall serve as the most
objective way inverifyingthe modelperformance. Theprocess flowofthe independent
verificationisshowninthedotted lines in Fig. 3.4-1.
Measure Spectral Data
_ Analyze Material
Predict Actual Concentrations
Scan Object
\l/ w
Build Characterization
Model
Linearize ScannerSignals
Relateto
Concentrations
Apply
ModelReconstruct
Spectral Curve
Calculate TristimulusValues
& Color Difference
1
AE*ab [image:48.571.140.432.82.630.2]3.5 Comparison
with prior spectral methodsThemain resemblancebetweenthe scanner characterization methodofthis thesis
andpriorspectral methods(ViggianoandWang,5RodriguezandStockham,4-22
)
is theuseof spectralmodels.
However,
thereare several majorfundamentaldifferences. Viggianoand
Wang
used the results from a principal component analysis ofthe globaldensity
spectra as thematerial's unit absorptivities with whichtheconcentrations were estimated
with a general least-square algorithm. Rodriguez and Stockham used manufacturer
provided spectralabsorptivities andapplied an iterativemethodbasedonthematchingof
the scanner
density
readings to predict the actualconcentrations. The characterizationmethodinthis thesisderived theunit absorptivities withtheglobal andtheramp spectral
dataofthe actual target andtheprediction oftheconcentrations is based on aniteration
method with the tristimulus matching algorithm, which guarantees atrue visual match.
These differentmethodsresultin differentmodel performance.
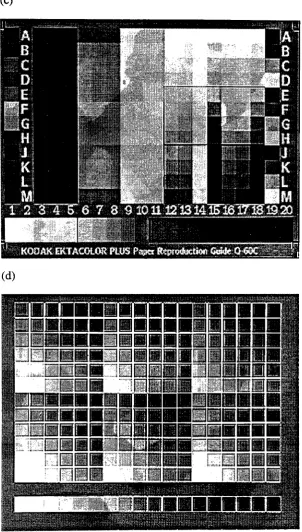
4. Experimental
4.1 Target
Objects
Both opaque andtransparent materials were selected as the target objects in this
thesis. As described
by
McDowell,36 since the color reproduction in the graphic artsindustry
ismostly basedon several typesofphotographic materials,it is thenpossibletodefinethe spectral rangeofthereproductioncolorwith severalparticulardyesetsamong
the photographic materials. Based on this characteristic, ANSI/IT8 committee has
completed two standards IT8.7/1 and IT8.7/2 for input scanner calibration with
transparentfilms andphotographicpaperproducts, respectively. SincetheseIT8.7targets
are
becoming
the industrial standard reference in device characterization,they
wereconsequentlyadoptedasthe targetobjectsfor
building
thecharacterization models.There are certain limitations when using these the IT8 targets. One is the gray
balance ofthe neutral colors. Since thecolors on theIT8 targetare composed
by
threespectrally selective
dyes,
not a singlespectrallyneutraldye,
anyminuteoff-balance amongthe threedyeswill altertheequilibriumoftheneutralgray, resulting ina colortint. As a
result, the neutral scale is not always withoutany chroma. Another limitation is that the
reproducible gamut range is confined
by
the dye sets.Any
color beyond the linearcombination of the three primary dyes is not represented in the target's domain. In
addition, uniformity,stability andnon-fluorescencearefactorstobeconsidered.
In this thesis, Eastman Kodak
Company
Ektachrome Q-60E1(IT8.7/1)
and FujiIT8.7/2 andKodak Ektacolor Q-60Cwere used asthereflectiontargets. Independenttest
targetswere createdwith a6x6x6 digital factorial design samplingand 18 levelsof neutral
patches. Theseindependenttargetsweregenerated withthesame photographicmaterialsas
the standard IT8 type targets. Throughout this
document,
the numbering order for thecolors on eachtargetwas from the
top
to thebottom starting from the leftandlastly
thegraypatchstartingfromthe left. TheportraitimageontheKodakIT8targetwas notused.
Sampleimagesofthese targetsare shownin Fig. 4. 1-1
4.2
Metrology
andColorimetry
Thecommitteefor Graphic Arts TechnologiesStandards
(CGATS)
was accreditedby
theAmerican NationalStandards Institute in 1989toserve asthecoordinator of graphicarts standards activities. As aresult, theCGATS.5-1993 standard,7"Graphic
technology
-Spectralmeasurementand colorimetric computation forgraphic arts
images"
prepared
by
CGATS
Working Group
4,
was approvedby
theAmerican National StandardsInstitute,
Inc. onMarch
22,
1993tospecifyamethodology forreflectanceandtransmittancespectralmeasurement and colorimetric parameter computation for graphic arts images.
Consequently,
the CGATS.5-1993 guidelines is followed throughout this thesis whenpossible.
(a)
fctfyVrf"ffr'*"""'"'"' i'
*..-:...-i.t- -'- ',fi" r' "
^11' -i
--' --i'i'-' '
ium'-|V.
WK !:,?"
H
^.ty^^MM^MiliM^^lS^MM M "llll 1?^.L.
''
M MilllllMMIH.MMIllll IIiII ',
'
[i^ . imwsi$. ""
-MUOiri.^Sr^-'ie^V.'J
(c)
^KOOJJ^EKTAOHjORmiSP^'RtpradWtion Gewfe-O-SGC
(d)
FIG. 4.1-1. Sample images ofthe targetmaterials:
(a)
KodakIT8.7/1,
(b)
FujiIT8.7/2, (c)
Kodak Q-60Cand
(d)
independenttest target. [image:53.571.105.408.87.620.2]The CGATS.5-1993 standardis based on CIE illuminant D50 and the CIE 1931
standard observer as defined in CIE publication 15.2. The spectral data are collected
between 360nm and780nmineither 10nmintervalsand20nmintervals. The weighting
values representing the product ofilluminant and standard observerfor 10 nm intervals
accounting for bandpass as described
by
ASTME-308,
which isused in this thesis, are listed in Appendix A. It is noted thatifthemeasured spectral data are at a wavelengthgreaterthan360nm, alltheweightingvalueslessthan the firstmeasured wavelength shall
be summed and added to the weighting value for the firstwavelength measured. Ifthe
measured spectraldataare at a wavelengthlessthan780nm,alltheweighting valuesless
than thefirstmeasured wavelength shallbesummed and addedtotheweightingvaluefor
thelastwavelengthmeasured.
4.3 Spectral
Measurement
4.3.1 Transparent Target
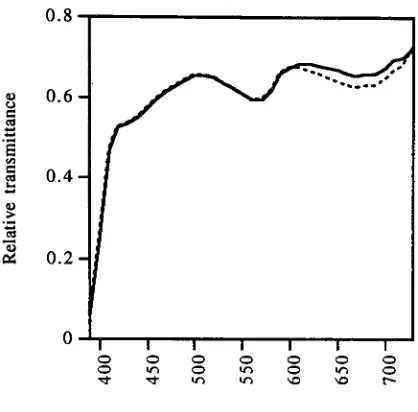
The spectraltransmittance factorof eachtransparent sample wasmeasuredwith a
Photo Research Spectrascan PR-703ASpectraradiometerin DuPont
Printing
&Publishing,
ADIP
Group
Color Laboratory. The PR-703ASpectraradiometermeasures intherange of390 nmto730 nm with 2 nmincrement and5 nmbandwidth. A diffraction grating and
multi-element photodetector comprise the system.37 A tungsten halogen
lamp
with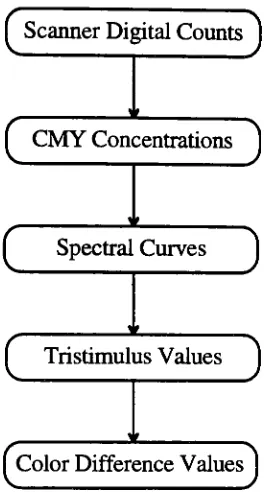
![FIG. 5.1-16. Vector plots of [a*, b*] and [Aa*, Ab*] values of the measured and predicteddata from (a, b) 3 by 3 model (12-bit scan), (c, d) 3 by 1 1 model (12-bit scan) (e, f) 3 by1 1 model (8-bit scan) of the Kodak IT8.7/1 target's c, m, y, r, g, and b ramps.](https://thumb-us.123doks.com/thumbv2/123dok_us/115022.11003/85.571.69.477.79.570/vector-plots-values-measured-predicteddata-model-kodak-target.webp)