Fostering Downtown Living:
Overcoming Financial Barriers to Downtown Residential
Development
2 Table of Contents
Abstract... 3
Introduction... 4
Organization ... 6
The Case for Downtown Residential Space... 7
Land Use and Land Value Dynamics... 7
Why Build Residential Space? ... 9
Decline and Resurgence of Central Cities... 12
Strategies to Incorporate Residential Growth Downtown... 15
Methodology... 18
Case Studies of Two Current Programs... 19
Houston Downtown Living Initiative – Tax Abatement ... 19
Overview of Policy... 21
Implementation and Impact... 23
Analysis of Policy... 27
Washington, D.C. – Zoning and Bonus Density... 29
Overview of Policy... 30
Implementation and Impact... 33
Analysis of Policy... 36
Hypothetical Project Analysis: Washington, DC Property ... 40
Scenario... 41
Assumptions... 42
Base Case... 45
Applying a Tax-Based Policy... 46
Applying a Zoning-Based Policy... 49
Conclusion ... 53
Bibliography ... 57
Appendix ... 60
Appendix A: Overview of Base Scenario for Downtown Development Appendix B: Applied Policies
3
Abstract
This paper seeks to evaluate local government policies to promote the
development of residential space in center city downtowns. Specifically, it aims to
outline two common policy approaches and analyze the financial and regulatory
impact of those policies in the context of local market dynamics. Houston and
Washington, DC serve as case studies to examine tax abatement and zoning
strategies, respectively. Additionally, financial analysis of a hypothetical project is
used to allow for the direct comparison of these policies and their effect on various
parties. Based on the findings of this report, market conditions for residential space,
public finances, and the local political climate are particularly important in
determining the most applicable policy for a city looking to promote downtown
4
Introduction
The past two decades have seen a resurgence of growth in major cities across
the United States. After years of decline and population loss in places like
Washington, Denver, and Philadelphia, these cities saw their populations stabilize
and begin growing again. Between 2010 and 2011, growth in center cities of metro
areas in the U.S. outpaced that of their outlying suburbs for the first time in more
than nine decades (Frey, 2012). Primary to the resurgence is the continued
revitalization of downtown areas. A central component of this revitalization is the
inclusion of residential units, which help bring with them street activity, vibrancy,
and a sense of community (Birch, 2000).
In addition to the desire of residents for walkable downtown living,
municipalities also have a strong interest in promoting the development of
downtown housing. In doing so, they work to increase their economic and social
wellbeing through enhanced regional competitiveness and quality of life. Creating
vibrant neighborhoods where people desire to live, work, and play is widely seen as
a key to attracting employers and investment dollars to an area.
Oftentimes, despite the municipal desire to encourage housing downtown
and a demand for units there by residents, there exists a lack of housing in
downtown areas. This is particularly true in well-established cities that have
retained a strong employment center. Financial barriers due to land values or
pricing for CBD office space make residential projects financially infeasible or
uninteresting to a developer who does not see it as the most profitable use of land.
5
benefits to be gained in transforming nine to five neighborhoods into more active
“18 hour” or “24 hour” areas.
A number of cities have recognized this issue and sought to address it in
some capacity. Since the 1990’s, city leaders from across the country have
implemented strategies to incentivize and promote the development of downtown
housing. Approaches range from office space conversion to new construction and
methods of making financing more attractive through the use of tax abatements,
bonus density offerings, and various other subsidies (Birch, 2007). However, while
these various systems exist, few have explored the topic in the context of how a city
looking to increase residential space downtown may approach it from a financing
perspective. Little information exists on the overall effectiveness of these policies,
both in considering the cost to municipalities (via subsidies, incentives, or other
means of financial support) as well as their success in actually creating new
residential spaces.
This paper seeks to provide context to evaluating public involvement in
promoting residential space downtown. Specifically, it aims to address the following
questions:
What are the most common finance tools or development policies that are
employed when trying to implement a downtown residential strategy?
How effective have strategies put in place by municipalities been in creating
new residential space? Are certain strategies more cost effective than others?
6
In doing so, this report will provide a better understanding of the complexities of
downtown residential space and provide a base from which to assess how
municipalities can evaluate the most effective means to further downtown
residential growth.
Organization
This report begins by examining the concept of bid rent and spatial land use
patterns to understand market behavior and financial barriers to downtown
residential financial feasibility. I then outlines the benefits of downtown residential
space, looking specifically at why a municipality would be interested in incentivizing
it. To provide historical context, I will examine the evolution of downtowns,
highlighting their decline in the latter half of the twentieth century and resurgence
as centers of regional activity in recent years. With this understanding, I will then
look at case studies of policy approaches used by two cities, Houston and
Washington, DC, to address these financial barriers and promote an increase of
residential units downtown. Finally, I will work through a financial analysis of a
hypothetical project in Washington, DC to highlight the difference in value between
office and residential space under market conditions and evaluate the financial
impact of applied policies.
As a note, this report focuses only on the addition of market rate housing in
downtown areas. While affordable housing is an important tool in building more
equitable neighborhoods, particularly in downtown areas that tend to be more
expensive than other neighborhoods, its implementation involves policies,
7
The Case for Downtown Residential Space
Land Use and Land Value Dynamics
The American central citydowntown is typically the center of business
activity in a region. The Financial District in Manhattan or the Loop in Chicago
generally bring to mind images of corporate employees and large office buildings.
Office space is the dominant land use in these districts aside from retailers
occupying some ground floor space. Noticeably absent until recent years was a
concentration of residential units. Why has the growth of residential space not been
more prevalent downtown? The primary barrier is that the value of residential
space is lower than the value of office space in most downtown markets. Barring
some rare exceptions such as Vancouver, which has a particularly strong residential
market (Lazarus, 2005), office space can generally garner higher rents downtown
than residential space in the same location. This is particularly true in cities with
well-established and strong office markets.
Classical theory on land values via the bid rent model offers a relatively
simple explanation for the ability of office space to price out residential space. The
bid rent model looks at how land values and willingness to pay for land varies by
location, with the highest prices located in the downtown hub and prices steadily
decreasing as one moves further away from the city center (Alonso, 1964). In the
model, different land users (retail, office, residential, industrial, etc…) compete with
one another for land that is closest to the city center, as it is most accessible and
therefore theoretically the most desirable. Land is assigned to its highest and best
use, with each person considering the positive and negative attributes in locating in
8
property will gain control of the land for their desired use. As one moves further
from the city center, diminished value of land to core users allows other land uses to
occupy that space. Under the classical model, retail and office users are willing to
pay the most, or have the highest “bid-rent”, for space in the center of the city. This
makes sense considering that it is extremely important for these users to be
accessible to as many residents, employees, and other businesses as possible.
Beyond the center, manufacturers locate further out and residents beyond that.
A subsequent concept that built on bid rent theory is the sector model
developed by economist Homer Hoyt. Like the bid rent curve, the model distributes
land uses in a geographic area based on bid rent users are willing to pay (Hoyt,
1939). However, it differs in that it takes into account socioeconomic status of
residents, with different socioeconomic classes congregating on different sides of
the city. Still, the sector model, like bid rent theory, shows that resident locate on the
outskirts of the city while retail and office uses have the highest bid rent and occupy
the city center.
Edward Glaeser applies pieces of this theory to realities that exist within
markets in his article, “The Economic Approach to Cities”. He looks at labor and
housing as it relates to the economic model of the city, explaining the equilibrium
for supply and demand of housing and when fluctuations in that equilibrium allow
new housing units to be built. However, Glaeser considers housing as the singular
land use when evaluating housing dynamics. In reality, particularly within
downtown areas, housing is generally competing with other uses. Within any
9
to analysis determining when new housing is supportable given market demand.
Despite demand for housing, new supply may be impeded by higher values for
alternative land uses.
While land use is far more nuanced in reality than these models depict and
land use dynamics have changed over time with advances in technology and
evolving forms of transportation, the central idea behind these theories prove to be
an important point when considering land uses downtown: certain users are able
and willing to pay more to be in particular locations. However, it is critical to realize
that when land users are assessing their willingness to pay for a particular property,
they are only taking into account the value of the land to themselves. Their valuation
and subsequent willingness to pay for a property ignores community and economic
benefits that come with varied land use.
Why build residential space downtown?
Each year, the Urban Land Institute (ULI), in partnership with Price
Waterhouse Cooper, publishes a report on Emerging Trends in Real Estate. With the
release of the 2015 report, it named “The 18-Hour City Comes of Age” as the top
emerging trend. The report states:
“…deep into the evening the mix of shops, restaurants, and entertainment truly generates excitement. This is catalyzed by walk-to-work housing that encourages employers in the knowledge and talent industries to keep their offices downtown…the model has demonstrated that the right urban mix bolsters occupancy, density raises values, and that vibrancy attracts investment capital.”
This description varies significantly from the typical central city in America
10
“nine to five” environment comprised mostly of office and government uses, with a
small amount of retail to cater to office workers daytime needs (Leinberger, 2005).
Workers would come into the city in the morning from the suburbs, put in their time
in the office, and then leave at the end of the day. This meant small bursts of activity
for a short time twice a day, but little to no activity at night and on weekends.
However, as far back as the work of Jane Jacobs in the early 1960’s, city planners
recognized the benefits to vibrancy like that described above by ULI that mixed-use
pedestrian friendly development could provide. With a variety of buildings used for
different purposes, streets are more activated with people coming and going at all
times of day, a stronger neighborhood character can develop, and people tend to feel
safer with “eyes on the street” (Jacobs, 1961).
The ULI report makes an important connection between the relationship of
downtown residential space and office space, noting that downtown and downtown
adjacent housing incentivizes knowledge and talent industries to locate their offices
downtown. With the large number of millenials living in urban environments and
seeking housing a short distance from their job, companies that employ large
numbers of young and educated workers see a competitive advantage in locating
downtown. In doing so, they can attract top talent that is likely not interested in
working in a suburban office park. This bolsters the demand for downtown office
space, making downtown housing beneficial not only from a vibrancy standpoint,
but also to the broader downtown office market and economy.
A 2013 study of preferred office locations compared performance of various
11
locating in vibrant and amenity rich areas with a “live, work, play” atmosphere
(Malizia, 2014). The most direct comparison the study offers on vibrancy compares
single-use suburban office space to suburban office space in vibrant areas that offer
multi-use, walkable environments. Though the focus of the comparison is on
suburban spaces rather than downtown environments, it nonetheless offers a
comparison of spaces in which the primary difference is mixed-use vibrancy. Asking
rents for office space in mixed-use centers was found to be $3.39/sq. foot higher
than single-use office parks, a 14.6% difference. Additionally, vacancy rates in
mixed-use centers was 4.5% lower than equivalent single-use office parks. These
figures point to the strength of the office market in live, work, play environments,
with office tenants showing a willingness to pay more to be located in vibrant
centers. All things equal, there is reason to believe that vibrancy downtown also has
positive effects on the office market there. With the understanding that downtown
housing helps to promote vibrancy downtown and that vibrancy in turn can help to
create a stronger downtown office market, housing can be seen as an indirect but
important component for economic development. It is therefore in the interest of
local government to ensure that there is an adequate supply of downtown and
downtown adjacent housing.
Focus on the development of successful downtowns by city governments is
critical not only for the benefit to central business districts, but also because the
success of central city downtowns has broader economic implications on the rest of
the city and even metro area. Vibrant and active downtowns enhance the regional
12
(Leinberger, 2005). The success of suburbs is tied to the success of their central city
(Goetzman, Spiegal, Wachter, 1998). Housing markets in suburban areas are closely
tied to their central city, meaning that the success of downtown directly impacts the
success of the rest of the entire metropolitan area. Additionally, vibrant downtowns
project an image of the city to outsiders, which can also play an important role in
attracting employers and new residents to locate there.
Decline and Resurgence of Central Cities
In the wake of World War II, there was a huge demand for housing
(Moulton, 1999) across the United States. Beginning with the great depression in the
1930’s and continuing with the World War through the early 1940’s, very little
housing was built for almost 20 years. This created pent-up demand that, along with
a rapidly growing middle class, provided for the foundations of a building boom.
However, for a number of reasons, the shape of development that occurred during
this time was far different from the existing environment. The most notable change
from the prior building boom of the 1920’s was the widespread adoption of the
automobile, which enabled people to move to less expensive and newly built tract
housing beyond city limits in the suburbs while still having relatively easy access to
the city. At the same time, restrictive mortgage policies on the part of lenders
favored these new suburban homes over city dwellings and federal housing policies
were structured to promote homeownership, which was generally more attainable
in the suburbs. Lastly, tense race relations hastened “white flight” from cities out to
the suburbs, particularly in the 1960’s after riots following the death of Martin
13
To clarify, residential space historically was not concentrated in downtown
itself (Birch, 2009). Rather, residential neighborhoods were most often located
adjacent to and nearby downtown. For example, sociologist Gerald Breese noted in
the 1940’s that the six thousand residents of the Loop in Chicago paled in
comparison to the more than one million people that came to the Loop each day to
work or shop (Breese, 1949). Still though, residents in these adjacent
neighborhoods could easily get to the downtown concentration of office,
commercial, and entertainment space.
As people moved beyond city limits and into the suburbs, retailers began to
follow. Department stores, whose flagship location had almost always been located
in central downtown locations, began opening new branch stores in the suburbs to
be closer to customers (Birch, 2009). Suburban shopping malls quickly became the
new center of retail in a metro area, giving people who did not work downtown little
reason to go there. Downtown office space fared somewhat better during this time
than retail space due to the need for many industries to be located close to
government and other businesses that were also downtown, but cities still lost
share of office space to suburban locations over time.
Cities began to recognize the outflow of population and seek strategies to
help reverse the losses. In considering the prevalence of automobiles, city leaders
sought out means to better accommodate cars downtown. Many central cities were
able to take advantage of funding from the Federal Highway Act (1956) to construct
freeways around downtowns and older buildings downtown were knocked down to
14
actions that intended to improve access to downtown actually tended to do more
harm than good. Highways often divided neighborhoods and surface lots reduced
the density and urban fabric of the city. As a result, suburbanization only increased
further.
Beginning in the 1980’s, many developers turned their focus downtown to
the development of new office space. Cities, welcoming any potential investment
and hoping for a spark that could help ignite growth, created plans that
incorporated space for a large growth in office use (Birch, 2009). Though downtown
office space was losing share slowly to the suburbs, it was still in many ways the
land use that had fared best against suburbanization. As mentioned above, there
were competitive advantages in locating downtown for many industries.
Additionally, many employers saw downtown as a logical location since employees
traveled from all different parts of the metro area to get to work. However, the new
construction did not stem the slow transition away from downtowns as the
dominant office form. Despite many tenants moving from other buildings in the city
into these new buildings, little new growth resulted from these projects (Birch,
2009). On top of this, a period of overbuilding across the real estate market created
large amounts of vacancy, particularly in older buildings now largely seen as
obsolete or in need of a major overhaul given the new supply of office space that
now existed.
City leaders were faced with the issue of how to repurpose the excess and
obsolete former office space (Beauregard, 2005). Focus shifted toward converting
15
will explore in later sections, the idea for residential space downtown was not a new
one, but it was not until this time that its use gained traction. Programs such as the
Lower Manhattan Revitalization Plan (1995) in New York were put into place to aid
in the conversion and benefits of having residential space downtown became more
evident. What began as a means to fill old office space was quickly realized to hold
much more potential in creating vibrant environments.
At the same time this push to convert downtown office space to residential
was being made, there was a shift in demographics and lifestyle preferences among
certain segments of the population that favored a more urban lifestyle (Moulton,
1999). This shift is working to bring attention back to downtowns as the center of
activity within a city or region. Considering demographics, the number of
households without children is increasing and young adults are, on average,
marrying later in life (Nelson, 2009). These childless and single young adult
households generally desire more maintenance-free living close to neighborhood
amenities like restaurants and shops. Additionally, living preferences among the
general population indicate a desire for more walkable locations that do not always
necessitate use of a car. These factors favor urban living and have led city leaders
across the country to initiate strategies that would help facilitate the growth of
downtown housing.
Strategies to Incorporate Residential Growth Downtown
Six strategies have been identified as ways in which municipalities may work to
promote residential growth in central cities (Birch, 2007):
16
Buildings on “new” land such as reclaimed waterfronts (i.e. Battery Park City
in New York City)
Redeveloped public housing through HOPE VI projects
Creating mixed-use projects that are able to incorporate some amount of
residential units
Targeting niche markets, such as students or seniors
Using historic preservation to promote residential use
Some of these methods are less appropriate in a downtown setting. For example, a
number of factors would likely limit the ability of a HOPE IV projects be located in
the downtown district of a city. Still, this list provides a helpful understanding of
how residential space may be included in a central city outside of a standard ground
up residential development. The adaptive re-use of buildings historically used for
other purposes has received the most attention and been analyzed in several
different contexts. The obsolescence of antiquated office space and general decline
of industrial uses in central cities makes these buildings prime for conversion to
other uses as an alternative to being knocked down. As an example of this strategy,
New York City implemented the Lower Manhattan Revitalization Plan (LMRP) in
1995 as a means to put empty office buildings to better use as well as move the area
away from its dependence on financial services sector office users (Beauregard,
2005). New office space in the area had relatively low vacancy, but there existed a
glut of old office space in which tenants were not interested. As a response, the city
passed legislation that permitted and provided subsidies for the conversion of old
office buildings downtown into residential units. The result was a nearly 40%
17
Though many municipalities have seen success with the promotion of a
building conversion strategy, it is also important to understand its limitations. While
some cities have a large stock of old buildings with potential for conversion, many
do not. On top this, not all antiquated structures may be conducive to conversion.
The ability for a building to be converted into residential use depends largely on the
size of floorplates of the structure and other design features. This may be a practical
strategy to some extent, but is unlikely to be a complete solution for cities whose
primary goal is to increase vibrancy and diversity of uses.
While all of the methods addressed by Birch (2007) can be employed by
cities to encourage residential growth, they do not directly address the land use
value problem that exists in many places or means of overcoming financing gaps. An
important consideration with any strategy, and the focus of this project, is
understanding the means of financing new residential units. Looking at specific
examples of policies can begin to offer insight into how those policies impact the
financial structure of projects. For example, the LMRP legislation required
involvement of future city funds to developers to account for the lower value of land
when used as residential space. Developers converting old office space received a 14
year tax abatement on the project, making what would otherwise be an unprofitable
project into one that was attractive to developers and investors (Birch, 2007). But
how was this abatement structured in such a way that would encourage property
owners to act and how did it compare to alternative strategies to finance the
development of residential units? Further research will help to illustrate how
18
uses. Considering these barriers to development, we can look at strategies cities
have employed thus far in adding to the housing stock of their downtown and the
financial impact of these strategies to both municipalities and the private sector.
Methodology
The remainder of this paper is divided into two sections. The first is a case
study analysis of Houston, Texas and Washington, DC to analyze and evaluate
policies in place there to encourage residential space downtown. The policies are
assessed on structure, goals, implementation, and impact. Data gathered is largely
qualitative, based on the review of documents and interviews with planers and
policymakers. Interviews provided context not available through written documents
on the policies. All interviewees currently or previously worked in city government
or associated organizations and have first-hand experience working directly with
the residential policies.
Houston and Washington, DC were selected as case studies because each
uses one of the two most common policy approaches to creating downtown
residential space. Houston employs a tax-based policy that uses tax abatements on
completed projects to incentivize development. In contrast, the policy in DC is
primarily zoning-based and provides incentives related to bonus densities. The two
programs were initiated for similar reasons, namely the desire to increase vibrancy
and activity downtown. Evaluating the policies of two cities seeking to increase their
downtown residential population via different strategies will provide valuable
19
and their effectiveness. The findings of this analysis will also be useful to other cities
seeking to address downtown vibrancy through a residential policy.
In the final section of this report, I will analyze the financial impact of the two
policy approaches by applying them to a hypothetical project. Because real estate
markets conditions vary from region to region, applying the policies in a uniform
situation helps to more directly compare their financial impact relative to one
another. The analysis is quantitative, completed with the creation of financial pro
forma models for the development in DC. Actual market conditions there are used to
develop a base line scenario of project viability with no residential policy. Tax-based
and zoning-based policies are then applied to determine the amount of money
necessary to make residential space viable and the level of involvement from public
and private sides. The localized nature of this analysis makes financial results
specific to Washington, DC. However, the concepts and practices used to apply these
policies can be applied elsewhere to determine the effect of policies on market
conditions in any given location.
Case Studies of Two Current Policies
Houston Downtown Living InitiativeAn increased focus on residential space in downtown Houston was brought
about through the development of the Downtown Living Initiative Program (DLIP),
initiated by action of the City of Houston as well as numerous groups associated
with Downtown Houston including the Houston Downtown Management District
(HDMD). A primary driver of the program was the desire to increase vibrancy
20
Chronicle, 2012). Historically, Houston, like many other Sun Belt cities, has had a
very small population in its downtown core. According to current estimates, the
area has a population of approximately 3,600 (Houston Downtown Management
District, 2015). The city and HDMD viewed the lack of commercial activity,
particularly in the eastern portion of downtown in the area around the George R.
Brown Convention Center, as problematic and indicative of the lack of vibrancy in
the area. Official believed that attracting residents could help address this problem
and drive demand for new commercial activity in what they viewed as underutilized
land, occupied by parking lots and less dense uses (Interview, January 23rd, 2015).
However, the prevailing market rate apartment rents at the time made development
of residential space downtown infeasible given the cost of land and construction
there. In order to create an environment in which residential development would be
feasible to a private developer, the city decided to implement the DLIP. The
program, which started in 2012, was initially designed to create 2,500 new units,
but was expanded in 2014 to 5,000 units after high developer interest. It reached
that 5,000 unit cap in August of 2014 and has since been put on hold to allow for the
construction and absorption of those units. In addition to the financial incentives
made available to encourage residential development, the program also includes a
number of aesthetic guidelines, which helped provide the city with increased
authority over the final design of projects to ensure buildings that promoted a
21 Overview of Policy
Real estate has a high degree of geographic heterogeneity. Real estate
markets and the policies that affect them vary significantly from place to place. As a
result, no two markets can be viewed in quite the same way. Houston is unique from
a planning perspective in that it has no zoning code. It is the largest city in the
United States without such a code and the lack of ability to require a particular use
on a property eliminates the ability of the city government to use any policy tools
related to zoning to encourage residential development. As a result, the housing
incentive program in downtown Houston is centered on the use of tax abatement.
Even in municipalities with zoning codes, tax abatements are a popular tool to
incentivize development projects.
Under the DLIP policy, a developer is eligible to receive a tax abatement of up
to $15,000 per residential unit constructed (DLIP Program Description, 2012).
During the planning stages of a project, the developer applies for and receives
approval to be included within the program. Once the project is constructed, the
owner receives a 75% reimbursement per year on the incremental City of Houston
property tax as well as the HDMD incremental assessment for the first fifteen years
after the project’s completion (without exceeding the $15,000 limit per unit). To put
this in real terms, a 200-unit apartment building would be able to receive up to
$3,000,000 dollars in reimbursed taxes over the course of its first fifteen years of
operation. Incentives on that scale significantly affect the financial outlook for a
project and have the potential to make a project that was not previously financially
22
Figure 1 shows the area included in DLIP. It encompasses the entirety of
what is traditionally considered downtown Houston, including the office core, the
Historic District, three major sports facilities, and the George R. Brown Convention
Center (DLIP Update, 2014). The program was initially focused on the eastern
portion of downtown near the convention center, where there is a higher
concentration of properties the city believed to be underutilized. That area is
generally seen as a less desirable location for office space compared to the western
portion of downtown (Interview, January 23rd, 2015). Additionally, increasing the
number of residents in this area would create more vibrancy around the convention
center, helping to create more of a neighborhood feel, drive demand that could
support retail space, and generally improve conditions in the area to create a more
23
Figure 1: Area of Downtown Living Initiative Program Area, Downtown Houston
Source: City of Houston
This map shows the boundaries of the Downtown Living Initiative Program, which occupies the entire downtown area. Parcels in red denote some of the planned residential projects that are part of the program.
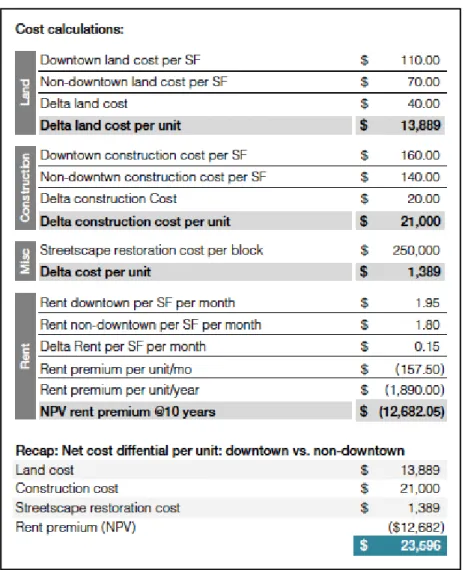
Implementation and Impact
When seeking to implement DLIP, the City of Houston and HDMD paid
particular attention to the total value of the tax abatement that would be offered. To
calculate a basis for the incentive, they looked at market conditions for constructing
multifamily units inside and outside of downtown (Houston Downtown
Management District, 2012). The analysis, a summary of which is shown in Figure 2,
included differences in land cost, construction cost, and achievable rents. The
24
noted as the gap that needed to be filled to make residential projects downtown
financially feasible. While this is an overall estimate of conditions inside and outside
of downtown Houston, sites in both areas are likely to deviate somewhat from this
average based on specific location, surrounding amenities, and other factors that
impact land values and rents.
Figure 2: Housing Development Cost Differential Between Downtown and Non-Downtown Residential Development
Source: Houston Downtown Management District
One change made to the program shortly after it started was an adjustment
25
focused on the eastern half of downtown (which, as mentioned above, is less
developed than the western half of downtown). However, shortly after
implementation of the program, the borders were expanded to include all of what is
traditionally considered downtown (Interview, January 23rd, 2015).
Figure 3: New Residential Projects in Downtown Houston Part of DLIP
Source: Houston Business Journal
When DLIP began in 2012, the program was structured to allow for 2,500
units to take part in the program. However, developer demand was much higher
than initially anticipated and all 2,500 units were allocated out to developers within
about one year of the launch. As a result of the high demand, a provision to allow
26
within the scope of the program to 5,000 (DLIP Update, 2014). By December 2014,
the remaining 2,500 units had been allocated.
A total of 19 projects have been approved under the tax abatement, but only
one has been built and begun occupying as of early 2015 (Interview, January 23rd,
2015). This makes it difficult to measure the success of the program related to
initial goals surrounding vibrancy and commercial activity, which are likely to pick
up more once more projects have been completed. However, the impending
addition of 5,000 residential units to the downtown landscape can be seen as a
success in and of itself when compared to the number of new residential buildings
built prior to the adoption of the program. Only one notable market rate project,
One Park Place (340 units, completed in 2009), was constructed in the 2000’s.
Strong economic growth and large population increases in Houston in the wake of
the great recession likely aided the briskness with which unit abatements were
allocated, but Andy Icken, the Chief Economic Development Officer for the City of
Houston, sees DLIP as a “but for” program, meaning that projects would likely not be
possible but for the incentive in place (Houston Chonicle, 2015).
The strong demand exhibited by developers in claiming all 5,000 units
signaled to the program creators that the incentive was enough to significantly alter
the financial prospects for downtown residential projects. With the cap on all
available units reached, the program is now closed to new applicants. An
interviewee who worked closely on the DLIP noted, “We need to get these units on
the market and prove that there is demand. Once they are built and people see that
27
now we are happy with the 5,000 that we have gotten over the past two years.”
(Interview, January 23rd, 2015).
Analysis of Policy
Although a program centered on tax subsidies as an incentive to promote
growth involves a significant cost to city coffers, structuring the subsidy as an
abatement on incremental property value offers many features that make the idea
the most attractive means to funding through tax subsidy. First, abatements are
low-risk from the perspective of a city. No incentive is being provided up front with
risk of being lost if the project does not happen. Related to this, abatements are also
more politically palatable to taxpayers. No money is siphoned from other programs
in order to fund the program. Since the reimbursement is based on incremental
value of a property after project completion, all money allocated through the
program is money that would not be generated unless the new building was in
place. In this way, the program essentially funds itself, and only after the projects
are built. This is particularly important for a program like DLIP, as affordable
housing and other housing initiatives are generally seen as a higher priority and
more deserving of existing city funds.
An important part of the minimal resistance to the program from citizens is
that it was generally accepted that downtown residential development would not
occur without implementation of DLIP. Had this not been the case or had it not been
demonstrated clearly, accusations of unnecessary abatements or misuse of tax
dollars could have derailed the program. It was also critical to make clear to citizens
28
commercial activity. Lack of demonstrating this could have similarly made passage
of the program more difficult through increased resistance. Because there was
buy-in on both of these fronts, this was not the case.
In contrast to the Washington, DC case that will be examined later in this
paper, relatively little pushback was received from business interests when the
proposal for DLIP was brought before the city. Because the primary cost of the
program was born on the city (through future taxable income) and there was no
requirement to be part of the program, there was little reason for developers,
property owners, or other business interests to oppose DLIP. If anything, the ability
to receive abatements that promote increased development would lead them to
support implementation of the program.
Distributed over time
In the case of DLIP, $75 million in tax breaks will be provided to project
owners assuming that the maximum allowance of $15,000 is given to all 5,000 units
in the program. However, that cost will be distributed over at least 15 years (and
almost certainly longer since the new projects are not all being completed at once).
So while the cost in lost income to the City of Houston is significant, it is made more
manageable by being spread over a longer period of time. As a point of reference,
the total City of Houston budget for 2015 is $4.8 billion (City of Houston, 2015). If
the DLIP program cost the city $5 million per year ($75 million spread over a
minimum of 15 years), it would cost just 0.1% of the total city budget.
The drawback of this payment method to developers is that they must wait
29
Take for example a new 200-unit building that is part of the DLIP. It is eligible for up
to $3 million in property tax abatements upon completion. If that is distributed
evenly over 15 years and a discount rate of 8% is assumed, the net present value of
the incentive is only $1.71 million, about 57% of the nominal value. That difference
is built into the financial model of a developer when they analyze the profitability of
a project.
Washington DC – A Living Downtown
In many ways, Washington, DC can be viewed as a success story in promoting
downtown residential space. In contrast to Houston, which is still in the early stages
of the program it initiated, Washington has had a policy in place to encourage
residential development downtown since the early 1990’s. Though, residential
development there did not truly begin in earnest until the late nineties and early
2000’s. Since then, the population has increased dramatically. In 1996, there were
approximately 1,300 housing units downtown. By 2007, that number had increased
to 6,300 and it continues to grow today (McCarthy, 2013). Current estimates of
downtown housing stand at over 12,000 units (Downtown Development Working
District, 2008). Walking around downtown Washington, the change is evident.
Streets in many parts of downtown, particularly the Penn Quarter and Chinatown
neighborhoods, are active at all times of day and commercial activity is vibrant. It is
no coincidence that these areas of downtown are also closest to concentrations of
residential space that have been built. The following sections will describe in further
detail the policy Washington, DC has used to build up the residential population
30 Overview of Policy
Washington, DC uses a program based on zoning and regulatory rules that
require the construction residential space in certain parts of the city. Within the
zoning code of the city, there is a housing priority area overlay zone (Municipal
Regulations, 2000). As seen in Figure 4, it occupies a portion of the eastern end of
downtown and extends north of Massachusetts Avenue into the Mt. Vernon
neighborhood, immediately adjacent to what is traditionally considered downtown.
Within the overlay, any new construction is required to allocate 4.5 FAR to
residential space. With the height limits in place, this equals just more than half of
the 8.0 FAR that is buildable under standard zoning in the area, If residential space
is built on the site, total FAR allowed is increased from 8.0 to 10.0.
31
The intention of requiring 4.5 FAR of each property to be residential is not designed
to create new buildings that have four and a half floors of housing units with the
remainder of the building occupied as office space. Very few buildings are designed
to mix residential and office uses. Rather, structuring the policy in this way places an
equal burden on property owners in the area to include residential space in their
developments (Interview, February 9th, 2015). In order to distribute the housing
requirement to specific properties, the city developed a “combined lot” provision.
The provision allows for two or more properties in the overlay area to be treated as
one, allowing the “preferred use” requirements for residential of both properties to
be built on one site (Municipal Regulations, 2000). As an example, two property
owners could agree to treat their parcels as a combined lot (regardless of whether
they are physically connected to one another), with one property owner building
the residential space required for both parcels on their property while the other
property owner builds office space. Typically, this type of agreement between two
developers involves some cash payment to the owner building residential space to
account for the fact that it is less profitable (Interview, January 22nd, 2015). Without
that payment, they would have no incentive to agree to take on the additional
residential component.
As an incentive to make residential development financially more attractive,
the city instituted a form of bonus densities for residential space built anywhere
downtown (within or outside of the housing overlay). However, since Washington,
DC has height limits, the densities are given in the form of transfer development
32
TDR’s. Those TDR’s can then be used to increase density above what is regularly
permitted in designated off-site “receiving areas” of the city outside of downtown
(Fruehling, 2007). Residential space built south of Massachusetts Avenue receives
TDR’s at a 2 to 1 ratio and residential space built north of Massachusetts Avenue
receives TDR’s at a 1 to 1 ratio. As an example, a developer building a 100,000
square foot residential building downtown also receives 200,000 square feet of
TDR’s that can be applied to new development in the receiving zones, making
projects there more profitable given increased density. The developer can either use
them to increase the density of a project they are developing or can sell them to
other developers. Still, whether they are used or sold, the TDR’s, in conjunction with
payments received through the combined lot policy, allow for financial gains that
help offset the fact that residential space by itself is not as profitable as office space.
The buying and selling of transfer development rights has created a market
for TDR’s (Interview, February 9th, 2015). Because transactions are private, the
price of credits at any given time are not tracked and the going rate is not public
knowledge. An interviewee I spoke with estimates that current credits fluctuate
between $7-$13 per square foot depending on market conditions and demand.
In addition to the housing overlay, the city government has one other means
to promote the development of residential space by the private sector downtown. A
key stakeholder in the process noted that at times, the city structures deals
involving the sale of city-owned land under the condition that it be developed with
uses desired by the city, such as residential space or a particular commercial use (i.e.
33
2015). In doing so, it potentially loses some of the market value of the land by not
simply selling to the highest value use. These types of transactions are one-off deals
though and obviously dependent on city ownership of land.
Implementation and Impact
In the early 1980’s Marion Barry, who was mayor of DC at the time,
assembled the Mayor’s Downtown Committee to strategize about the future
development of downtown (Interview, February 23rd, 2015). Given development
that was occurring at the time in the West End neighborhood of the city, it seemed
likely that development would eventually push eastward toward the traditional
downtown area. According to an interviewee with knowledge of the process, the
thinking in creating the committee was to strategize ahead of development: “We
knew it would be redeveloped. The question is whether it would be revitalized?”
The resulting product of the committee was a downtown plan: A Living Downtown
for Washington, DC. As the name suggests, the plan created a shared vision for the
city that emphasized a mix of uses, particularly the need for housing, retail, and arts
& entertainment space in addition to the concentration of office space.
While the plan of the Mayors Downtown Committee laid the groundwork for
a vibrant city and recognized the benefits of diversifying the use of downtown space,
it carried with it no means to make the vision a reality. The initial use of a regulatory
framework to promote or enforce these recommendations began with the
implementation of a 1.5 FAR requirement for retail in a zoning overlay created to
promote the preservation and expansion of the downtown retail district. If a
34
purchase the FAR equivalent from property owners with excess retail space.
Because this regulation required space to be allocated to uses that were not
necessarily the highest and best use from a profitability standpoint, it was met with
pushback from developers and property owners.
Shortly thereafter, the focus shifted to housing. The Greater Washington
Board of Trade, a network of business professionals and non-profit leaders, put
together a Housing Task Force with both public and private sector participants to
strategize a means to implement the housing portion of the Living Downtown plan
(Interview, February 19th, 2015). The task force concluded that there was no
demand for residential space downtown and that providing incentive through
subsidy (such as a tax incentive or abatement) would cost far too much to merit its
use. Hypothetical pro formas projected extremely low rents and high construction
costs.
With subsidies out of the question, attention turned to a zoning solution
similar to that used in the shopping district. However, the private sector was still
strongly opposed to the idea of a zoning regulation out of fear that it would decrease
property values and development potential of the affected area. The possibility of
housing regulation was their biggest concern and the discussion dragged out for
years. After numerous proposals from both sides that failed to generate a solution,
the Office of Planning was able to bring the issue to a vote by the Zoning
Commission, which sided with the city. As a means to compromise with the
development community and attempt to address their concerns, the city increased
35
policy. All of these actions helped improve profitability of the construction of
residential space and compensate for the zoning burden.
Due to the recession of the early 90’s, which hit the real estate market
particularly hard, little construction took place. In the late 1990’s and early 2000’s,
the city did provide a small tax abatement to two projects in order to help them
move forward and demonstrate that demand did exist for downtown housing. As
developers came to see that people did want to live downtown and the achievable
rents were higher than initially anticipated, construction of residential space
increased dramatically and the zoning policy became less controversial.
A critical factor in the success of Washington’s zoning policy has been the
District’s ability to recognize and allow for adjustments as needed that are better
able to lead to the desired outcomes of the policy. For example, until 2001 there was
a requirement that the residential portion of a combined lot deal be built prior to
the completion of the associated office space (Interview, January 22nd, 2015). The
rule was meant to ensure that developers agreeing to construct residential units
would actually do so. However, this gummed up the development process by making
the office market dependent on the residential market. The city realized the
impediment to development that the rule caused and relaxed and modified the
policy to work with developers to reduce barriers to new projects getting started.
Even today, the city is looking at how aspects of the policy may be better suited
under current market conditions. Discussions are underway currently for possible
36
housing is encouraged to other parts of downtown as well as to nearby emerging
neighborhoods like NoMa and Navy Yard.
The initial goal of Washington, DC outlined for the Downtown Development
District was to have 12,410 housing units downtown, almost 9,000 more than the
3,707 that existed before the year 2000. As of 2009, 5,180 new units had been built
and 3,382 were under development, essentially reaching that goal (Downtown
Development District Working Group, 2008). However, the city continues to
promote the addition of new residential space with a desire to continue increasing
the population downtown and in downtown adjacent neighborhoods.
Analysis of Policy
Looking at the use of regulatory zoning policies as a residential strategy and the
experience of Washington, DC offers important insights into the implementation and
use of such a framework. Specifically, there are four areas worthy of discussion:
municipal cost, resistance of the private sector, concentration of housing, and
administrative upkeep.
Municipal Cost
Unlike a tax abatement or other system based on tax subsidy, regulatory
zoning polices like those employed in Washington, DC impose no direct cost to a
city. Costs are born on the market through reduced land value due to the
requirement of a potentially less profitable use. In the case of Washington, the city
attempted to make up for the reduction in value through the allowance of increased
density on sites, issuance of transfer development rights, and the ability of
developers to receive payment from other developers for taking on the residential
37
no direct cost to the city. Instead, they allowed developers to create value via means
that did not previously exist.
Because there is no cost burden to the city, the issue is less contentious for
citizens. The program does not compete for funding with any other program and
essentially functions outside of any budgeting issue. As a result, it is much more
politically palatable to taxpayers. However, because the cost is alternatively placed
on the market, it faces pushback from the development community.
Resistance from Developers
As seen in the implementation of A Living Guide to Washington D.C.,
resistance from the private sector to regulation is not surprising when it has the
potential to affect their investments. The largest hurdle to getting Washington’s
policy off the ground was the push back from developers in the city, who were very
resistant to change. Although it slowed the process and they often found themselves
at odds, the city made a point of including the private sector in the process from the
start. The Mayors Downtown Task Force that created A Living Guide to Washington,
D.C. included both public and private sector representation. All sides agreed that
diversifying uses of downtown buildings stood to benefit the city, but they disagreed
on the means to do it. Committees formed after that to study implementation also
involved participants from the private sector.
Ideally, the benefits from bonus densities would equal the costs of the zoning
policy. However, it is hard to pinpoint exactly what that difference is and it is likely
to differ slightly from site to site. Any new rules with relation to zoning will require
38
Washington, the perceived lack of demand for any residential space downtown
during the planning stages did not help to ease the fears of developers.
Concentration of Housing
An important component of a zoning approach is the size and location of the
area on which restrictions will be placed. The housing overlay within the Downtown
Development Overlay District of Washington, DC targeted specific neighborhoods on
the eastern end of downtown (Penn Quarter, Chinatown, Mt. Vernon Square) for
residential space. In some ways, it makes sense to begin a program with a specific
target area in mind. Concentrating the program in one particular area that can
create a base of residential activity can be a helpful starting point to promote other
activity such as neighborhood serving retail. On the other hand, it leaves other
portions of downtown without a desired vibrant mix of uses. Figure 5 shows the
stark contrast in housing concentration in different neighborhoods. Large swathes
of both existing and under development housing can be seen in Mt. Vernon, Gallery
Place (Chinatown), and Market Square (Penn Quarter) while Franklin Square, the
Retail Core (Metro Center), and Pennsylvania Avenue West have very little
residential development. Some of the proposed changes to the housing overlay that
are under review now would help to address this by promoting the construction of
housing outside of the overlay zone. As the housing overlay policy and downtown
itself mature, this appears to be the next logical step in the evolution toward the
39 Figure 5: Existing and Planned Residential Space, Downtown Washington -2009
Source: Downtown Development District Working Group, 2009
Administrative Upkeep
An interviewee noted the significant administrative upkeep necessary to track
properties acting on different portions of the regulation, particularly combined lot
rules. The agreements between properties often involved webs of multiple
properties taking part in the agreements to allocate their housing requirements
(Interview, February 9th, 2015). Those properties were then linked to one another
through the policy and required documentation and tracking to ensure that each
had met its requirement. The interviewee noted that, “the management and
40
accounting for that is just very hard.” As a result, the Office of Planning is seeking to
simplify the combined lot linkages to other properties as part of the policy
adjustments currently being considered.
Hypothetical Project Analysis – Washington D.C. Property
The high geographic variation of real estate market dynamics poses
challenges to the assessment of any one downtown housing policy on its surface.
Every region varies in its existing built form, legal parameters, and general cultural
attitudes. On top of that, the structure and relative strength of the local economy
varies from region to region and also changes over time. All of these factors affect
the demand for space, the manner in which new space is constructed, and the price
which people are willing to pay for it. Some markets may be strong while others are
weak. Others may see demand for one product type, but not another.
As a result, the use of a case study that applies potential policies in the same
place is helpful in analyzing policies on an even playing field. This report will look at
a hypothetical parcel of land to be developed in downtown Washington, DC. It
begins with a baseline scenario under normal market conditions and will then apply
a tax-based policy and a zoning-based policy to examine the financial effect on each
with regard the developer, the city, and to overall project viability. It assumes all
other factors related to the external environment equal in order to isolate the
impact to downtown residential policies. Since the findings of the comparison will
vary from location to location based on market conditions, results will not be
41
to apply these policies could be applied elsewhere to determine the effect of policies
on market conditions in any given location.
Scenario
The case study explores the hypothetical option to build an office building or
an apartment building on a parcel of land. Under strictly market conditions, office
space is the likely choice to build by a developer, as it can garner higher rents and
therefore allow the developer to offer more for the land. However, application of the
housing policies discussed previously can help to shift market behavior in such a
way that encourages the creation of residential space. Obviously, office and
residential space are not the only two potential land uses for a site, but narrowing
the focus will help simplify the study while still conveying the market impact of
residential policies.
The financial analysis presented here seeks to determine the amount a
developer would be willing to pay for land in order to reach their target return on
investment. This is common practice in assessing real estate development projects.
All other variables in the financial model are known or can be accounted for in some
way. Attainable rents are dictated by what the market is willing to pay and can be
estimated to project total income a property will generate. Since a developer knows
the target returns they are looking to make, they can use the total income of the
project and apply the target return to determine how much can be spent on land
acquisition and construction and still meet their return. Construction costs, like
rents, are dictated by the market and are out of the control of a developer. By
42
acquisition cost is left as the residual value. In this way, we are backing into land
value by determining the residual value left over from project income after
accounting for all other project costs. The formula below offers a simplified
explanation (without taking into account time) of how land value can be calculated
with all other variables known.
Return on Investment = Project Income / (Construction Cost + Land Cost) Therefore…
Land Value = (Project Income /Return on Investment) – Construction Cost
Determining the amount a potential developer would be willing to pay for land is
appropriate in this study since the party willing to pay the most for land is the one
that will gain control of that land. They will then build whatever maximizes value of
the land in order to justify the cost paid.
Under both scenarios, total building area is assumed to be 150,000 square
feet (SF). Given height limits in Washington, space is distributed across 10 floors of
15,000 square feet each. The rentable space of the apartment building is assumed to
85% while rentable space of the office building is slightly higher at 95% since
common area space is included in office rents. The first floor of both buildings is set
aside as a retail space that can garner $55/SF rents (triple net).
Assumptions
The Washington metro area ranks second in the U.S. in total office space and
rents in downtown DC rival the strongest office markets in the country (CBRE,
2013). While downtown apartments can garner fairly significant rents relative to
43
average office rent in the Washington, DC CBD for Class A space was $56.40 per
square foot per year (gross) (Colliers, 2014). Average apartment rents, which are
typically calculated on a monthly basis, were $3.21/sf/month for the same area at
that time (Delta Associates, 2014, 1). Annualized to put this in perspective with
office space, residential space leased for an average of $38.52/sf. The rents modeled
for both sectors in this study are given a premium above that rent to account for the
fact that they will be newer product that is presumably built to the top of the
market. Office rents are projected to price at $62.04/sf (gross), a 10% premium
over the submarket average. Apartments are projected to price at $46.00/SF, or
$3.83/SF on a monthly basis, a slightly higher premium than the office market given
trends in apartment pricing and performance of recent properties built downtown
Washington. Figure 6 shows key assumptions made in this case study. A full analysis
44
Figure 6: Financial Analysis Base Scenario and Assumptions
Costs
Construction costs are based on data from Delta Associates’ Market Maker
Survey for year-end 2014. The report surveys those active in the real estate market
in Washington and collects data on development costs, investment returns, cap rate
trends, and business outlook. Total construction costs for new CBD office space are
estimated to be $420/sf while total costs for new high-rise residential space are
45
Property taxes in the District of Columbia vary depending on the type of
property being assessed. Residential spaces are taxed at a rate of $0.85 per $100 of
assessed property value (Office of Tax and Revenue, 2015). Office space is taxed at a
rate of $1.85 per $100 of value for any value over $3 million. The first $3 million in
value of any commercial property is taxed 20 cents lower at $1.65 per $100 of
assessed value. An additional Business Improvement District (BID) assessment of
$0.15 per square foot of space is applied to all office space. The BID assessment is
not placed on residential properties.
Return on Investment and Sale
The model assumes a target annual rate of return of 12% over the course of
the project. The building will be owned for six years after completion at which point
it will be sold. A 3% cost of sale is assumed at disposition to account for selling fees.
The cap rate at time of sale is estimated to be 5.5% for the office building and 5.0%
for the apartment building. These are based on recent data on cap rates in the area
and account for the fact that multifamily product is trading at a lower cap rate than
other product types.
Base Case
With all of this data, we can determine the value of land for development
under both scenarios. Figure 7 provides an overview of land value for office space as
well as residential space. A full financial analysis is available as an appendix to this
46
Figure 7: Land Value of Hypothetical Development as Office or Apartment Space
If built out as office space, the hypothetical parcel or land is valued at $24.2 million.
As residential apartments, it is worth approximately $20.1 million. Therefore, the
financial gap to make residential space as attractive as office space on a typical lot of
this size in downtown Washington, DC is approximately $4.1 million. Under these
conditions, a developer seeking to build office space would always be able to outbid
a developer seeking to build residential space. The policies in place in Houston,
Washington, DC, and numerous other cities throughout the country seek to address
this difference in value by putting in place mechanisms that help close the gap.
Applying a Tax-Based Policy
The benefit of using a tax abatement structure to encourage residential space
is that the incentive is paid for using money generated from the project itself. While
this makes it politically attractive, it also means that the incentives are distributed in
the years after the project has been built. To understand the value of those
abatements to a developer today, it is necessary to determine the their net present
value (NPV). The NPV can then be viewed as the amount a developer would be
willing to pay above the residential market value of land and still hit return targets.
In order to show the effect of a tax abatement policy, a system structured like
that of Houston is employed. Like in Houston, each unit is allotted up to $15,000 that