W
ALKINGB
EHAVIORC
ORRELATESby
Steven Chadwick Spoon
A Masters Project submitted to the faculty of the University of North Carolina at Chapel Hill
in partial fulfillment of the requirements for the degree of Master of Regional Planning in the Department of City and Regional Planning.
Chapel Hill, North Carolina
2005
Approved by:
Associate Professor Director
Department of City and Regional Planning Active Living by Design University of North Carolina at Chapel Hill Reader
E
XECUTIVES
UMMARYAt one point in time, cities grew as compact and vibrant entities focused on the downtown. In these close-knit environments, residents had the ability to walk or bicycle to
destinations due to the fact that they lived in close proximity to where they worked and
entertained. However, as development patterns slowly changed, cities began to sprawl outward
causing an automobile dominated society that has lead to a number of negative effects, including traffic congestion and increased sedentary lifestyles.
Due to these problems, the city planning and public health professions are now
supporting walkable communities that are designed to promote walking and bicycling to nearby destinations. However, the implementation of walkability in an environment has been hindered
by the fact that planners and public health practitioners have not adequately determined what measurable variables define walkability. While a number of studies and reports have attempted to define walkability, there are few occasions when similarities exist. Further complicating the
task of defining walkability is the difficulty that exists in identifying the strongest correlates of walking.
The objective of this paper is to examine the literature focused on walkability and the walking behavior to decipher a compact list of proxy variables from those cited in research that can serve as a working definition of walkability. A synthesis of the literature will also determine if walkability actually produces an increase in walking, and whether this increase is for
transportation or recreational purposes. As a result of the findings from these research questions and the literature reviewed in this paper, recommendations for future actions for planners are
T
ABLE OFC
ONTENTSEXECUTIVE SUMMARY...2
TABLE OF CONTENTS...3
LIST OF TABLES...4
OVERVIEW...5
THE GROWTH OF AMERICAN CITIES...5
WALKABILITY: SOLUTION AND PROBLEM...6
PUBLIC HEALTH PROFESSION TAKES AIM...8
PROBLEM STATEMENT...10
LITERATURE REVIEW: WALKABILITY...12
A HOST OF OPTIONS...12
DEFINING WALKABILITY: FINDINGS FROM THE LITERATURE...12
SUMMARY OF WALKABILITY FINDINGS...25
LITERATURE REVIEW: BEHAVIORAL OUTCOMES...32
THE CONNECTION TO THE WALKING BEHAVIOR...32
CORRELATES OF WALKING: FINDINGS FROM THE LITERATURE...34
SUMMARY OF WALKING BEHAVIOR FINDINGS...42
SYNTHESIS OF FINDINGS...47
WHAT DOES THE LITERATURE TELL US...47
PULLING IT ALL TOGETHER: A WORKING DEFINITION OF WALKABILITY...51
DOES WALKABILITY ACTUALLY RESULT IN AN INCREASE IN WALKING?...54
WALKABILITY: TRANSPORTATION OR RECREATION...55
CONCLUSIONS AND RECOMMENDATIONS...58
RECOMMENDATIONS FOR POLICY AND PRACTICE...61
FINAL IMPLICATIONS...66
REFERENCES...68
APPENDIX...72
WALKABILITY SUMMARY TABLES...72
L
IST OFT
ABLESTable 1: Walkability Variables Defined by Dan Burden, Walkable Communities, Inc. ...14
Table 2: Walkability Variables from Florida Department of Transportation...16
Table 3: Walkability Variables from Shriver, 2004...18
Table 4: Walkability Variables from Southworth & Owens, 1993 ...21
Table 5: Walkability Variables from Southworth, 1997...22
Table 6: Summary of Findings from Walkability Literature...28
Table 7: Factors Influencing the Walking Behavior...33
Table 8: Correlates of Walking from Giles-Corti & Donovan, 2003 ...35
Table 9: Street and Urban Design Factors Affecting Walking from Cervero & Duncan, 2003 ..37
Table 10: Site Design Characteristics Affecting Pedestrian Travel from Moudon, et al 1997 ....39
Table 11: Regression Results for Neighborhood Environment: Walking to Work...41
Table 12: Summary of Findings from Walking Behavior Literature...44
Table 13: Synthesis of the Literature- A Phased Definition of Walkability ...53
Table 14: Walking by Purpose- Findings from Walking Behavior Literature...56
O
VERVIEWTHE GROWTH OF AMERICAN CITIES
Cities have seen a vast change in the way they have grown in size and developed spatially
over the last 100 years. In the early twentieth century, the United States developed in the form of compact, mixed-use neighborhoods where residents could live, work, and entertain all within the
same environment. However, with the emergence of the automobile, zoning laws, federal government mortgage policy, and modern architecture, this pattern slowly began to change. By the end of World War II, development patterns had completely shifted to conventional
neighborhood development, which consisted of a rigorous separation of land uses that required heavy use of the automobile [1].
Even today conventional neighborhood development is popular. Suburban rings around cities continue to grow farther and farther away from once vibrant downtowns. While once compact and downtown focused, cities are now experiencing these rapid outward expansions due
to factors such as government polices that separate land uses, mass use of the automobile, and the perceived ‘American dream’ of having a single-family house on a large lot with a backyard
and garage. As a result, cities across America have begun to encounter social and public health problems, and what the Congress for the New Urbanism categorizes as “disinvestments in central cities, the spread of placeless sprawl, increasing separation by race and income, environmental deterioration, loss of agricultural and wilderness, and the erosion of society’s built heritage as
one interrelated community-building challenge” [2].
Even though this decentralized, sprawled pattern has become the norm in neighborhood
populations grow relatively slowly. Automobile use per capita has skyrocketed because one is
required to travel great distances to most destinations, there by greatly restricting opportunities for non-motorized travel. Auto-oriented developments, such as strip mall have sprung up throughout the suburban landscape, thus reducing the individuality and human character of cities
[1]. Between 1982 and 1997, these development patterns have lead to a decrease of more than 20% in urban land density in the United States, there by further increasing the reliance on
automobiles. In this same time period, population size only grew 17% while the amount of urbanized land increased by a total of 47% and vehicle miles traveled increased 55 %, rates that are more than triple population growth [3].
WALKABILITY: SOLUTION AND PROBLEM
While there are many options available to combat these trends, the city planning
profession has once again begun to place emphasis on designing compact, mixed-use
communities that resembles those of decades before. A major goal in this process has been to create ‘walkable’ communities, where the built environment is designed in a way to foster
walking and bicycling to nearby destinations rather than requiring individuals to rely strictly on the automobile. The increase in awareness of the potential social, health, and environmental
benefits of walkability has led to a rapid rise in the number of walkable communities, also known as neo-traditional developments and new urbanist developments, which have been built across the nation.
While planners use these terms openly, there is little agreement as to what truly defines a walkable environment. In practice and in research, planners tend to apply the term walkability to
being a walkable environment. The major problem with this current state of practice is that
when such occurrence happens, the term walkability loses valuable meaning. The term becomes overused and its importance lessened. To successfully establish the concept of walkability as a formable answer to conventional neighborhood development, a true definition must be generated
so create a benchmark as to what environments can be classified as walkable and to help future planners in designing such neighborhoods.
A major research dilemma concerning the literature in this field is that it does not
adequately provide a clear answer to what is the true definition of walkability. Instead, much of the walkability literature provides a host of various definitions and variables that are
hypothesized to produce an environment that increases the walking behavior. Currently, there is neither one precise way to describe walkability, nor is there a well-defined set of walkability
variables that serve as correlates of walking.
As its basic level, a definition of walkability can be simply an area that promotes walking. The obvious problem with this level of detail is that leaves great discretion to the
planner as to which environments are designed to successfully achieve the goal of walking. At the other end of the spectrum, a much more complex explanation of walkability would be to
require all the possible variables of the built environment that increase the walking behavior and to classify only those areas that that possess these variables as walkable. Unfortunately, this heightened level of detail can step too far by severely limiting what can be defined as walkable.
There are hundreds of environmental variables that behavioral scientists have tested for their impacts on the walking behavior, and it is simply not feasible to require that a working definition
It is evident that walkability is an important concept for city planners but a clear
understanding of what it is and what variables define the form and behavior is first needed to successfully implement the concept into environments. As stated, in defining walkability, a vast number of variables that potentially increase walkability exist, including accessibility variables,
attractive variables, connectivity variables, and safety variables. To show this ambiguity, an example can be provided. There is general agreement that the provision of sidewalks will
improve the walkability of a neighborhood, however there is still a host of sidewalk variables that can affect overall walkability: sidewalk width, connectivity to surrounding destinations, the existence of crosswalks, safety features, and lighting. To this point, research has not shown
which, if any, of these sidewalk variables serve as the most important correlate of the walking behavior. Therefore, empirical data that has attempted to correlate the effects of these variables
has not been able to fully comprise a list of proxy walking variables from all that potentially exist. A major reason for this gap is the difficulty in identifying the strongest correlates as well as problems of adequately measuring their relationship with the walking behavior. The best
definition of walkability may therefore lie in the fact that a compact list of variables can be deciphered from the vast number of potential variables so that they may serve as a proxy
measure for the remaining walkability variables. When this list is assembled, places that posses those particular variables should exhibit an increase in walking as opposed to places without these proxy variables. However, as this question appears to be answered, there is still great
misunderstanding as to what are the true correlates of walkability.
PUBLIC HEALTH PROFESSION TAKES AIM
the automobile. Walkable communities are therefore meant to support alternative modes of
transportation to important destinations. Due to the fact that nearly a quarter of all personal trips that people make within the U.S. are one mile or less, yet nearly 75% of these short trips are made by car, walkable communities may serve as a potential solution to support active
transportation modes [4]. Planners hope that by applying walkability to an environment,
automobile trips will be substituted in these short trips for an increase in the number of walking,
bicycling, and public transit trips.
While acknowledging the need for better air quality and less congestion, the public health profession has also begun to emphasize walkable communities but for significantly different
reasons. Environment-behavior relations first emerged as an important field of study in the early 1960s [5]. At that time, the field was rooted in environmental design, but bridged
architecture, landscape architecture, urban design, and urban planning [6,7,8]. Today those trends continue on the public health agenda to examine the influence of the built environment on health. Approximately 300 studies have examined the correlates of physical activity behavior
among adults [9]. Using these correlates, public health professionals are trying to determine which built environment variables will help individuals receive recommended levels of physical
activity, defined as 30 minutes of moderate-intensity activity on 5 or more days per week [10]. Proven benefits of this type of physical activity include the ability to control weight levels; build strong bones, muscles, and joints; reduce falls among elderly populations; relieve arthritis pain;
reduce anxiety and depression; and result in fewer hospitalizations and doctor visits [11]. However, regardless of these demonstrated benefits, nearly 46% of U.S. adults in 2003 did not
With such a small portion of individuals meeting healthy physical activity levels, the
public health profession has begun to turn to the built environment as an intervention
opportunity. Touting many of the studies that have worked to correlate what variables have the greatest influence on the walking behavior, public health officials see walkability as a potential
means to design the built environment in a way that will help combat the “obesity epidemic” [13]. By being designed for walking, individuals living within areas defined as walkable in
theory have a greater opportunity to increase their daily physical activity levels. Therefore, regardless of whether a trip’s purpose is for utilitarian or recreation, as long as an individual is walking then some health benefits can be accrued.
Determining whether people choose to walk within a walkable community for
transportation or for recreational purposes can therefore have a large impact for the city planning
and public health professions. If individuals in these communities are simply using walkable communities to exercise, then walkable communities potentially may not be serving their true planning goals of utilitarian travel. One would surely concede that increasing physical activity
levels is a noble goal, but if the planning profession proclaims that walkability is meant to reduce automobile travel for increases in utilitarian walking trips, then there potentially could be a
disconnect if any increase in walking that results from these environments occurs mostly in the form of recreation.
PROBLEM STATEMENT
As previously stated, there currently is no agreement among planners and public health professionals as to what one precise way walkability should be defined. Likewise, there is also
research objectives of this paper. First, it will attempt to answer the research question ‘What
measurable variables define walkability?’ By examining literature focused on walkability and the walking behavior, it should be possible to extract what variables are most commonly agreed upon by practitioners and researchers as well as determine which ones are more important and
how they should be measured. A secondary objective of this research is meant to resolve whether walkability actually translates into an increase in walking. The third objective of this
research is to determine whether walkability translates into an increase in transportation or recreational walking. Both the second and third research questions should be answered based on a synthesis of the findings from both literature reviews. While the purpose of this research is not
to test a hypothesis, there is still the general belief that the conclusions will show that places that exhibit variables of walkability, which will be defined based on the findings from the literatures,
will result in an increase in walking. Furthermore, it is hypothesized that this increase in walking will be primarily for recreational purposes as opposed to utilitarian travel. The final objective of this paper is to use the findings from each of the three research questions to provide a set of
L
ITERATURER
EVIEW: W
ALKABILITYA HOST OF OPTIONS
For many of the above stated reasons, walkability has become increasingly popular in the
city planning and public health fields. There is, however, great discrepancy in the depth and purpose of walkability literature. At times, one will find a resource that is designed solely to
detail the intricacies of walkability, while another document may focus on walkability but in a secondary manor. Typically when this occurs, walkability is defined by a journal’s author in the context of conducting a study focused on testing built environment effects on activity levels or
transportation mode outcomes. Articles that come from journals such as the Journal of the American Planning Association, American Journal of Public Health, or the Transportation
Research Record fall within this latter category. Documents produced by national walking experts, such as Dan Burden of Walkable Communities, Inc., and other national and state governments usually focus solely on helping others understand what walkability encompasses,
and therefore falls under the former category. As such, a quick glance of this research will produce a wide range of documents, including both peer reviewed and fugitive literature. In
order to provide the most capable definition of walkability, both forms of this literature are included in this discussion. A total of 12 documents are used in the following sections to highlight the discrepancy in defining walkability. A list of tables is included in the Appendix that provides a basic synopsis of the major research findings relative to walkability in all
included literature.
DEFINING WALKABILITY: FINDINGS FROM THE LITERATURE
walkability variables into a set of several groupings. However, it is particularly interesting to
note that these groupings are not identical between the two articles. In his first article “Rating System for Walkable, Active Living, Active Transportation,” [14] Burden uses 11 categorical variable groupings to define walkability. However, in his second article “Walkable Community
Criteria,” [15] the number of groupings is reduced to 8. The problems of defining walkability through the literature are highlighted here in the fact that even between documents by one author
there a small discrepancy exists. Variables that do overlap include accessibility,
aesthetics/attractiveness, and connectivity. Some classifications that are not included in both documents are the location of neighborhood schools, maintenance, promotion, and density.
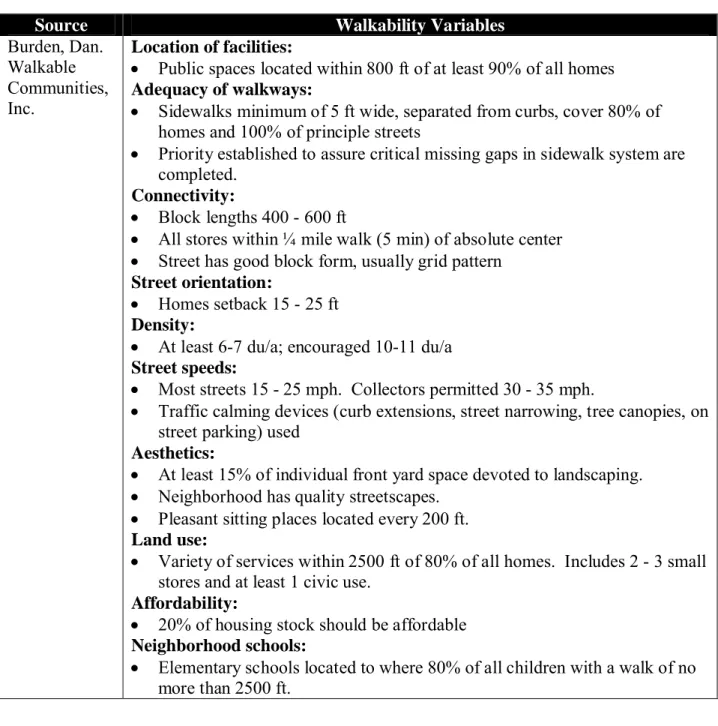
Summaries of the variables that are used to define walkability by Burden are provided on the following page in Table 1. A full listing of variables can be found in the Appendix.
While Table 1 only highlights a small portion of the variables that Mr. Burden uses to define a walkable area, they provide an excellent example of the broad types of variables that can be used to designate areas as walkable. Examination of these articles in the Appendix will
further show the level of detail that is prescribed. Requirements such as having all public spaces located within 800 feet of at least 90% of homes, having at least 15% of lawns dedicated to
landscaping, and block lengths that are between 400 – 600 feet long, all work to increase the pedestrian feel of an environment, but may be too strict qualifications. This could therefore have the affect of disqualifying some environments as being classified as walkable should they not
Table 1: Walkability Variables Defined by Dan Burden, Walkable Communities, Inc.
Source Walkability Variables
Burden, Dan. Walkable Communities, Inc.
Location of facilities:
Public spaces located within 800 ft of at least 90% of all homes
Adequacy of walkways:
Sidewalks minimum of 5 ft wide, separated from curbs, cover 80% of homes and 100% of principle streets
Priority established to assure critical missing gaps in sidewalk system are completed.
Connectivity:
Block lengths 400 - 600 ft
All stores within ¼ mile walk (5 min) of absolute center
Street has good block form, usually grid pattern
Street orientation:
Homes setback 15 - 25 ft
Density:
At least 6-7 du/a; encouraged 10-11 du/a
Street speeds:
Most streets 15 - 25 mph. Collectors permitted 30 - 35 mph.
Traffic calming devices (curb extensions, street narrowing, tree canopies, on street parking) used
Aesthetics:
At least 15% of individual front yard space devoted to landscaping.
Neighborhood has quality streetscapes.
Pleasant sitting places located every 200 ft.
Land use:
Variety of services within 2500 ft of 80% of all homes. Includes 2 - 3 small stores and at least 1 civic use.
Affordability:
20% of housing stock should be affordable
Neighborhood schools:
Elementary schools located to where 80% of all children with a walk of no more than 2500 ft.
Another leading discussion of walkable environments comes from The Ahwahnee Principles, a total of 23 principles devised by planning professional in Yosemite at the
Ahwahnee Lodge in 1994 [16]. While they do not provide a strict prescription for what variables define walkability, they list a set of principles that are better indicators of walkable communities
and therefore serve a purpose in this analysis. Important factors that are mentioned in this
document include “integrating communities with housing, shops, work places, schools, parks and civic facilities,” access to transit, diversity housing types, adequate open space, well-connected pedestrian paths, and proper street orientation. As can be seen, connectivity, accessibility, mixed
land uses, and aesthetics are all covered by the Ahwahnee Principles. However, due to the fact that they are only principles, the document does not go into any detail of what constitutes street
orientation or well-connected pedestrian paths, for example. Instead, the Ahwahnee Principles provide a very broad definition of what defines walkability, which could potentially lead to great discrepancy when trying to implement these goals in practice.
The Pedestrian and Bicycle Program from the State Safety Office of the Florida Department of Transportation use twelve categorical variable groups to define how to create
walkable communities [17]. Again, similar results show up. Linked walkways, school placement, transit, and land use are factors that the Pedestrian and Bicycle Program deem as important walkability variables. While these grouped variables are similar as previous literature,
there is still some discrepancy in level of detail. Here again sidewalks are defined as having a minimum of 5 ft width, much like recommendations from Burden [14,15], but this document
goes further by defining that the total width with trees should be 7 feet. Other features that are very similar are recommendations to use traffic calming devices, such as raised crossings, traffic diverters, and roundabouts to slow traffic around schools and in neighborhoods. A difference
between this document and other research is that some important areas are given less detail. Variables such as building setbacks, mixed land uses, and school siting are mentioned but do not
Transportation does not mention the importance of connectivity of sidewalks, street patterns, and
other pedestrian facilities.
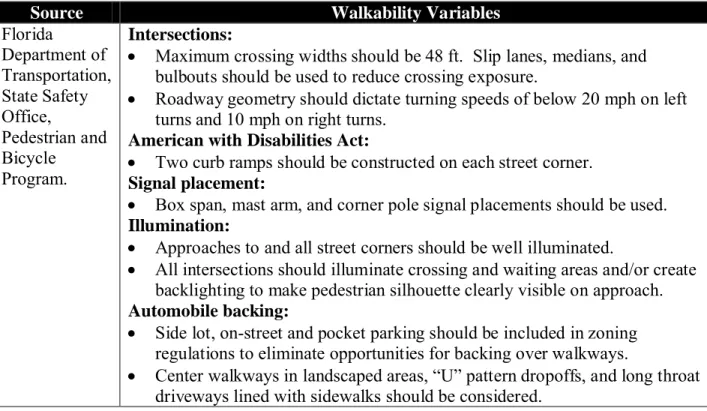
New factors in the walkability discussion that arise from the Florida Department of Transportation include intersections, American with Disabilities Act (ADA), signal placement,
and illumination. Table 2 details these new categories in more detail. As can be seen, the Florida Department of Transportation further expands the type of variables that can be used to
define walkability.
Table 2: Walkability Variables from Florida Department of Transportation
Source Walkability Variables
Florida
Department of Transportation, State Safety Office,
Pedestrian and Bicycle
Program.
Intersections:
Maximum crossing widths should be 48 ft. Slip lanes, medians, and bulbouts should be used to reduce crossing exposure.
Roadway geometry should dictate turning speeds of below 20 mph on left turns and 10 mph on right turns.
American with Disabilities Act:
Two curb ramps should be constructed on each street corner.
Signal placement:
Box span, mast arm, and corner pole signal placements should be used.
Illumination:
Approaches to and all street corners should be well illuminated.
All intersections should illuminate crossing and waiting areas and/or create backlighting to make pedestrian silhouette clearly visible on approach.
Automobile backing:
Side lot, on-street and pocket parking should be included in zoning regulations to eliminate opportunities for backing over walkways.
Center walkways in landscaped areas, “U” pattern dropoffs, and long throat driveways lined with sidewalks should be considered.
While the above literature focuses mainly around fugitive resources, many peer-reviewed articles cover topics centered on walkability. In this process, many attempt to test the effect of
neighborhood design on factors such as travel mode or physical activity levels. In a study conducted by Saelens, et al [18], neighborhood-based differences in physical activity levels are
variables are studied for their impacts on physical activity levels. Residential density, proximity
to non-residential land uses, connectivity, street patter, walking facilities, aesthetics, traffic safety, crime safety are considered as variables that impact the walkability of an environment. Saelens further defines walkability by differentiating between levels of walkability. A
high-walkable neighborhood is characterized as one with a concentration of non-residential land uses along a main corridor of the neighborhood and a street pattern that is mostly grid-like, with short
block lengths and few cul-de-sacs, thus an indicator of greater street connectivity. Saelens defines a low-walkable neighborhood as one with longer block lengths, a mixture of grid-like and curvilinear street patterns, and more cul-de-sacs. While these classifications are small and
broad, they provide yet another example of how varied the term walkability is applied.
In a much more detailed research study, Shriver [19] conducted a survey of four Austin,
Texas neighborhoods to test the influence of environmental design on pedestrian travel behavior. Using two pairs of neighborhoods classified as either a traditional neighborhood, typically
known to be more walkable, or a modern neighborhood, designed solely for automobile use,
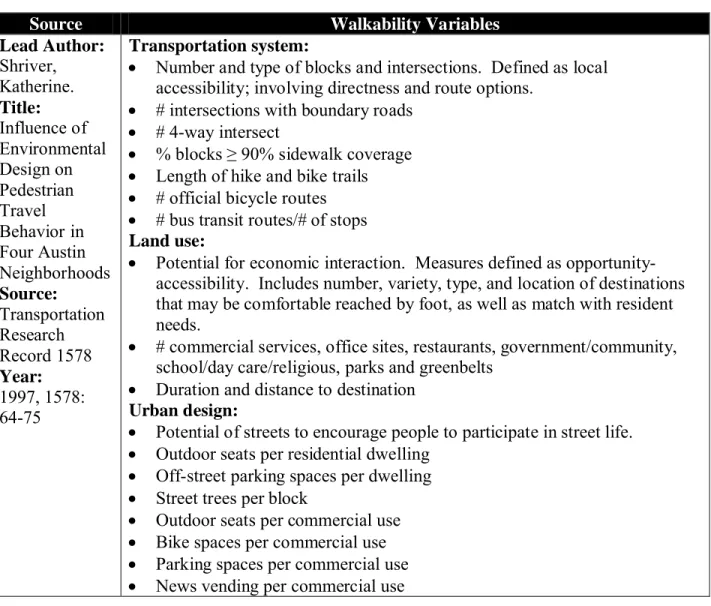
Shriver classifies walkable environments based on three broad characteristics: transportation system, land use, and urban design. Table 3 on the following page details what types of
variables fall under each category.
As noted in the transportation system classification, Shriver applies heavy importance to the street network a neighborhood to determine if it is walkable. Serving as a proxy for
accessibility to measure directness and route options, Shriver uses variables such as block lengths, number of 4-way intersections, sidewalk system that covers over 90% of neighborhood
of destinations that can be reached by foot. New walkability variables that Shriver applies
however fall under the urban design category, which are used to determine features that encourage individuals to be outside and participate in street life. Of all the walkable variables provided by Shriver, it must be noted that none provide an actual prescription of what or how
much a walkable neighborhood should have. Instead, the article simply states that a traditional or walkable neighborhood typically has a greater number of each variable than a modern
neighborhood.
Table 3: Walkability Variables from Shriver, 2004
Source Walkability Variables
Lead Author:
Shriver, Katherine.
Title:
Influence of Environmental Design on Pedestrian Travel Behavior in Four Austin Neighborhoods
Source:
Transportation Research Record 1578
Year:
1997, 1578: 64-75
Transportation system:
Number and type of blocks and intersections. Defined as local accessibility; involving directness and route options.
# intersections with boundary roads
# 4-way intersect
% blocks ≥ 90% sidewalk coverage Length of hike and bike trails
# official bicycle routes
# bus transit routes/# of stops
Land use:
Potential for economic interaction. Measures defined as opportunity-accessibility. Includes number, variety, type, and location of destinations that may be comfortable reached by foot, as well as match with resident needs.
# commercial services, office sites, restaurants, government/community, school/day care/religious, parks and greenbelts
Duration and distance to destination
Urban design:
Potential of streets to encourage people to participate in street life.
Outdoor seats per residential dwelling
Off-street parking spaces per dwelling
Street trees per block
Outdoor seats per commercial use
Bike spaces per commercial use
Parking spaces per commercial use
A different method used to define and assess walkability in research has been the use of
case studies. In this type of study, researchers examine and compare specific study areas that are deemed to have built environment characteristics that have traditional, neo-traditional, or modern neighborhood design. Neo-traditional neighborhood design is a recent attempt to design and
construct neighborhoods focused on pedestrian and bicycle travel rather than the automobile as they were before WWII (with traditional neighborhoods).
Southworth [20,21] has two studies that use a case study to compare and contrast the characteristics of these types of neighborhoods in California. In Southworth & Owens [20], three levels of walkability variables are examined to provide a very in-depth assessment of what
defines walkability. Community level variables include the large scale patterns of streets, land use, and growth patterns over time. Variables that assess neighborhood level compare
intermediate patterns of blocks, streets, and intersections in primarily single-family neighborhoods in which would require less than 10 minutes to walk across. Finally, the individual street and house lot level are examined, including street cross-sections, lot
configurations, and building types.
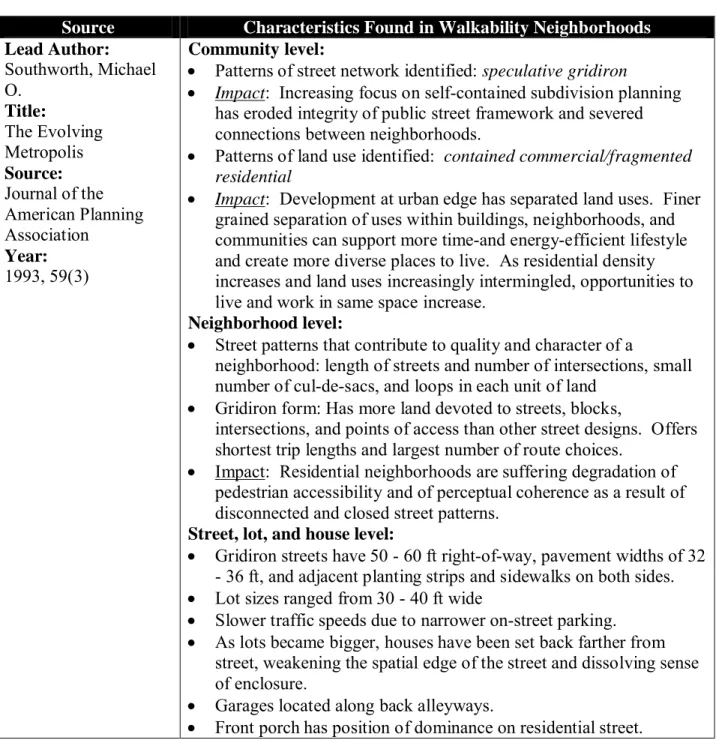
Table 4 provides a summary of the major highlights from Southworth & Owens [20]. A
fully detailed explanation of the findings can be found in the Appendix. Variables that are used in this particular piece of literature to define walkability include the major repetitive ones, including mixed land uses, residential density, gridiron street pattern, shorter block lengths,
narrow street widths and lot sizes, small setbacks, and the location of garages and porches. More importantly, due to the fact that Southworth’s research is based on case study methodology, the
walkable environment has narrow streets and lot widths, results provide the reader with a
specific set of ranges for each (32-36 feet street widths; 30-40 feet lot widths). It is interesting, however, to note that the presence of sidewalks is not mentioned.
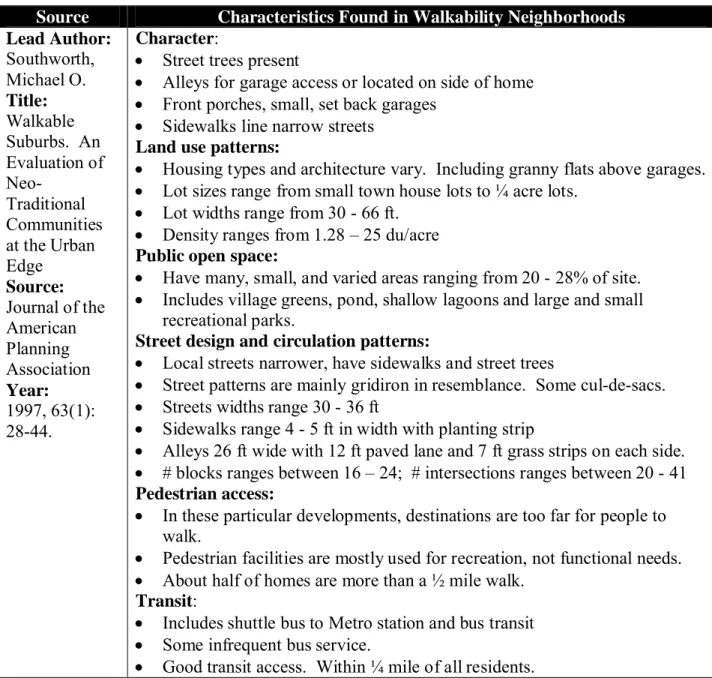
Southworth [21] continues the use of the case study methodology by comparing the urban
form of two neo-traditional neighborhoods and one traditional, turn-of-the-century streetcar suburb in California. Southworth [21] is unique in that it gives readers the opportunity to learn
how very different three urban environments can be, regardless if they are all classified as walkable. Therefore, the findings from this article are of particular importance because it proves that there can be variance in describing walkability.
Variables that are used to define the walkability of each neighborhood in Southworth [21] include neighborhood character, land use patterns, public open space, street design and
circulation patterns, pedestrian access, and transit. Within each of these categories, a number of individual variables are included. Architecture, location of garages, and presence of trees and sidewalks are factors that contribute to the pedestrian character of an environment. A mix of
housing type, housing architecture, lot sizes, and densities comprise land use patterns. Street design and circulation patterns measure connectivity levels through analysis of street patterns,
number of blocks, intersections, access points, and cul-de-sacs. Finally, pedestrian access determines if a neighborhood has pedestrian facilities, including the presence of sidewalks, bike paths, and connection to retail and service destinations. Table 5 characterizes a portion of the
Table 4: Walkability Variables from Southworth & Owens, 1993
Source Characteristics Found in Walkability Neighborhoods
Lead Author:
Southworth, Michael O.
Title:
The Evolving Metropolis
Source:
Journal of the American Planning Association
Year:
1993, 59(3)
Community level:
Patterns of street network identified: speculative gridiron
Impact: Increasing focus on self-contained subdivision planning has eroded integrity of public street framework and severed connections between neighborhoods.
Patterns of land use identified: contained commercial/fragmented residential
Impact: Development at urban edge has separated land uses. Finer grained separation of uses within buildings, neighborhoods, and communities can support more time-and energy-efficient lifestyle and create more diverse places to live. As residential density increases and land uses increasingly intermingled, opportunities to live and work in same space increase.
Neighborhood level:
Street patterns that contribute to quality and character of a
neighborhood: length of streets and number of intersections, small number of cul-de-sacs, and loops in each unit of land
Gridiron form: Has more land devoted to streets, blocks,
intersections, and points of access than other street designs. Offers shortest trip lengths and largest number of route choices.
Impact: Residential neighborhoods are suffering degradation of pedestrian accessibility and of perceptual coherence as a result of disconnected and closed street patterns.
Street, lot, and house level:
Gridiron streets have 50 - 60 ft right-of-way, pavement widths of 32 - 36 ft, and adjacent planting strips and sidewalks on both sides.
Lot sizes ranged from 30 - 40 ft wide
Slower traffic speeds due to narrower on-street parking.
As lots became bigger, houses have been set back farther from street, weakening the spatial edge of the street and dissolving sense of enclosure.
Garages located along back alleyways.
Table 5: Walkability Variables from Southworth, 1997
Source Characteristics Found in Walkability Neighborhoods
Lead Author:
Southworth, Michael O.
Title:
Walkable Suburbs. An Evaluation of
Neo-Traditional Communities at the Urban Edge
Source:
Journal of the American Planning Association
Year:
1997, 63(1): 28-44.
Character:
Street trees present
Alleys for garage access or located on side of home
Front porches, small, set back garages
Sidewalks line narrow streets
Land use patterns:
Housing types and architecture vary. Including granny flats above garages.
Lot sizes range from small town house lots to ¼ acre lots.
Lot widths range from 30 - 66 ft.
Density ranges from 1.28 – 25 du/acre
Public open space:
Have many, small, and varied areas ranging from 20 - 28% of site.
Includes village greens, pond, shallow lagoons and large and small recreational parks.
Street design and circulation patterns:
Local streets narrower, have sidewalks and street trees
Street patterns are mainly gridiron in resemblance. Some cul-de-sacs.
Streets widths range 30 - 36 ft
Sidewalks range 4 - 5 ft in width with planting strip
Alleys 26 ft wide with 12 ft paved lane and 7 ft grass strips on each side.
# blocks ranges between 16 – 24; # intersections ranges between 20 - 41
Pedestrian access:
In these particular developments, destinations are too far for people to walk.
Pedestrian facilities are mostly used for recreation, not functional needs.
About half of homes are more than a ½ mile walk.
Transit:
Includes shuttle bus to Metro station and bus transit
Some infrequent bus service.
Good transit access. Within ¼ mile of all residents.
As Table 5 shows, even within neighborhoods that are classified as walkable, there can
be variance in what variables are present. Regardless of the variance in street widths, lot sizes, and block numbers, the fact that each of the three neighborhoods posses these variables proves
mentioned walkability variables are present. However, it is important to note the findings
regarding land use and pedestrian access within these walkable communities. Southworth’s case study shows that within these communities, destinations are located too far for individuals to walk. Therefore, facilities such as sidewalks are primarily used for recreational rather than
utilitarian purposes. Contrary to other literature, this is the first article that defines walkability without listing mixed land uses within a quarter or half-mile, a reasonable walking distance, of
homes as a major variable. Even in the one walkable neighborhood that does posses a town center and other small commercial uses, about half of the homes are more than a half mile walk, thus out of utilitarian travel distance for most individuals.
While much of the previously discussed literature provides a wide range of definitions for walkability, each includes at least some variety and more importantly detail of what variables are
included. However, this is not the case in all research. In many articles, the term walkability is used with only small attention paid to what exactly it comprises, and in some cases, no definition is given at all. Instead what occurs in this type of literature, an environment is merely stated as
being walkable or having a high or low walkability level. With the literature only proclaiming that an environment is designed to foster more walking, it is left up to the reader to determine
what this walkable environment actually looks like in reality. This lack of detail is when the term walkability runs the risk of being most overused, and therefore has a higher risk of losing meaning.
A study conducted by Friedman, et al [22] provides an example somewhat similar to this problem. In this research, the effects of nontraditional neighborhood design on travel
obvious variables. Mixed land uses, the existence of a downtown commercial district with
on-street curbside parking, interconnected on-street grid pattern, and residential neighborhoods in close proximity to nonresidential land uses are the only variables used to define the walkable
environments. No prescriptions, attention to traffic, schools, open space, pedestrian facilities, or
other significantly noted variables are included.
In another article that tests environmental design on pedestrian travel, Lund [23] uses a
narrower definition of walkability, however, one that is not detailed enough to contribute significantly to a well defined walkability definition. Walkability variables that are included in Lund’s research are access to retail and parks, route directness, quality of pedestrian
environment, and quality of local park/shopping areas. As is evident, some of the most widely recognized variables are present, such as mixed land use and presence of pedestrian facilities like
sidewalks, with many others left out. Variables such as schools, access to transit, and connectivity are not mentioned.
At the complete end of the spectrum are articles and reports that discuss walkability
without never truly providing a definition at all. It is understood that the focus of these types of articles are not centered solely on the built environment and consequently walkability, and
therefore may not feel the need to provide a detailed definition of the term. However, the ways in which this term is presented in the articles adds significant confusion to any definition of walkability. In Rohrer, et al [24], walkability is the center of a study focused on testing for
self-rated health in primary care patients. In this study, an area is defined as walkable solely if it has “convenient places to walk.” Therefore, an environment could be classified as walkable if there
Litman [25] provides much of the same result. In this report, a variety of methods are
provided to measure the economic value of walkability. However, a vague attempt is made to define walkability. According to Litman, walkability is defined as “the quality of walking conditions, including factors such as the existence of walking facilities and the degree of walking
safety, comfort, and convenience.” Focusing on pedestrian facilities, safety, comfort, and convenience are variables that have been mentioned in other research, but this particular report
does not detail what is meant by each variable. A number of assumptions must be made to correctly identify how walkability is portrayed: pedestrian facilities possibly referring to
sidewalks, crosswalks, and other similar facilities; safety defined as variables that increase traffic
and/or personal safety, such as traffic calming measures or neighborhood watch organizations; comfort could be presence of seating, street trees, or good street orientation; and mixed land uses
and good connectivity and accessibility defined as convenience. However, any one of these assumptions could be incorrect. Therefore as is evident, this vagueness allows for a subjective interpretation of what could be classified as walkable.
SUMMARY OF WALKABILITY FINDINGS
As much of literature surrounding walkability suggests, there is neither one way nor a set
pattern to define what variables constitute a walkable environment. Depending on the source and purpose of an article or report, discussions of walkability vary based on level of detail, the size of built environment, recommendations for size and scope such as length, width, and density
levels, and can posses any number of different variables. Table 6 on the following pages provides a summary of the major findings from the walkability literature. The categories of
exhaustive list of walkability variables as those presented are only the ones that were heavily
cited in the literature included in this research. As there may be additional categories and variables that are not included, it is only intended to highlight the major agreements and
disagreements in walkability definitions. Among the included research, a total of 13 categories
of walkability variables were found. Depending on the category, there are a number of
individual variables within each category that can be applied. For example, the high connectivity
category includes variables such as block length, number and type of intersections, and connections to destinations.
The findings show that the two most prevalent categories in the literature are the presence
of pedestrian facilities and high accessibility to other uses, each with nine different articles mentioned their importance to a walkable environment. These findings are consistent with the
walking behavior literature that show that the presence of pedestrian facilities [28, 30-31, 35, 28, 41] and accessibility to other uses [27, 29, 30-32, 35, 37-38, 41] are most associated with
increases in walking. In defining these two variables, both the walkability and walking behavior
literature agree that pedestrian facilities should be measured based on the presence of sidewalks, crosswalks, and other walking trails, typically 5 feet wide, in an environment. Likewise,
accessibility to other uses is a way to measure the proximity of uses to one another as well as to residential areas. Most literature defines the proper measurement for this proximity as ½ mile in distance. Other highly cited categories include the presence of mixed land uses, high street and
pedestrian connectivity, presence of a grid-like street pattern, presence of parks and open space, attractive aesthetics, low traffic speeds, and access to transit. Valuable walkability variables that
residential density, neighborhood school location, and compliance with the American with
Table 6: Summary of Findings from Walkability Literature
Walkability
Variable Source Prescription for Variable
Burden, Walkable Communities, Inc.
Within 800 ft of 90% of homes
Corbett & Velasquez, 1994 Only for presence Florida Department of
Transportation, 1995
Only for presence
Lund, 2003 Only for presence
Shriver, 1997 Only for presence Parks, plazas, and
open space
Southworth, 1997 Within ½ mile of homes Burden, Walkable
Communities, Inc.
5 ft wide; cover 80% of homes and all streets; planting strip
Corbett & Valasquez, 1994 Only for presence Florida Department of
Transportation, 1995
5 – 7 ft wide; cover all streets; planting strip
Lund, 2003 Only for presence
Saelens, et al, 2003 Only for presence Shriver, 1997 90% of streets Southworth & Owens, 1993 Only for presence
Southworth, 1997 4 – 5 ft wide with planting strip Pedestrian facilities
(Presence of sidewalks, crosswalks, and walking trails)
Litman, 2003 Only for presence Burden, Walkable
Communities, Inc.
400 – 600 ft block length; connections to streets, schools, parks, and other areas within 1/4th mile walk of center
Corbett & Valasquez, 1994 Connections to all destinations Saelens, et al, 2003 Short block lengths
Shriver, 1997 Only presence of intersections with boundary roads and 4-way intersections Southworth & Owens, 1993 Short block lengths, high number of
intersections High connectivity
(block lengths, intersections, connections to destinations, etc)
Southworth, 1997 High number of intersections Burden, Walkable
Communities, Inc. Grid or similar highly connected pattern Friedman, et al, 1994 Grid
Saelens, et al, 2003 Grid
Shriver, 1997 Grid (high presence of 4-way intersections)
Southworth & Owen, 1993 Grid Street pattern
Table 6: Summary of Findings from Walkability Literature, continued
Walkability
Variable Source Prescription for Variable
Burden, Walkable Communities, Inc.
Mix of retail, commercial, civic, and variety of housing types; Within 2500 ft of 80% of homes; 20% of housing stock should be affordable
Corbett & Valasquez, 1994 Mix of retail, commercial, civic, and variety of housing types
Florida Department of Transportation, 1995
Mix of retail, commercial, civic, and variety of housing types
Friedman, et al, 1994 Mixed use downtown commercial district Lund, 2003 Mix of retail and commercial
Saelens, et al, 2003 Mix of retail and commercial
Shriver, 1997 Mix of retail, commercial, civic, and variety of housing types
Mixed land uses
Southworth & Owens, 1993 Mix of retail, commercial, civic, and variety of housing types
Burden, Walkable Communities, Inc.
Destinations within 1/8th mile
Corbett & Valasquez, 1994 Destinations located in close proximity to one another and to residential uses
Florida Department of
Transportation, 1995 ½ mile radius used for acceptable walking distances between trip origins and destinations
Friedman, et al, 1994 Destinations located in close proximity to one another and to residential uses
Saelens, et al, 2003 Destinations located in close proximity to one another and residential uses
Shriver, 1997 Destinations located in close proximity to one another and residential uses
Lund, 2003 Important destinations located in close proximity to one another and residential uses
Rohrer, et al, 2004 Convenient places to walk Accessibility /
Convenience to other uses (Proximity to destinations within walking distance)
Litman, 2003 Convenient places to walk Burden, Walkable
Communities, Inc.
Setbacks 15 – 25 ft
Corbett & Valasquez, 1994 Street orientation that contributes to energy efficiency of community Southworth & Owens, 1993 Lot widths 30 – 40 ft; Garages located
along alleyways; Porches located along sidewalk
Street orientation (setback, lot width, etc)
Table 6: Summary of Findings from Walkability Literature, continued
Walkability
Variable Source Prescription for Variable
Burden, Walkable Communities, Inc.
Homes along 90% of streets have pleasing architecture; 15% of front yard space devoted to landscaping; Benches every 200 ft; Presence of street trees Corbett & Valasquez, 1994 Only for presence of landscaping Florida Department of
Transportation, 1995 All commercial, entertainment, and school areas should be well illuminated; Intersection lighting should illuminate crossings and waiting areas
Saelens, et al, 2003 Presence of street trees; Interesting things to look at; Homes have attractive
architecture Aesthetics
(Friendly neighborhood, attractive, pleasant architectural design, vegetation, etc)
Shriver, 1997 Presence of street trees; Outdoor seating in residential and commercial areas Burden, Walkable
Communities, Inc.
At least 6 – 7 du/a; Should be 10 – 11 du/a
Saelens, et al, 2003 Only for presence of higher density Residential density
Southworth, 1997 1.28 – 25 du/a Burden, Walkable
Communities, Inc.
Most streets 15 – 25 mph; Collectors 30 – 35 mph; Speed reductions through street narrowing, curb extensions, tree
canopies, mini-circles, on-street parking Corbett & Valasquez, 1994 Streets should be designed to reduce
speeds Florida Department of
Transportation, 1995
15 – 20 mph around schools
Saelens, et al, 2003 Only for presence of low traffic volumes and speeds
Traffic calming and street speeds
Litman, 2003 Only for presence of safety features Burden, Walkable
Communities, Inc.
Elementary school located to where 80% of all children can walk no more than 2500 ft; Middle school reach 80% of all children within 5000 ft
Neighborhood schools
Florida Department of Transportation, 1995
Table 6: Summary of Findings from Walkability Literature, continued
Walkability
Variable Source Prescription for Variable
Burden, Walkable Communities, Inc.
Transit stops within ¼ to ½ mile of trip origins
Corbett & Valasquez, 1994 Only for presence Florida Department of
Transportation, 1995
½ mile distance to transit stops from trip origins; Bus stop at far-side of
intersection to prevent visual obstruction Shriver, 1997 Presence of high number of transit routes
and stops Access to transit
Southworth, 1997 Presence of transit stops within ¼ mile of residents
Burden, Walkable Communities, Inc.
New walkway, trail and sidewalk construction is ADA compliant. 2 curb ramps per corner
American with Disabilities compliant
Florida Department of Transportation, 1995
L
ITERATURER
EVIEW: B
EHAVIORALO
UTCOMESTHE CONNECTION TO THE WALKING BEHAVIOR
As the walkability literature has shown, a definition of walkability centers on a list of
variables that are hypothesized to have the largest effect on the walking behavior. Therefore, in order for an environment to produce an increase in walking, it must first possess the variables
that have been proven to be correlates of walking. While much of the walkability literature has attempted to create a list of variables that has the behavioral outcome of increased walking, one of its primary problems is that the empirical data that it relies upon has not adequately
determined the effects of these variables on the walking behavior. Identifying the strongest correlates and properly isolating their relationship with the walking behavior is a current research
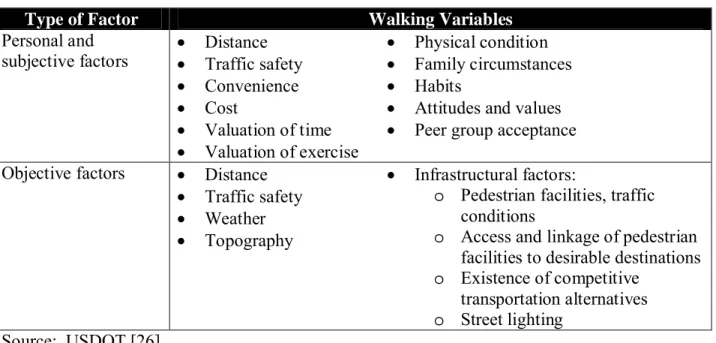
dilemma. Regardless of this difficultly, many attempts have been made to decipher what factors influence the decision to walk. Table 7 better explains the range that exists in walking correlates. Produced from the National Bicycling and Walking Study from the Federal Highway
Administration, this list of variables comes from a compilation of reports and case studies that were used to identity ways of increasing bicycling and walking [26]. As evident, walking
Table 7: Factors Influencing the Walking Behavior
Type of Factor Walking Variables
Personal and
subjective factors DistanceTraffic safety
Convenience
Cost
Valuation of time
Valuation of exercise
Physical condition
Family circumstances
Habits
Attitudes and values
Peer group acceptance
Objective factors Distance
Traffic safety
Weather
Topography
Infrastructural factors:
o Pedestrian facilities, traffic
conditions
o Access and linkage of pedestrian
facilities to desirable destinations
o Existence of competitive
transportation alternatives
o Street lighting
Source: USDOT [26]
Even with an understanding of what variables potentially affect the decision to walk, little empirical evidence has proven which of the above variables serve as the strongest correlates of this behavior. However, there has been a considerable amount of attempts to do such a feat. In
order to create a satisfactory definition of walkability and to test whether previous definitions are adequate and include the proper variables, one must examine the walking behavior literature.
Creating a list of variables that have been proven to be the strongest correlates of walking can then inform researchers and practitioners on what variables should be included in a working definition of walkability. While the articles included in this literature review are not a
comprehensive list of all attempts to correlate the built environment with the walking behavior, they do provide an adequate range of literature that will help draw meaningful conclusions as
which variables should be included in a walkability definition. A total of 15 documents are used in the following sections to highlight the most important correlates of the walking behavior. A list of tables is included in the Appendix that provides a basic synopsis of the major research
CORRELATES OF WALKING: FINDINGS FROM THE LITERATURE
In an attempt to test the relationship of aesthetics, convenience, and company with walking for exercise of Australian adults, Ball, et al [27] found that recreational walking is directly associated with all three putative environmental influences, regardless if one was in good
or poor mental and physical health. Variables that were assessed under the category of aesthetics include neighborhood friendliness, attractiveness, and pleasantness of walking near one’s home.
Accessibility to destinations within walking distance is categorized as convenience, and company is defined as having someone, either another person or a pet, to walk with in one’s neighborhood.
In another study of Australian adults, Giles-Corti & Donovan [28] studied the influences of individual, social environmental, and physical environmental variables on walking for
transportation, recreation, and for meeting recommended levels of walking. Results showed that in the previous two weeks following a household telephone survey, 72% of respondents had walked for transportation, 69% for recreation, but only 17% received recommended levels of
walking. In addition, social environmental variables, such as those that assess company, were significantly associated with meeting recommended levels. Physical environmental variables
that were found to be correlated with walking include access to open space, low traffic volumes, presence of street trees and sidewalks, and mixed land use. Table 8 provides a summary of the strength of the physical environment variables findings from Giles-Corti & Donovan [28]. It is
Table 8: Correlates of Walking from Giles-Corti & Donovan, 2003
Source Physical Environment Variables
Lead Author:
Giles-Corti, Billie
Title:
Relative Influences of Individual, Social
Environmental, and Physical Environmental Correlates of Walking
Source:
American Journal of Public Health
Year:
2003, 93(9): 1583-1589
Relative to respondents in bottom quartile of access to public open space, odds of walking at recommended levels were 47% higher among those in top quartile.
Those who lived on street with one or both of no major traffic and street trees were 50% more likely to reach recommended levels of walking.
In comparison to those who had no sidewalk and no shop on their street, those who had access to either or both were about 25% more likely to reach recommended levels of walking.
Weak evidence that those who achieved recommended levels were more likely to live on a street that was
aesthetically pleasing, with minor traffic, trees, sidewalks, or local shop.
Using a website-delivered self-help physical activity program in a workplace setting, Humpel, et al [29] studied changes in perceived environmental attributes on neighborhood
walking levels. Findings from the study show that men who increase their perceptions of aesthetics were 2.25 times more likely to have increased walking and twice as likely to walk more than recommended levels than men who did change their perceptions of aesthetics.
Convenience of walking destinations, such as other land uses, and smaller perceptions of traffic problems were also associated with positive increases in walking for men and women.
In Hoehner, et al [30] four categories of variables are tested on their influences on transportation and recreational physical activity levels. Using a cross-sectional study of a low-walkable and high-low-walkable city in the United States, variables such as land use, recreational
facilities, transportation environment, aesthetics, and the social environment are examined for their affects on minutes of walking and bicycling. Results showed that 50% of individuals living
Likewise, 73% of respondents living in the high-walkable city were more likely to meet
recommendations through recreational activities, compared to 54% living in the city classified as low-walkable.
The findings from Hoehner, et al [30] found a number of variables associated with
walking for transportation or recreational activity. Mixed land use, proximity to parks, trails, and open space, presence of transit stops, attractive features, street trees, and company were all
associated with walking for either form of walking. Variables that were found to have little or no association include the perceived presence of sidewalks along neighborhood streets (only slightly positive) for transportation activity and no association for recreational activity, and traffic safety
was not associated with either form of walking.
The influence of home- and neighborhood-based physical activity opportunities are
assessed for their impacts on walking by Powell, et al [31]. A direct relation was found between convenience of walking places and the proportion of respondents meeting current physical activity recommendations via the walking behavior. Significant variables that are most notable
include convenience to parks, walking trails, and other destinations as well as neighborhood sidewalks. Data from Powell, et al [31] suggests that proximity is an important factor in
identifying places to walk.
While the previous articles have tested primarily convenience to destinations and walking facilities, a study conducted by Cervero & Duncan [32], and based on data from a travel survey
in the San Francisco Bay Area, expands to include other built environment factors such as density, block size, and other street and urban design characteristics. Table 9 highlights many of
Table 9: Street and Urban Design Factors Affecting Walking from Cervero & Duncan, 2003
Source Physical Environment Variables
Lead Author:
Cervero, Robert
Title:
Walking, Bicycling, and Urban
Landscapes: Evidence from the San
Francisco Bay Area
Source:
American Journal of Public Health
Year:
2003, 93(9): 1478-1483
Pedestrian-friendly factors:
Block size / intersection attributes of trip origins accounted for 21.5% of total variance in walking/bicycling trips.
Areas with 4-way intersections (gridiron street patterns) and 5 or more converging streets (even higher levels of connectivity) positively associated with pedestrian-friendly factor.
Walking-Choice Model results:
Trip purpose weighted heavily in predictive powers of walking. Social purposes (0.886), recreation/entertainment (0.809), eating/meal purposes (0.688), and shopping purpose (0.623) on a 0-1 scale scored highest (p=0.000).
Impedance factors: Trip distance (-1.970), slope (-4.109), rainfall (-0.729), dark (-0.158), and neighborhood quality (-0.766) all decreased likelihood of walking.
Only built environment factor significant was land use diversity at trip origin (within 1-mile radius of person’s residence). Balanced, mixed-use environs with retail services significantly induced walking. Land use diversity at destination encouraged walking; however relation was statistically weak.
Pedestrian-friendly designs at neither organ nor destination had much bearing on mode choice. Intersection configurations and block sizes exerted inconsequential influences on walking.
As can bee seen, results from the walking-choice model show that trip purpose weighted heavily in predicting whether one walks: with social trips and recreation/entertainment
outweighing transportation trips for shopping. Factors found to impede walking include trip distance, terrain slope, weather, and neighborhood quality. Land use diversity at trip origin was found to be significantly related to walking. While no relationship was found for intersection
configurations and block sizes, street designs consistent with the grid pattern (4-way
intersections) were found to be correlated with being pedestrian-friendly. Findings from Cervero
Employment density, population density, and land use mix are tested for their influences
on walking for utilitarian travel in Frank & Pivo [33]. Findings show that walking trips to work were found to be positively correlated with all three factors, while walking trips for shopping was only correlated with employment density and population density. More importantly
however, results indicate that an increase in population density can result in both a increase in origin and in destination walking trips for shopping and to work. Contradictory to other
findings, mixed land uses was found to be only associated with walking for work trips.
In an in-depth analysis using data from the metropolitan Atlanta region, Lawrence, et al [34] found that the number of minutes one performs moderate physical activity, such as walking,
per day is significantly correlated with land use mix, net residential density, and street
connectivity. Land use mix was found to have the greatest correlation of walking minutes, then
residential density followed by street connectivity. In order to control for the effects of each of these variables upon one another, a walkability index was created to integrate each into a formula with weights to predict the variation in number of minutes spent walking per day. Significant
findings from the walkability index indicate that individuals, on average, were 30% more likely to record meeting 30-minutes of walking per day with each increase in walkability index
quartile. The odds of meeting recommended levels of walking were 2.4 times greater for the highest quartile (4th) group than those in the least walkable group.
Ease of pedestrian flow, street design characteristics, route directness, and residential
density are measured in Moudon, et al [35] for their affects on pedestrian travel in 12
neighborhood centers in the Puget Sound area. Using a case study approach, sites that are have
volumes. Urban environments with a density of greater than 7 du/a, high land use mix, presence
of sidewalks, and residential and commercial destinations within walking distance of homes were considered walkable. As Table 10 indicates, sites with these characteristics averaged 26 more pedestrians walking per hour than suburban sites. The summary statistics of site design
measures also shows that factors such as block length and sidewalk system completeness increase the number of individuals walking within their environment.
Table 10: Site Design Characteristics Affecting Pedestrian Travel from Moudon, et al 1997
Source Site Design Characteristics Affecting Pedestrian Travel
Lead Author:
Moudon, A.V.
Title:
Effects of Site Design on Pedestrian Travel in Mixed-Use, Medium-Density Environments
Source:
Transportation
Research Record 1578
Year:
1997, 1578: 48-55
Average pedestrian volumes per site (per hour per 1000 residents): High walkability environments (urban): 38
Low walkability environments (suburban): 12
Summary site design measures and pedestrian volumes: Block size (ha): U=1.1; S=12.8; ratio= 1:12.2
Street system length: U=48; S=15.9; ratio= 1:0.33
Sidewalk system length: U=60.5; S=12.6; ratio= 1:0.21
Sidewalk system completeness: U=1:0.97; S=1:0.55; ratio= 1:0.57
Population density (people/ha): U=34.3; S=31.5; ratio= 1:0.92
Pedestrians/hr/1000 residents: U=38; S=12; ratio= 1:0.33
Pedestrians/hr: U=217; S= 68; ratio: 1:0.30
While many of the previously included literature highlights walking for any purpose, a
number of articles test the built environment for its affects solely on walking trips to
transportation. In Cervero & Gorham [36], transit neighborhoods are compared to
automobile-oriented neighborhoods for their abilities to produce walking trips to work. Transit
neighborhoods have high proportions of 4-way intersections (grid pattern) with higher density and mixed uses compared to the auto neighborhoods with many cul-de-sacs and low density
pairs of transit neighborhood analyzed, generating around 120% more pedestrian trips than the
matched auto neighborhoods.
In another article written by Cervero [37], mixed land use, housing type, and residential density are examined for their affects on creating walking to work trips based on data from the
1985 American Housing Survey. Variables that were found to be most correlated with walking are density, having commercial and other non-residential land uses within 300 feet of one’s
home, and residing within a quarter mile of one’s job. Housing types of with increased density also significantly increased the probability of walking. However, the presence or absence of neighborhood shops was found to be a better predictor of mode choice than residential densities
for walking, thus suggesting that mixed land uses are more important than density levels. Craig, et al [38] furthers the research on factors affecting walking to work by expanding
the variables to include social dynamics, walking routes, ability to meet pedestrian needs, and complexity of stimulus in the environment as well as many of the more researched variables such as the number of destinations within walking distance of one’s home and mixed land uses.
Based on data from Canadian adults, factors that contributed and hindered walking to work were found. Variables with the greatest influence on walking to work found to be significant included
the lack of obstacles, such as debris, construction, and maintenance, safety from crime, the amount of time and effort required, meeting pedestrian’s needs (continuity of routes, multiple route choices), and existence of continuous sidewalks and paths. Lack of features making
neighborhood accessible by all individuals, overload of visual and auditory stimuli, high traffic threats, potential for crime, and a lack of variety of destinations were found to inhibit walking to